OPEN-SOURCE SCRIPT
Institutional Retail Trap PRO
Description:
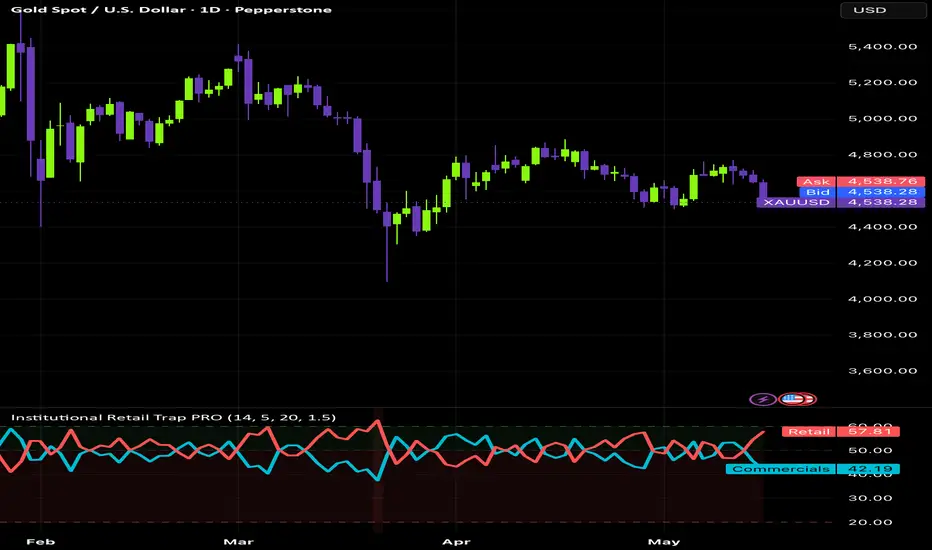
Institutional Retail Trap PRO is an advanced order flow indicator designed to identify the behavioral difference between institutional ("smart money") participants and retail traders — and more importantly, to detect when retail traders are caught on the wrong side of the market.
Unlike standard momentum indicators, this tool weights price movement against relative volume and candle displacement to estimate who is actually driving price at any given moment.
How it works:
The indicator calculates buy and sell pressure based on where price closes within each candle's range, then scales that pressure by relative volume (current volume vs. average volume). This creates a raw flow signal that is split into two streams — one representing institutional activity and one representing retail activity — both normalized using RSI to produce clear, readable oscillator lines.
The two lines:
Aqua line (Commercials / Smart Money) — rises when volume-weighted buying pressure dominates, suggesting institutional accumulation or aggressive buying
Red line (Retail Traders) — the inverse, rising when retail-style selling or chasing behavior dominates
Key levels:
Above 60 — dominant zone, one side is in control
50 — equilibrium, no clear dominance
Below 20 — exhaustion zone, the dominant flow is fading
Signals:
Lime circle (Smart Money Entry) — smart money line crosses above retail line while still in low territory, suggesting institutional accumulation beginning
Orange circle (Smart Money Exit) — smart money line crosses below retail line from high territory, suggesting distribution
Red triangle down (Retail Long Trap) — retail is overextended long while smart money is weak and price closes bearish with displacement — classic bull trap setup
Aqua triangle up (Retail Short Trap) — retail is overextended short while smart money is strong and price closes bullish with displacement — classic bear trap setup
Background shading:
Green background — smart money in dominant zone
Red background — retail flow dominant, potential exhaustion or reversal ahead
Displacement filter:
A built-in displacement filter ensures signals only trigger when the candle body exceeds the average range by a configurable multiplier. This filters out low-conviction signals during choppy, low-momentum periods.
Best used with:
Price action context, key support and resistance levels, volume profile, and multi-timeframe analysis. Works on all liquid markets — indices (ES, NQ, DAX), forex majors, gold (XAUUSD), and high-volume crypto pairs. Most effective on the 1m, 3m, 5m, and 15m timeframes for intraday trading.
Settings:
Flow Length — RSI normalization period (default 14)
Flow Smoothing — EMA smoothing on the raw flow signal (default 5)
Volume Average — baseline volume period for relative volume calculation (default 20)
Displacement Strength — multiplier for the candle body displacement filter (default 1.5)
Show Trap Signals — toggle all signals on/off
Show Zones — toggle zone fills on/off
Background Coloring — toggle background shading on/off
Note:
This indicator does not use real-time order book or Level 2 data. Institutional flow is estimated using price-volume analysis relative to recent averages. Always use in confluence with other tools and proper risk management. Past signals do not guarantee future results.
Institutional Retail Trap PRO is an advanced order flow indicator designed to identify the behavioral difference between institutional ("smart money") participants and retail traders — and more importantly, to detect when retail traders are caught on the wrong side of the market.
Unlike standard momentum indicators, this tool weights price movement against relative volume and candle displacement to estimate who is actually driving price at any given moment.
How it works:
The indicator calculates buy and sell pressure based on where price closes within each candle's range, then scales that pressure by relative volume (current volume vs. average volume). This creates a raw flow signal that is split into two streams — one representing institutional activity and one representing retail activity — both normalized using RSI to produce clear, readable oscillator lines.
The two lines:
Aqua line (Commercials / Smart Money) — rises when volume-weighted buying pressure dominates, suggesting institutional accumulation or aggressive buying
Red line (Retail Traders) — the inverse, rising when retail-style selling or chasing behavior dominates
Key levels:
Above 60 — dominant zone, one side is in control
50 — equilibrium, no clear dominance
Below 20 — exhaustion zone, the dominant flow is fading
Signals:
Lime circle (Smart Money Entry) — smart money line crosses above retail line while still in low territory, suggesting institutional accumulation beginning
Orange circle (Smart Money Exit) — smart money line crosses below retail line from high territory, suggesting distribution
Red triangle down (Retail Long Trap) — retail is overextended long while smart money is weak and price closes bearish with displacement — classic bull trap setup
Aqua triangle up (Retail Short Trap) — retail is overextended short while smart money is strong and price closes bullish with displacement — classic bear trap setup
Background shading:
Green background — smart money in dominant zone
Red background — retail flow dominant, potential exhaustion or reversal ahead
Displacement filter:
A built-in displacement filter ensures signals only trigger when the candle body exceeds the average range by a configurable multiplier. This filters out low-conviction signals during choppy, low-momentum periods.
Best used with:
Price action context, key support and resistance levels, volume profile, and multi-timeframe analysis. Works on all liquid markets — indices (ES, NQ, DAX), forex majors, gold (XAUUSD), and high-volume crypto pairs. Most effective on the 1m, 3m, 5m, and 15m timeframes for intraday trading.
Settings:
Flow Length — RSI normalization period (default 14)
Flow Smoothing — EMA smoothing on the raw flow signal (default 5)
Volume Average — baseline volume period for relative volume calculation (default 20)
Displacement Strength — multiplier for the candle body displacement filter (default 1.5)
Show Trap Signals — toggle all signals on/off
Show Zones — toggle zone fills on/off
Background Coloring — toggle background shading on/off
Note:
This indicator does not use real-time order book or Level 2 data. Institutional flow is estimated using price-volume analysis relative to recent averages. Always use in confluence with other tools and proper risk management. Past signals do not guarantee future results.
Open-source Skript
Ganz im Sinne von TradingView hat dieser Autor sein/ihr Script als Open-Source veröffentlicht. Auf diese Weise können nun auch andere Trader das Script rezensieren und die Funktionalität überprüfen. Vielen Dank an den Autor! Sie können das Script kostenlos verwenden, aber eine Wiederveröffentlichung des Codes unterliegt unseren Hausregeln.

Haftungsausschluss
Die Informationen und Veröffentlichungen sind nicht als Finanz-, Anlage-, Handels- oder andere Arten von Ratschlägen oder Empfehlungen gedacht, die von TradingView bereitgestellt oder gebilligt werden, und stellen diese nicht dar. Lesen Sie mehr in den Nutzungsbedingungen.
Open-source Skript
Ganz im Sinne von TradingView hat dieser Autor sein/ihr Script als Open-Source veröffentlicht. Auf diese Weise können nun auch andere Trader das Script rezensieren und die Funktionalität überprüfen. Vielen Dank an den Autor! Sie können das Script kostenlos verwenden, aber eine Wiederveröffentlichung des Codes unterliegt unseren Hausregeln.
Haftungsausschluss
Die Informationen und Veröffentlichungen sind nicht als Finanz-, Anlage-, Handels- oder andere Arten von Ratschlägen oder Empfehlungen gedacht, die von TradingView bereitgestellt oder gebilligt werden, und stellen diese nicht dar. Lesen Sie mehr in den Nutzungsbedingungen.