UVOL / DVOL Ratio
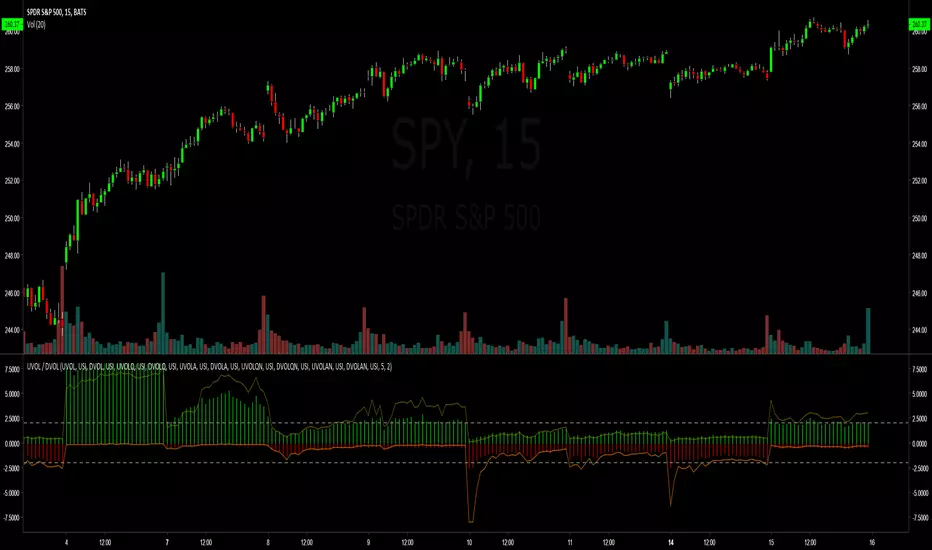
Plots the NYSE, NASDAQ, AMEX UP Volume and DOWN Volume ratios as a histogram - and adds the index UVOL / DVOL ratios as a line graph.
DVOL is represented as negative - UVOL as positive. When either is above 2 its a good predictor of the day's outcome. At least - it tells you if the bulls or bears are winning the day.
Really simple to use / edit to your needs
Enjoy
DVOL is represented as negative - UVOL as positive. When either is above 2 its a good predictor of the day's outcome. At least - it tells you if the bulls or bears are winning the day.
Really simple to use / edit to your needs
Enjoy

Haftungsausschluss
Die Informationen und Veröffentlichungen sind nicht als Finanz-, Anlage-, Handels- oder andere Arten von Ratschlägen oder Empfehlungen gedacht, die von TradingView bereitgestellt oder gebilligt werden, und stellen diese nicht dar. Lesen Sie mehr in den Nutzungsbedingungen.
Haftungsausschluss
Die Informationen und Veröffentlichungen sind nicht als Finanz-, Anlage-, Handels- oder andere Arten von Ratschlägen oder Empfehlungen gedacht, die von TradingView bereitgestellt oder gebilligt werden, und stellen diese nicht dar. Lesen Sie mehr in den Nutzungsbedingungen.