Jurik Velocity (VEL)
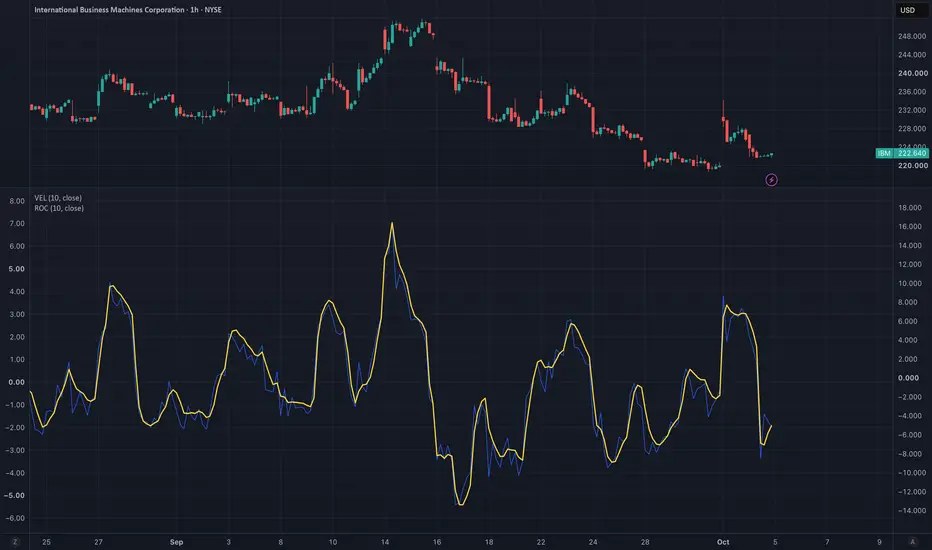
The Jurik Velocity (VEL) indicator is a differential signal processing oscillator that measures price rate-of-change through the instantaneous divergence between two weighted moving averages with distinct inertia profiles. By contrasting a fast Parabolic Weighted Moving Average (PWMA) with a linear Weighted Moving Average (WMA), it isolates clean velocity without the severe lag introduced by smoothing raw momentum. The resulting zero-centered metric acts as the true first derivative of price, delivering early inflection signals and robust outlier resistance.
HISTORICAL CONTEXT
Developed by Mark Jurik of Jurik Research, VEL was created to overcome the fatal mathematical flaw of standard momentum indicators: the two-bar outlier problem. Classical momentum calculations (Price - Price[N]) rely entirely on two discrete data points—today's price and the price N bars ago. A single anomalous spike creates two false signals: once when entering the window, and again when dropping out.
Traditional attempts to cure this noise by applying post-hoc moving averages introduce destructive phase lag. Jurik’s insight was to eliminate post-smoothing entirely by measuring the instantaneous divergence between two inherently smooth filters that possess different response speeds. Because every historical bar within the lookback window contributes proportionally through a continuous weighting curve, VEL naturally absorbs outlier price spikes while capturing instantaneous shifts in momentum.
HOW IT WORKS
Stage 1: Parabolic Weighted Moving Average (PWMA)
The fast component applies quadratic weighting across the lookback window: Weight = (N - i)^2. For a period of 14, the most recent bar carries 196 times the weight of the oldest bar. This quadratic profile produces an exceptionally low center-of-mass lag of ~3.15 bars, reacting immediately to price acceleration.
Stage 2: Linear Weighted Moving Average (WMA)
The slower baseline applies linear weighting across the identical lookback window: Weight = (N - i). For a period of 14, the newest bar carries 14 times the weight of the oldest bar, yielding an effective lag of ~4.33 bars. Both moving averages update via running sums to maintain strict O(1) computational efficiency per bar.
Stage 3: Velocity Differential
VEL computes the instantaneous spread between the two moving averages: VEL = PWMA - WMA. Because PWMA responds approximately 1.18 bars faster than WMA during price turns, their difference behaves as an emergent bandpass filter. It strips out the underlying low-frequency trend and suppresses high-frequency noise, isolating the intermediate momentum cycle where trend inflections occur.
INPUTS & PARAMETERS
Period: The lookback window length (N) used to calculate both the parabolic and linear weighted moving averages. Controls the passband center frequency and responsiveness. Default: 14.
HOW TO USE
Zero-Line Crossings & Trend Bias
VEL oscillates around a zero baseline, indicating the directional velocity of price:
Bullish State: VEL is positive (PWMA sits above WMA), confirming upward price velocity.
Bearish State: VEL is negative (PWMA sits below WMA), confirming downward price velocity.
Zero-Crossing Signal: A cross above zero indicates upward inflection; a cross below zero marks downward momentum breakdown.
Peak and Trough Early Warnings
Because VEL represents the first derivative of price, local peaks and troughs in the oscillator mark points of zero acceleration (inflection points). When VEL peaks and rolls over from an extreme level, it warns that trend momentum is exhausting several bars before price itself turns or crosses zero.
Histogram and Signal Line Strategies
VEL functions analogously to a MACD line. To generate early trade triggers without waiting for a full zero-line crossover, pair VEL with a short signal line (such as a 3- to 5-period EMA of VEL) or evaluate the second derivative (acceleration) via bar-over-bar slope changes.
LIMITATIONS
Unbounded Scaling: Unlike normalized oscillators like RSI or Stochastic, VEL is unbounded. Its absolute values scale directly with the underlying asset's price and volatility. A $500 stock will produce significantly wider VEL swings than a $10 stock. Normalize by ATR or price percentage (VEL / Price * 100) when comparing values across different instruments.
Constant Velocity Compaction: A reading near zero indicates that PWMA equals WMA; it does not necessarily imply market stagnation. In a steady, perfectly linear trend with constant velocity, VEL compresses toward zero despite ongoing price progress. Divergence from zero indicates active acceleration.
Warmup Period: Both internal filters require a full Period of historical bars to populate their running sums. All readings generated prior to bar index Period are uninitialized and should be disregarded.
Volatility Context: High VEL values in a low-volatility environment indicate strong momentum, whereas the same values during high volatility may simply reflect ambient noise. Contextualize extreme readings with prevailing volatility.
REFERENCES
Jurik, M. "Jurik Velocity (VEL)." Jurik Research Technical Documentation, 1990s.
Kaufman, P. J. Trading Systems and Methods. 5th ed., Wiley, 2013.
Ehlers, J. F. Rocket Science for Traders. Wiley, 2001.
HISTORICAL CONTEXT
Developed by Mark Jurik of Jurik Research, VEL was created to overcome the fatal mathematical flaw of standard momentum indicators: the two-bar outlier problem. Classical momentum calculations (Price - Price[N]) rely entirely on two discrete data points—today's price and the price N bars ago. A single anomalous spike creates two false signals: once when entering the window, and again when dropping out.
Traditional attempts to cure this noise by applying post-hoc moving averages introduce destructive phase lag. Jurik’s insight was to eliminate post-smoothing entirely by measuring the instantaneous divergence between two inherently smooth filters that possess different response speeds. Because every historical bar within the lookback window contributes proportionally through a continuous weighting curve, VEL naturally absorbs outlier price spikes while capturing instantaneous shifts in momentum.
HOW IT WORKS
Stage 1: Parabolic Weighted Moving Average (PWMA)
The fast component applies quadratic weighting across the lookback window: Weight = (N - i)^2. For a period of 14, the most recent bar carries 196 times the weight of the oldest bar. This quadratic profile produces an exceptionally low center-of-mass lag of ~3.15 bars, reacting immediately to price acceleration.
Stage 2: Linear Weighted Moving Average (WMA)
The slower baseline applies linear weighting across the identical lookback window: Weight = (N - i). For a period of 14, the newest bar carries 14 times the weight of the oldest bar, yielding an effective lag of ~4.33 bars. Both moving averages update via running sums to maintain strict O(1) computational efficiency per bar.
Stage 3: Velocity Differential
VEL computes the instantaneous spread between the two moving averages: VEL = PWMA - WMA. Because PWMA responds approximately 1.18 bars faster than WMA during price turns, their difference behaves as an emergent bandpass filter. It strips out the underlying low-frequency trend and suppresses high-frequency noise, isolating the intermediate momentum cycle where trend inflections occur.
INPUTS & PARAMETERS
Period: The lookback window length (N) used to calculate both the parabolic and linear weighted moving averages. Controls the passband center frequency and responsiveness. Default: 14.
HOW TO USE
Zero-Line Crossings & Trend Bias
VEL oscillates around a zero baseline, indicating the directional velocity of price:
Bullish State: VEL is positive (PWMA sits above WMA), confirming upward price velocity.
Bearish State: VEL is negative (PWMA sits below WMA), confirming downward price velocity.
Zero-Crossing Signal: A cross above zero indicates upward inflection; a cross below zero marks downward momentum breakdown.
Peak and Trough Early Warnings
Because VEL represents the first derivative of price, local peaks and troughs in the oscillator mark points of zero acceleration (inflection points). When VEL peaks and rolls over from an extreme level, it warns that trend momentum is exhausting several bars before price itself turns or crosses zero.
Histogram and Signal Line Strategies
VEL functions analogously to a MACD line. To generate early trade triggers without waiting for a full zero-line crossover, pair VEL with a short signal line (such as a 3- to 5-period EMA of VEL) or evaluate the second derivative (acceleration) via bar-over-bar slope changes.
LIMITATIONS
Unbounded Scaling: Unlike normalized oscillators like RSI or Stochastic, VEL is unbounded. Its absolute values scale directly with the underlying asset's price and volatility. A $500 stock will produce significantly wider VEL swings than a $10 stock. Normalize by ATR or price percentage (VEL / Price * 100) when comparing values across different instruments.
Constant Velocity Compaction: A reading near zero indicates that PWMA equals WMA; it does not necessarily imply market stagnation. In a steady, perfectly linear trend with constant velocity, VEL compresses toward zero despite ongoing price progress. Divergence from zero indicates active acceleration.
Warmup Period: Both internal filters require a full Period of historical bars to populate their running sums. All readings generated prior to bar index Period are uninitialized and should be disregarded.
Volatility Context: High VEL values in a low-volatility environment indicate strong momentum, whereas the same values during high volatility may simply reflect ambient noise. Contextualize extreme readings with prevailing volatility.
REFERENCES
Jurik, M. "Jurik Velocity (VEL)." Jurik Research Technical Documentation, 1990s.
Kaufman, P. J. Trading Systems and Methods. 5th ed., Wiley, 2013.
Ehlers, J. F. Rocket Science for Traders. Wiley, 2001.

Rigorous technical indicators for Pine Script 6 with O(1) streaming, defensible math, and proper initialization. Fully documented, implemented in C#, transcribed to Pine Script, and wrapped for Python.
Haftungsausschluss
Die Informationen und Veröffentlichungen sind nicht als Finanz-, Anlage-, Handels- oder andere Arten von Ratschlägen oder Empfehlungen gedacht, die von TradingView bereitgestellt oder gebilligt werden, und stellen diese nicht dar. Lesen Sie mehr in den Nutzungsbedingungen.
Rigorous technical indicators for Pine Script 6 with O(1) streaming, defensible math, and proper initialization. Fully documented, implemented in C#, transcribed to Pine Script, and wrapped for Python.
Haftungsausschluss
Die Informationen und Veröffentlichungen sind nicht als Finanz-, Anlage-, Handels- oder andere Arten von Ratschlägen oder Empfehlungen gedacht, die von TradingView bereitgestellt oder gebilligt werden, und stellen diese nicht dar. Lesen Sie mehr in den Nutzungsbedingungen.