Mag7 vs RSP Rotation Intensity Z-Score
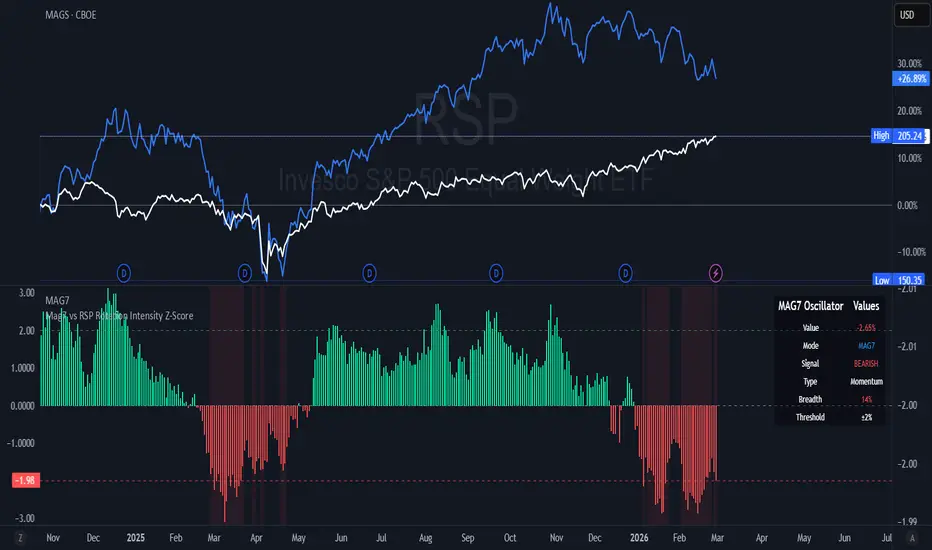
Calculates how extreme the current Mag7 underperformance is compared to the last 63 trading days (~3 months).
Formula (standard statistical Z-score): ratio = log(Mag7 price / RSP price)
mean = average of that ratio over the last 63 days
stdev = standard deviation of that ratio over the last 63 days
Z = (today’s ratio – mean) / stdev
Result plotted as colored columns (green = Mag7 outperforming, red = underperforming).
Horizontal lines at +2 and –2 mark the “extreme” zones.
Formula (standard statistical Z-score): ratio = log(Mag7 price / RSP price)
mean = average of that ratio over the last 63 days
stdev = standard deviation of that ratio over the last 63 days
Z = (today’s ratio – mean) / stdev
Result plotted as colored columns (green = Mag7 outperforming, red = underperforming).
Horizontal lines at +2 and –2 mark the “extreme” zones.

Haftungsausschluss
Die Informationen und Veröffentlichungen sind nicht als Finanz-, Anlage-, Handels- oder andere Arten von Ratschlägen oder Empfehlungen gedacht, die von TradingView bereitgestellt oder gebilligt werden, und stellen diese nicht dar. Lesen Sie mehr in den Nutzungsbedingungen.
Haftungsausschluss
Die Informationen und Veröffentlichungen sind nicht als Finanz-, Anlage-, Handels- oder andere Arten von Ratschlägen oder Empfehlungen gedacht, die von TradingView bereitgestellt oder gebilligt werden, und stellen diese nicht dar. Lesen Sie mehr in den Nutzungsbedingungen.