Smart Auto Fibonacci Retracement [JPT]
🔷 OVERVIEW
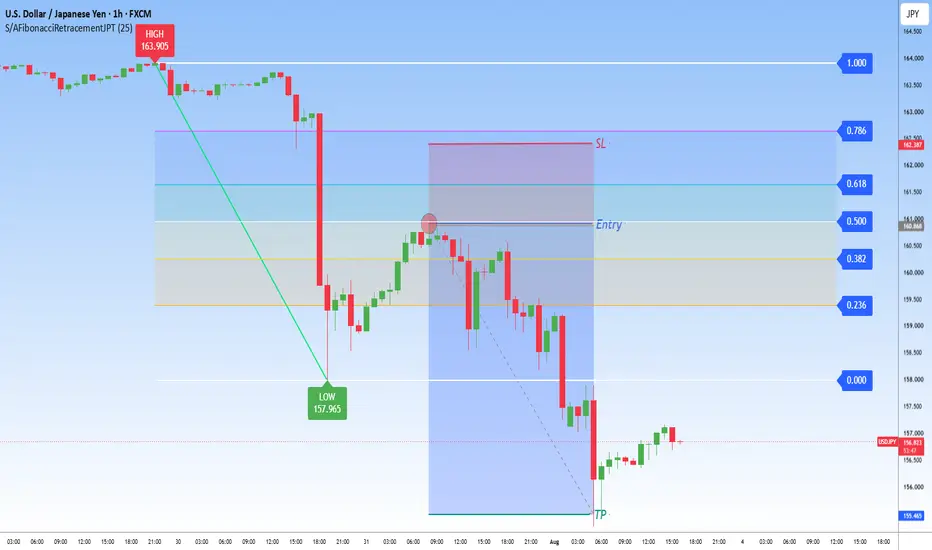
Smart Auto Fibonacci Retracement [JPT] is an original Pine Script® v6 indicator that automatically detects confirmed Swing Highs and Swing Lows, identifies the current market trend, and draws dynamic Fibonacci Retracement and Extension levels without requiring manual drawing.
The indicator creates an organized Fibonacci framework using the latest confirmed swing structure, helping traders identify potential pullback zones, continuation areas, support, resistance, and profit targets.
🔷 HOW IT WORKS
The indicator continuously scans price using confirmed pivot swings.
Bullish Trend
When a valid Swing Low is followed by a Swing High, the indicator recognizes an uptrend and automatically draws Fibonacci retracement levels from the Swing Low to the Swing High.
This allows traders to monitor potential pullback zones during bullish market conditions.
Bearish Trend
When a valid Swing High is followed by a Swing Low, the indicator recognizes a downtrend and automatically plots Fibonacci retracement levels from the Swing High to the Swing Low.
This helps identify possible resistance and continuation levels during bearish trends.
All Fibonacci levels update automatically whenever a new confirmed swing structure forms.
🔷 VISUAL FEATURES
• Automatic Swing High Detection
• Automatic Swing Low Detection
• Automatic Trend Detection
• Dynamic Trend Line
• Automatic Fibonacci Retracement Levels
• Fibonacci Extension Levels
• High & Low Swing Labels
• Right-Side Fibonacci Labels
• Colored Fibonacci Zones
• Trend Background Color
• Clean Professional Layout
• Customizable Colors
🔷 FIBONACCI LEVELS
The indicator automatically plots the following retracement levels:
• 0.000
• 0.236
• 0.382
• 0.500
• 0.618
• 0.786
• 1.000
Extension levels include:
• 1.272
• 1.618
• 2.618
These levels automatically adjust whenever a new confirmed swing is detected.
🔷 TREND ENGINE
The built-in Trend Engine automatically determines whether the market is currently bullish or bearish based on the latest confirmed swing structure.
Bullish Trend
• Fibonacci drawn from Low → High
• Green trend background
• Bullish trendline
Bearish Trend
• Fibonacci drawn from High → Low
• Red trend background
• Bearish trendline
This provides an easy-to-read visual representation of the prevailing market direction.
🔷 INPUTS
Available settings include:
• Swing Strength
• Show Trend Line
• Show Trend Background
• Show High/Low Labels
• Extend Fibonacci Lines
• Enable Individual Fibonacci Levels
• Bullish Color
• Bearish Color
🔷 ALERTS
Built-in alerts are available for:
• Buy Signal
• Sell Signal
• Price Crossing Key Fibonacci Levels
Alerts can be connected directly to TradingView's notification system.
🔷 COMMON WORKFLOW
A typical workflow is:
Wait for a confirmed Swing High and Swing Low.
Allow the indicator to identify the current market trend.
Observe the automatically generated Fibonacci retracement and extension levels.
Monitor pullbacks into key Fibonacci zones such as 0.382, 0.500, or 0.618.
Use extension levels as potential profit targets.
Combine Fibonacci levels with your own market analysis before making trading decisions.
🔷 MARKETS
This indicator can be used on:
• Forex
• Gold (XAUUSD)
• Cryptocurrency
• Stocks
• Indices
• Futures
• Commodities
Compatible with all TradingView-supported timeframes.
🔷 BEST PRACTICES
Many traders combine Fibonacci analysis with:
• Trend Analysis
• Support & Resistance
• Break of Structure (BOS)
• Change of Character (CHoCH)
• Fair Value Gaps (FVG)
• Order Blocks
• EMA 50 / EMA 200 Trend Filter
• Higher Timeframe Analysis
These techniques can provide additional confirmation when evaluating Fibonacci retracement and extension levels.
🔷 UPCOMING FEATURES
Future updates may include:
• Auto Visible Range Detection
• Multi-Swing Fibonacci Mode
• EMA 50/200 Trend Filter
• Premium & Discount Zones
• Auto Entry Price
• Stop Loss Calculation
• TP1, TP2, TP3 Auto Targets
• Risk/Reward Visualization
• Dashboard
• Advanced Alert System
🔷 DISCLAIMER
This indicator is provided as a technical analysis tool for educational and informational purposes only. It automatically identifies confirmed swing structures and calculates Fibonacci levels based on historical price action. It does not predict future market movements or guarantee trading results. Always perform your own analysis, apply sound risk management, and consider additional market factors before making trading decisions.
Smart Auto Fibonacci Retracement [JPT] is an original Pine Script® v6 indicator that automatically detects confirmed Swing Highs and Swing Lows, identifies the current market trend, and draws dynamic Fibonacci Retracement and Extension levels without requiring manual drawing.
The indicator creates an organized Fibonacci framework using the latest confirmed swing structure, helping traders identify potential pullback zones, continuation areas, support, resistance, and profit targets.
🔷 HOW IT WORKS
The indicator continuously scans price using confirmed pivot swings.
Bullish Trend
When a valid Swing Low is followed by a Swing High, the indicator recognizes an uptrend and automatically draws Fibonacci retracement levels from the Swing Low to the Swing High.
This allows traders to monitor potential pullback zones during bullish market conditions.
Bearish Trend
When a valid Swing High is followed by a Swing Low, the indicator recognizes a downtrend and automatically plots Fibonacci retracement levels from the Swing High to the Swing Low.
This helps identify possible resistance and continuation levels during bearish trends.
All Fibonacci levels update automatically whenever a new confirmed swing structure forms.
🔷 VISUAL FEATURES
• Automatic Swing High Detection
• Automatic Swing Low Detection
• Automatic Trend Detection
• Dynamic Trend Line
• Automatic Fibonacci Retracement Levels
• Fibonacci Extension Levels
• High & Low Swing Labels
• Right-Side Fibonacci Labels
• Colored Fibonacci Zones
• Trend Background Color
• Clean Professional Layout
• Customizable Colors
🔷 FIBONACCI LEVELS
The indicator automatically plots the following retracement levels:
• 0.000
• 0.236
• 0.382
• 0.500
• 0.618
• 0.786
• 1.000
Extension levels include:
• 1.272
• 1.618
• 2.618
These levels automatically adjust whenever a new confirmed swing is detected.
🔷 TREND ENGINE
The built-in Trend Engine automatically determines whether the market is currently bullish or bearish based on the latest confirmed swing structure.
Bullish Trend
• Fibonacci drawn from Low → High
• Green trend background
• Bullish trendline
Bearish Trend
• Fibonacci drawn from High → Low
• Red trend background
• Bearish trendline
This provides an easy-to-read visual representation of the prevailing market direction.
🔷 INPUTS
Available settings include:
• Swing Strength
• Show Trend Line
• Show Trend Background
• Show High/Low Labels
• Extend Fibonacci Lines
• Enable Individual Fibonacci Levels
• Bullish Color
• Bearish Color
🔷 ALERTS
Built-in alerts are available for:
• Buy Signal
• Sell Signal
• Price Crossing Key Fibonacci Levels
Alerts can be connected directly to TradingView's notification system.
🔷 COMMON WORKFLOW
A typical workflow is:
Wait for a confirmed Swing High and Swing Low.
Allow the indicator to identify the current market trend.
Observe the automatically generated Fibonacci retracement and extension levels.
Monitor pullbacks into key Fibonacci zones such as 0.382, 0.500, or 0.618.
Use extension levels as potential profit targets.
Combine Fibonacci levels with your own market analysis before making trading decisions.
🔷 MARKETS
This indicator can be used on:
• Forex
• Gold (XAUUSD)
• Cryptocurrency
• Stocks
• Indices
• Futures
• Commodities
Compatible with all TradingView-supported timeframes.
🔷 BEST PRACTICES
Many traders combine Fibonacci analysis with:
• Trend Analysis
• Support & Resistance
• Break of Structure (BOS)
• Change of Character (CHoCH)
• Fair Value Gaps (FVG)
• Order Blocks
• EMA 50 / EMA 200 Trend Filter
• Higher Timeframe Analysis
These techniques can provide additional confirmation when evaluating Fibonacci retracement and extension levels.
🔷 UPCOMING FEATURES
Future updates may include:
• Auto Visible Range Detection
• Multi-Swing Fibonacci Mode
• EMA 50/200 Trend Filter
• Premium & Discount Zones
• Auto Entry Price
• Stop Loss Calculation
• TP1, TP2, TP3 Auto Targets
• Risk/Reward Visualization
• Dashboard
• Advanced Alert System
🔷 DISCLAIMER
This indicator is provided as a technical analysis tool for educational and informational purposes only. It automatically identifies confirmed swing structures and calculates Fibonacci levels based on historical price action. It does not predict future market movements or guarantee trading results. Always perform your own analysis, apply sound risk management, and consider additional market factors before making trading decisions.

📈 FREE TELEGRAM CHANNEL
🥇 Free Daily Forex, Gold & BTC Trade Signals
📚 Daily Trading Lessons & Technical Analysis
Learn, improve, and follow the market with us — completely FREE.
📲 Join Now: t.me/JosProTrader_050
🥇 Free Daily Forex, Gold & BTC Trade Signals
📚 Daily Trading Lessons & Technical Analysis
Learn, improve, and follow the market with us — completely FREE.
📲 Join Now: t.me/JosProTrader_050
Haftungsausschluss
Die Informationen und Veröffentlichungen sind nicht als Finanz-, Anlage-, Handels- oder andere Arten von Ratschlägen oder Empfehlungen gedacht, die von TradingView bereitgestellt oder gebilligt werden, und stellen diese nicht dar. Lesen Sie mehr in den Nutzungsbedingungen.
📈 FREE TELEGRAM CHANNEL
🥇 Free Daily Forex, Gold & BTC Trade Signals
📚 Daily Trading Lessons & Technical Analysis
Learn, improve, and follow the market with us — completely FREE.
📲 Join Now: t.me/JosProTrader_050
🥇 Free Daily Forex, Gold & BTC Trade Signals
📚 Daily Trading Lessons & Technical Analysis
Learn, improve, and follow the market with us — completely FREE.
📲 Join Now: t.me/JosProTrader_050
Haftungsausschluss
Die Informationen und Veröffentlichungen sind nicht als Finanz-, Anlage-, Handels- oder andere Arten von Ratschlägen oder Empfehlungen gedacht, die von TradingView bereitgestellt oder gebilligt werden, und stellen diese nicht dar. Lesen Sie mehr in den Nutzungsbedingungen.