Aktualisiert
Macro Risk Regime
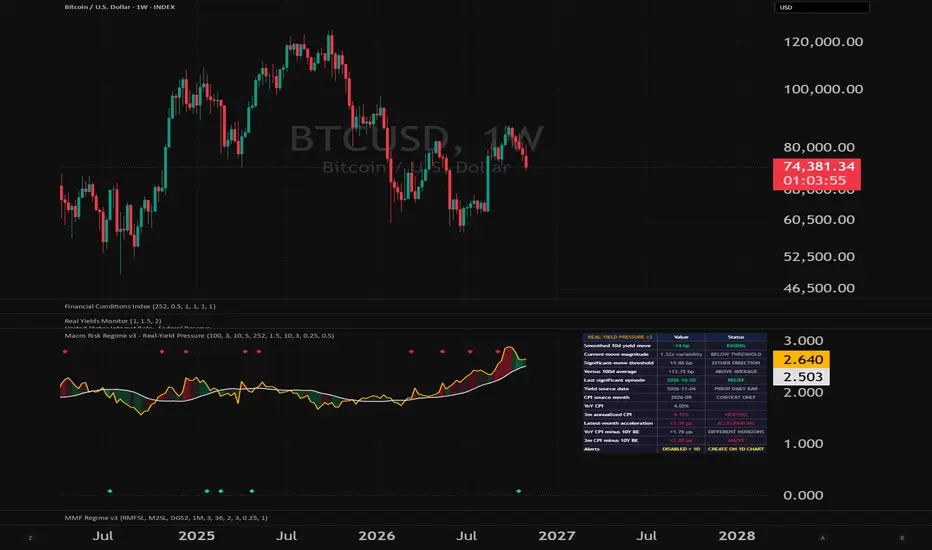
# Macro Risk Regime — Real-Yield Momentum + Inflation Pulse
## What it does
This indicator answers one question: **is the real-rate backdrop a tailwind or a headwind for risk assets right now?**
It reads the regime off the *direction* of the 10-year real yield — arguably the single most reliable macro driver of risk-asset financial conditions — and surrounds it with a realized-inflation "pulse" that tends to lead the real yield. So you can often see a turn building in inflation before the regime itself flips.
## What it plots
- **Amber line** — the 10-year real yield (FRED: DFII10, the 10Y TIPS yield).
- **White line** — its trend (a moving average over the lookback you set).
- **Shading** — green when the real yield is *below* its trend (real rates falling = easing = **RISK-ON**); red when *above* (rising = tightening = **RISK-OFF**).
The premise: falling real yields ease financial conditions and support risk; rising real yields tighten them and pressure risk. **Direction matters more than level.** This is what captured the deeply negative, falling real yields of 2020–21 (risk-on, even as inflation rose) and the sharp real-yield spike of 2022 (risk-off) — turns that an inflation-level signal alone would have missed.
## The table ("MACRO RISK")
- **Risk Regime** — the headline. The value is the real yield's gap to its trend; the status is RISK-ON (below trend, easing) or RISK-OFF (above trend, tightening).
- **YoY CPI** — trailing headline inflation, for reference. It's the input to the rows below.
- **3m Ann** — realized inflation's last-three-month annualized pace, tagged COOLING / STEADY / HEATING versus the 12-month trend. Your near-term inflation momentum.
- **Surprise\*** — the latest month's annualized pace minus the trailing 3-month pace: UPSIDE (accelerating), DOWNSIDE (decelerating), or IN LINE. See the note below on the asterisk.
- **Real−Priced** — trailing YoY CPI minus the 10-year breakeven (FRED: T10YIE): where realized inflation sits relative to what the market has priced.
- **Trend vs Priced** — realized 3-month pace minus the breakeven: whether the recent inflation run-rate is HOT or COOL versus what's priced. This is the forward-looking tactical read — realized cooling *below* what's priced is the disinflation-confirming signal that tends to pull real yields, and the regime, lower.
## How to use it
1. **Read the shading as the regime.** Green = real-rate tailwind, red = headwind. That's your macro backdrop in one glance.
2. **Use the inflation pulse as the leading tell.** Disinflation showing up first in the pulse (COOLING, DOWNSIDE surprise, COOL vs PRICED) tends to lead real yields lower and flip the regime green; accelerating inflation does the reverse. The pulse often turns before the shading does.
3. **Mind the divergences — they're the point.** When the regime is red but your asset is rising anyway, the move is running on something *other* than real-rate easing — liquidity, flows, an idiosyncratic catalyst — which is a less macro-confirmed, more fragile advance. When the regime and price agree, that's higher conviction. The divergences are the most useful information the tool gives you, not a defect.
4. **Tune the trend length.** Shorter = more responsive and more whipsaw; longer = a smoother, slower regime. The default (100 trading days, ~5 months) is a reasonable middle. The moving average is computed on daily data, so the lookback means the same thing regardless of your chart's timeframe.
Add it to whatever symbol you're analyzing and read your asset against the macro backdrop.
## Settings
- **Risk-Regime Trend Length** — lookback for the real-yield trend (default 100 trading days).
- **Realized-vs-Priced Band** — sensitivity for the HOT / COOL vs PRICED flag (default 0.25%).
- **Surprise Band** — sensitivity for the UPSIDE / DOWNSIDE flag (default 0.5% annualized).
## Methodology and honest limitations
- **It is the real-rate slice of financial conditions plus an inflation pulse — not a full multi-factor financial-conditions index.** It deliberately leaves out credit spreads, the dollar, and equity volatility. It's strongest as the rates/inflation lens; pair it with those other inputs for a complete picture rather than treating it as a standalone everything-gauge.
- **"Surprise" is a momentum proxy, not a consensus surprise.** It compares the latest print to the recent run-rate, because there is no economist-estimate feed available in Pine. So it answers "is inflation accelerating or decelerating off its recent pace," which is related to — but not the same as — "did it beat forecasts." The asterisk in the table marks this.
- **It is a trend/momentum signal, so it can whipsaw** when real yields chop sideways around their average. In those stretches, lean on your other gauges.
- **History starts in 2003.** The real yield and everything referencing breakevens (Real−Priced, Trend vs Priced) begin when TIPS/breakeven data begins; earlier bars read n/a.
## Data
All series are pulled live from FRED via `request.security`: DFII10 (10-year TIPS real yield), T10YIE (10-year breakeven inflation), and CPIAUCSL (CPI). Nothing is hard-coded or hidden — the regime and every table value are computed from these public series.
## Disclaimer
For educational and informational purposes only. This is not investment advice or a recommendation to buy or sell any asset. Markets involve risk; do your own research.
## What it does
This indicator answers one question: **is the real-rate backdrop a tailwind or a headwind for risk assets right now?**
It reads the regime off the *direction* of the 10-year real yield — arguably the single most reliable macro driver of risk-asset financial conditions — and surrounds it with a realized-inflation "pulse" that tends to lead the real yield. So you can often see a turn building in inflation before the regime itself flips.
## What it plots
- **Amber line** — the 10-year real yield (FRED: DFII10, the 10Y TIPS yield).
- **White line** — its trend (a moving average over the lookback you set).
- **Shading** — green when the real yield is *below* its trend (real rates falling = easing = **RISK-ON**); red when *above* (rising = tightening = **RISK-OFF**).
The premise: falling real yields ease financial conditions and support risk; rising real yields tighten them and pressure risk. **Direction matters more than level.** This is what captured the deeply negative, falling real yields of 2020–21 (risk-on, even as inflation rose) and the sharp real-yield spike of 2022 (risk-off) — turns that an inflation-level signal alone would have missed.
## The table ("MACRO RISK")
- **Risk Regime** — the headline. The value is the real yield's gap to its trend; the status is RISK-ON (below trend, easing) or RISK-OFF (above trend, tightening).
- **YoY CPI** — trailing headline inflation, for reference. It's the input to the rows below.
- **3m Ann** — realized inflation's last-three-month annualized pace, tagged COOLING / STEADY / HEATING versus the 12-month trend. Your near-term inflation momentum.
- **Surprise\*** — the latest month's annualized pace minus the trailing 3-month pace: UPSIDE (accelerating), DOWNSIDE (decelerating), or IN LINE. See the note below on the asterisk.
- **Real−Priced** — trailing YoY CPI minus the 10-year breakeven (FRED: T10YIE): where realized inflation sits relative to what the market has priced.
- **Trend vs Priced** — realized 3-month pace minus the breakeven: whether the recent inflation run-rate is HOT or COOL versus what's priced. This is the forward-looking tactical read — realized cooling *below* what's priced is the disinflation-confirming signal that tends to pull real yields, and the regime, lower.
## How to use it
1. **Read the shading as the regime.** Green = real-rate tailwind, red = headwind. That's your macro backdrop in one glance.
2. **Use the inflation pulse as the leading tell.** Disinflation showing up first in the pulse (COOLING, DOWNSIDE surprise, COOL vs PRICED) tends to lead real yields lower and flip the regime green; accelerating inflation does the reverse. The pulse often turns before the shading does.
3. **Mind the divergences — they're the point.** When the regime is red but your asset is rising anyway, the move is running on something *other* than real-rate easing — liquidity, flows, an idiosyncratic catalyst — which is a less macro-confirmed, more fragile advance. When the regime and price agree, that's higher conviction. The divergences are the most useful information the tool gives you, not a defect.
4. **Tune the trend length.** Shorter = more responsive and more whipsaw; longer = a smoother, slower regime. The default (100 trading days, ~5 months) is a reasonable middle. The moving average is computed on daily data, so the lookback means the same thing regardless of your chart's timeframe.
Add it to whatever symbol you're analyzing and read your asset against the macro backdrop.
## Settings
- **Risk-Regime Trend Length** — lookback for the real-yield trend (default 100 trading days).
- **Realized-vs-Priced Band** — sensitivity for the HOT / COOL vs PRICED flag (default 0.25%).
- **Surprise Band** — sensitivity for the UPSIDE / DOWNSIDE flag (default 0.5% annualized).
## Methodology and honest limitations
- **It is the real-rate slice of financial conditions plus an inflation pulse — not a full multi-factor financial-conditions index.** It deliberately leaves out credit spreads, the dollar, and equity volatility. It's strongest as the rates/inflation lens; pair it with those other inputs for a complete picture rather than treating it as a standalone everything-gauge.
- **"Surprise" is a momentum proxy, not a consensus surprise.** It compares the latest print to the recent run-rate, because there is no economist-estimate feed available in Pine. So it answers "is inflation accelerating or decelerating off its recent pace," which is related to — but not the same as — "did it beat forecasts." The asterisk in the table marks this.
- **It is a trend/momentum signal, so it can whipsaw** when real yields chop sideways around their average. In those stretches, lean on your other gauges.
- **History starts in 2003.** The real yield and everything referencing breakevens (Real−Priced, Trend vs Priced) begin when TIPS/breakeven data begins; earlier bars read n/a.
## Data
All series are pulled live from FRED via `request.security`: DFII10 (10-year TIPS real yield), T10YIE (10-year breakeven inflation), and CPIAUCSL (CPI). Nothing is hard-coded or hidden — the regime and every table value are computed from these public series.
## Disclaimer
For educational and informational purposes only. This is not investment advice or a recommendation to buy or sell any asset. Markets involve risk; do your own research.
Versionshinweise
Macro Risk Regime tracks changes in the U.S. 10-year real yield to help identify when real-rate pressure is easing, tightening, or becoming unusually strong.This updated version emphasizes the **direction and magnitude of real-yield moves**, with adaptive thresholds and markers for significant episodes. It is designed to provide macro context alongside price analysis.
**Reading the chart**
The orange line shows the 10-year inflation-protected Treasury yield, sourced from FRED’s DFII10 series. The white line shows its 100-day simple moving average by default.
The shading between the lines represents short-term real-yield pressure:
- **Green:** Easing—smoothed real yields are falling.
- **Red:** Tightening—smoothed real yields are rising.
- **Gray:** Broadly steady—the change is inside the selected threshold.
Shading is independent of whether yields are above or below their moving average. Yields can remain above their longer-term average while pressure is easing, or remain below it while pressure is tightening.
By default, the indicator smooths yields over three daily observations and measures the change over ten observations. A decline of at least five basis points qualifies as easing; an increase of at least five basis points qualifies as tightening. Smaller changes are classified as steady.
**Significant-move diamonds**
Diamonds highlight the start of a qualifying significant-move episode:
- **Green diamond:** Significant real-yield relief.
- **Red diamond:** Significant real-yield tightening.
The default threshold is the greater of:
- **10 basis points**, or
- **1.5 times the historical standard deviation** of the same smoothed, ten-observation yield changes.
The variability calculation uses the preceding 252 daily observations and excludes the current change. This allows the threshold to adapt to the prevailing environment while retaining a minimum move size. The effective threshold also cannot fall below the selected direction threshold.
“Significant” describes a move meeting these rules. It does not represent a statistical confidence level or a prediction of asset returns.
**Preventing repeated signals**
A prolonged move produces one diamond when its episode begins.
To allow another episode in the same direction, the absolute measured move must fall to half or less of the threshold recorded at the previous episode’s start and remain there for three consecutive daily observations by default.
A qualifying significant move in the opposite direction can trigger immediately.
**Understanding the table**
The dashboard separates current conditions from historical events:
- **Smoothed yield move:** The measured change and current easing, tightening, or steady classification.
- **Current move magnitude:** The move’s size relative to historical variability and whether it currently meets the significant-move threshold.
- **Significant-move threshold:** The required move size, displayed in basis points.
- **Versus the reference average:** The yield’s distance above or below its longer-term SMA.
- **Last significant episode:** The direction and source date of the most recently triggered diamond event.
The last-episode row remains unchanged until another event triggers. It can therefore show an earlier relief episode while current pressure has become steady or started tightening.
**Inflation context**
The table retains year-over-year headline CPI, three-month annualized CPI, latest-month acceleration, and comparisons with the 10-year breakeven inflation rate.
Latest-month acceleration compares the latest month’s annualized inflation pace with the trailing three-month annualized pace. It is not a surprise relative to economists’ forecasts.
CPI-versus-breakeven readings compare different time horizons and should be treated as context. Inflation fields do not control the shading, diamonds, or alerts.
**Timeframes and alerts**
All yield calculations use daily source observations, regardless of the chart timeframe. Outputs use the previous daily source bar, adding one source-bar delay. Publication delays and subsequent data revisions may also affect readings.
On weekly and monthly charts, each diamond represents at least one event of that direction within the displayed bar. Both colors can appear on the same bar. The table retains the underlying daily event date.
Create alerts on a daily or intraday chart using **Once Per Bar**. Available conditions include significant relief, significant tightening, either significant move, and more frequent easing/tightening direction changes. Alerts are disabled above the daily timeframe.
This indicator measures the real-yield component of the macro environment. It does not incorporate credit spreads, the dollar, volatility, or broader liquidity conditions, and its markers are not standalone buy or sell signals.

Haftungsausschluss
Die Informationen und Veröffentlichungen sind nicht als Finanz-, Anlage-, Handels- oder andere Arten von Ratschlägen oder Empfehlungen gedacht, die von TradingView bereitgestellt oder gebilligt werden, und stellen diese nicht dar. Lesen Sie mehr in den Nutzungsbedingungen.
Haftungsausschluss
Die Informationen und Veröffentlichungen sind nicht als Finanz-, Anlage-, Handels- oder andere Arten von Ratschlägen oder Empfehlungen gedacht, die von TradingView bereitgestellt oder gebilligt werden, und stellen diese nicht dar. Lesen Sie mehr in den Nutzungsbedingungen.