BTCUSDT 4H Breakout Retest Strategy - S/R + RSI/MACD/SMA Filter
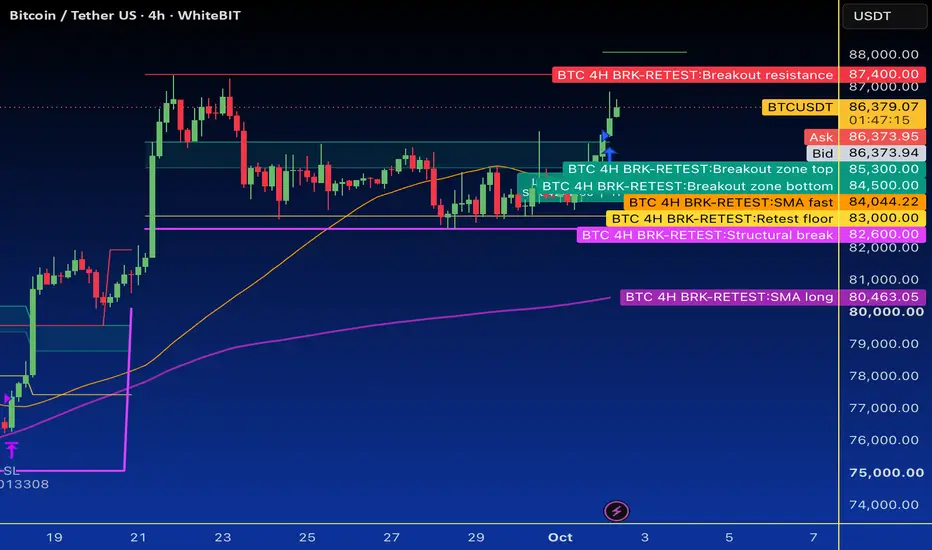
BTCUSDT · 4H. Levels based on price structure as of 2026-10-02, read from the current chart.
Key levels: breakout/retest zone 84,500–85,300 (former range top, now support). Resistance 87,300–87,400 (Sep 22–23 highs), upside objective near 88,500. Key support near 83,000, range low near 82,600, macro support near 80,000.
Indicators: RSI(14), MACD(12,26,9), SMA(50) for trend and extension, SMA(200) as regime filter.
Long setup: (a) Retest – price dips into 84,500–85,300 from above and a bullish 4H bar closes back above 85,300 with RSI 42–72 and MACD histogram positive or rising. Entry around 85.3–85.9K, SL ~1.5% below, TP ~3% above toward the 88–88.5K resistance zone. (b) Breakout – 4H close through 85,300 (range top) or 87,400 (prior highs) with RSI 55–80, MACD histogram above zero, close above SMA(50) and no more than 6% above it.
Short setup: 4H close below 82,600 with RSI 20–45, MACD histogram below zero and close below SMA(50). SL ~1.5% above, TP ~3% below toward the 80,000 area.
Regime background: red when price trades below SMA(200). Shading is visual context only; an opt-in "Require trend side of SMA long" toggle (off by default) restricts entries to the trend side.
Structural break: a 4H close below 82,600 flips the thesis from breakout continuation to breakdown.
Educational tool, not financial advice. Backtest and adjust inputs before live use.
Key levels: breakout/retest zone 84,500–85,300 (former range top, now support). Resistance 87,300–87,400 (Sep 22–23 highs), upside objective near 88,500. Key support near 83,000, range low near 82,600, macro support near 80,000.
Indicators: RSI(14), MACD(12,26,9), SMA(50) for trend and extension, SMA(200) as regime filter.
Long setup: (a) Retest – price dips into 84,500–85,300 from above and a bullish 4H bar closes back above 85,300 with RSI 42–72 and MACD histogram positive or rising. Entry around 85.3–85.9K, SL ~1.5% below, TP ~3% above toward the 88–88.5K resistance zone. (b) Breakout – 4H close through 85,300 (range top) or 87,400 (prior highs) with RSI 55–80, MACD histogram above zero, close above SMA(50) and no more than 6% above it.
Short setup: 4H close below 82,600 with RSI 20–45, MACD histogram below zero and close below SMA(50). SL ~1.5% above, TP ~3% below toward the 80,000 area.
Regime background: red when price trades below SMA(200). Shading is visual context only; an opt-in "Require trend side of SMA long" toggle (off by default) restricts entries to the trend side.
Structural break: a 4H close below 82,600 flips the thesis from breakout continuation to breakdown.
Educational tool, not financial advice. Backtest and adjust inputs before live use.

Haftungsausschluss
Die Informationen und Veröffentlichungen sind nicht als Finanz-, Anlage-, Handels- oder andere Arten von Ratschlägen oder Empfehlungen gedacht, die von TradingView bereitgestellt oder gebilligt werden, und stellen diese nicht dar. Lesen Sie mehr in den Nutzungsbedingungen.
Haftungsausschluss
Die Informationen und Veröffentlichungen sind nicht als Finanz-, Anlage-, Handels- oder andere Arten von Ratschlägen oder Empfehlungen gedacht, die von TradingView bereitgestellt oder gebilligt werden, und stellen diese nicht dar. Lesen Sie mehr in den Nutzungsbedingungen.