OPEN-SOURCE SCRIPT
SQVIGU Squeeze+ TSI Ghost
Description:
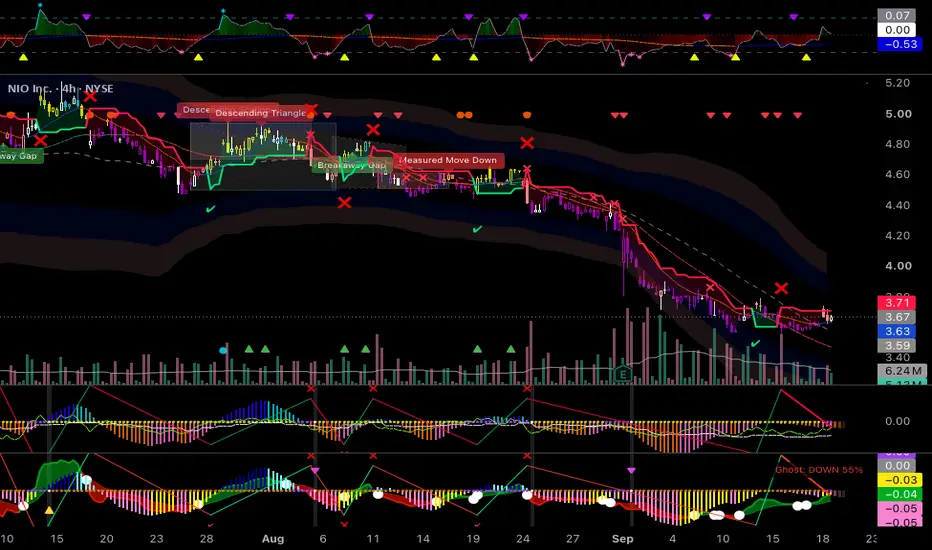
The SQVIGU Squeeze+ is an all-in-one momentum, trend, and projection indicator designed to keep your charts clean while delivering high-conviction signals. It upgrades the classic momentum squeeze by adding predictive "Ghost" projection bars, SuperTrend tracking, and a smooth, auto-scaling True Strength Index (TSI) Cloud Ribbon to confirm trend direction at a glance.
How to Use It:
The TSI Cloud Ribbon: The ribbon at the bottom of the indicator shows the broader trend. Light Blue means bullish momentum; Dark Blue means bearish. A bright White Dot appears exactly when the TSI crosses its signal line, indicating an optimal entry or momentum shift.
The Squeeze Dots (Zero Line): The dots on the zero line tell you when price is consolidating. Purple means the squeeze is building energy. White means the squeeze is firing (breakout). Yellow/Green means the squeeze is off.
Momentum Histogram & Ghost Bars: The classic red and green histogram shows current momentum. The slightly faded "Ghost" bars at the front project where momentum is heading 1 to 3 bars into the future based on linear regression.
SuperTrend Cloud & Zig-Zag: A Green (bullish) or Red (bearish) SuperTrend cloud will display on your main chart. Checkmarks (✔) indicate a confirmed trend cross, while Xs (❌) warn you of a likely false signal.
High-Probability Signals: Look for the tiny Yellow (Long) or Purple (Short) triangles on the top and bottom edges of the indicator pane. These only fire when a squeeze breakout perfectly aligns with a strong macro trend.
The SQVIGU Squeeze+ is an all-in-one momentum, trend, and projection indicator designed to keep your charts clean while delivering high-conviction signals. It upgrades the classic momentum squeeze by adding predictive "Ghost" projection bars, SuperTrend tracking, and a smooth, auto-scaling True Strength Index (TSI) Cloud Ribbon to confirm trend direction at a glance.
How to Use It:
The TSI Cloud Ribbon: The ribbon at the bottom of the indicator shows the broader trend. Light Blue means bullish momentum; Dark Blue means bearish. A bright White Dot appears exactly when the TSI crosses its signal line, indicating an optimal entry or momentum shift.
The Squeeze Dots (Zero Line): The dots on the zero line tell you when price is consolidating. Purple means the squeeze is building energy. White means the squeeze is firing (breakout). Yellow/Green means the squeeze is off.
Momentum Histogram & Ghost Bars: The classic red and green histogram shows current momentum. The slightly faded "Ghost" bars at the front project where momentum is heading 1 to 3 bars into the future based on linear regression.
SuperTrend Cloud & Zig-Zag: A Green (bullish) or Red (bearish) SuperTrend cloud will display on your main chart. Checkmarks (✔) indicate a confirmed trend cross, while Xs (❌) warn you of a likely false signal.
High-Probability Signals: Look for the tiny Yellow (Long) or Purple (Short) triangles on the top and bottom edges of the indicator pane. These only fire when a squeeze breakout perfectly aligns with a strong macro trend.
Open-source Skript
Ganz im Sinne von TradingView hat dieser Autor sein/ihr Script als Open-Source veröffentlicht. Auf diese Weise können nun auch andere Trader das Script rezensieren und die Funktionalität überprüfen. Vielen Dank an den Autor! Sie können das Script kostenlos verwenden, aber eine Wiederveröffentlichung des Codes unterliegt unseren Hausregeln.

Haftungsausschluss
Die Informationen und Veröffentlichungen sind nicht als Finanz-, Anlage-, Handels- oder andere Arten von Ratschlägen oder Empfehlungen gedacht, die von TradingView bereitgestellt oder gebilligt werden, und stellen diese nicht dar. Lesen Sie mehr in den Nutzungsbedingungen.
Open-source Skript
Ganz im Sinne von TradingView hat dieser Autor sein/ihr Script als Open-Source veröffentlicht. Auf diese Weise können nun auch andere Trader das Script rezensieren und die Funktionalität überprüfen. Vielen Dank an den Autor! Sie können das Script kostenlos verwenden, aber eine Wiederveröffentlichung des Codes unterliegt unseren Hausregeln.
Haftungsausschluss
Die Informationen und Veröffentlichungen sind nicht als Finanz-, Anlage-, Handels- oder andere Arten von Ratschlägen oder Empfehlungen gedacht, die von TradingView bereitgestellt oder gebilligt werden, und stellen diese nicht dar. Lesen Sie mehr in den Nutzungsbedingungen.