Trend-Based Fibs: Manual Anchor Logic
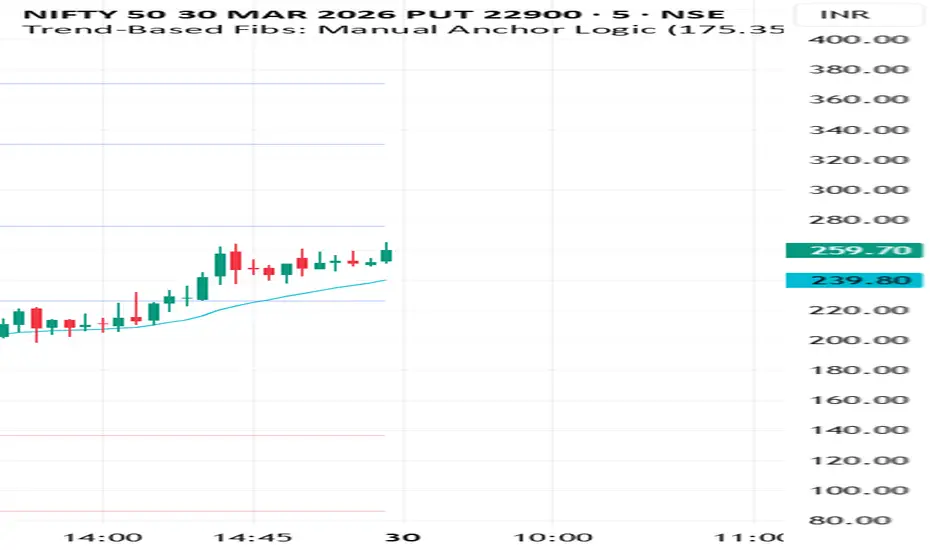
Trend-Based Fibonacci: Manual Anchor Logic
This indicator provides a streamlined way to project Fibonacci extension levels based on a user-defined price range (Anchor A and Anchor B) applied to the opening price of a new period. It is designed for traders who want to quantify "Range Expansion" relative to historical volatility.
How it Works
Unlike standard Fibonacci tools that strictly measure a single move, this script calculates the magnitude of a manual range (e.g., a previous day's high/low) and projects that specific distance from the first candle's close of the current Daily or Weekly session.
Key Features
Manual Anchor Points: Input your own key levels (Support/Resistance or Swing points) to define the base volatility.
Dual-Direction Projections: Automatically plots both Bullish (+) and Bearish (-) extensions (0.236, 0.5, 0.786, 1.0, and 1.618) simultaneously.
Dynamic Session Refresh: Levels automatically reset and recalculate at the start of every New Day or New Week.
Clean Visuals: Includes a "Hide Historical Levels" toggle to keep your charts clutter-free and focused only on the current session's price action.
Built-in EMA: A toggleable 20-period EMA to provide immediate trend context alongside your Fib levels.
How to Use
Identify your Range: Look at a previous significant move or a higher-timeframe candle and note the High/Low prices.
Input Anchors: Enter these prices into the "Anchor Point A" and "B" fields in the settings.
Execute: Use the projected levels as potential take-profit targets, reversal zones, or "measured move" objectives for the current session.
This indicator provides a streamlined way to project Fibonacci extension levels based on a user-defined price range (Anchor A and Anchor B) applied to the opening price of a new period. It is designed for traders who want to quantify "Range Expansion" relative to historical volatility.
How it Works
Unlike standard Fibonacci tools that strictly measure a single move, this script calculates the magnitude of a manual range (e.g., a previous day's high/low) and projects that specific distance from the first candle's close of the current Daily or Weekly session.
Key Features
Manual Anchor Points: Input your own key levels (Support/Resistance or Swing points) to define the base volatility.
Dual-Direction Projections: Automatically plots both Bullish (+) and Bearish (-) extensions (0.236, 0.5, 0.786, 1.0, and 1.618) simultaneously.
Dynamic Session Refresh: Levels automatically reset and recalculate at the start of every New Day or New Week.
Clean Visuals: Includes a "Hide Historical Levels" toggle to keep your charts clutter-free and focused only on the current session's price action.
Built-in EMA: A toggleable 20-period EMA to provide immediate trend context alongside your Fib levels.
How to Use
Identify your Range: Look at a previous significant move or a higher-timeframe candle and note the High/Low prices.
Input Anchors: Enter these prices into the "Anchor Point A" and "B" fields in the settings.
Execute: Use the projected levels as potential take-profit targets, reversal zones, or "measured move" objectives for the current session.

Haftungsausschluss
Die Informationen und Veröffentlichungen sind nicht als Finanz-, Anlage-, Handels- oder andere Arten von Ratschlägen oder Empfehlungen gedacht, die von TradingView bereitgestellt oder gebilligt werden, und stellen diese nicht dar. Lesen Sie mehr in den Nutzungsbedingungen.
Haftungsausschluss
Die Informationen und Veröffentlichungen sind nicht als Finanz-, Anlage-, Handels- oder andere Arten von Ratschlägen oder Empfehlungen gedacht, die von TradingView bereitgestellt oder gebilligt werden, und stellen diese nicht dar. Lesen Sie mehr in den Nutzungsbedingungen.