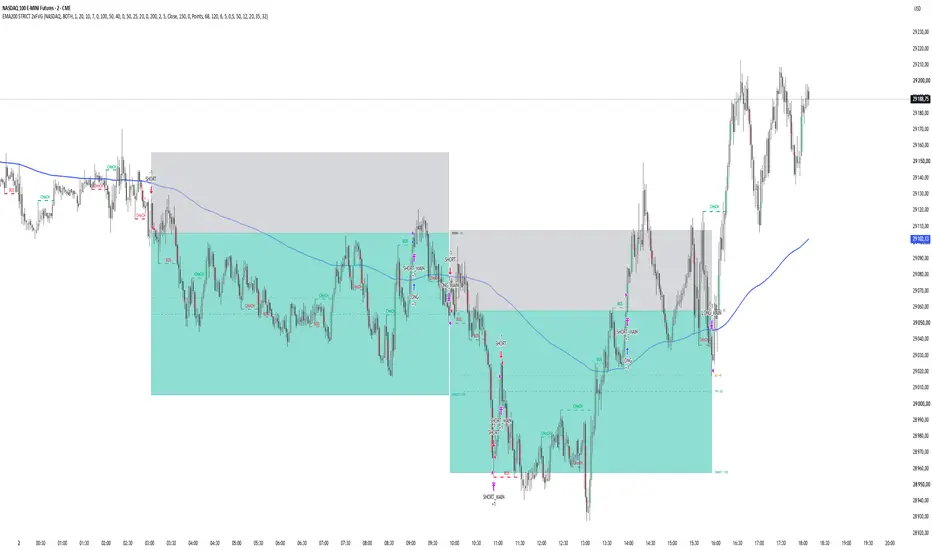
CleanTradeQuantum_v7.2_OB_FVG_INTEGRATEDCleanTradeQuantum v7.2 is an apex-tier, multi-layered algorithmic architecture engineered for uncompromising market dominance. Transcending traditional static indicators, it operates as a highly responsive state machine, harnessing a hyper-advanced quantum trend analyse engine to continuously map market probabilities and adapt to volatile liquidity regimes with zero latency.
Core Architecture & Precision Targeting
Quantum Probability Matrix: At its core, the quantum trend analyse engine parses up to 4,096 historical data vectors per tick, synthesizing multidimensional bullish and bearish momentum probabilities. This establishes a baseline of mathematical superiority before any capital is deployed.
Institutional SMC Integration: The system aggressively hunts hidden institutional liquidity by pinpointing high-fidelity Order Blocks (OB) and Fair Value Gaps (FVG). These structural zones are routed into an elite Signal Cluster—a consensus-voting nexus that cross-verifies volume profiles, multi-timeframe momentum, and structural validity before authorizing a strike.
Guided Walk Forward Optimization (WFO): To eradicate curve-fitting and ensure maximum adaptability, the framework deploys a deterministic parameter router. It fluidly shifts its internal logic across five distinct tactical profiles (Strict Prop, Balanced, Trend, Chop Defense, and Aggressive) as the chart evolves, neutralizing shifting market conditions.
Risk Mitigation & Autonom Winning
Adaptive Error Guard Circuitry: Designed for relentless autonom winning, the system features a self-healing, localized circuit breaker. If a drawdown occurs within toxic, low-probability chop zones, the engine instantly triggers a spatial, ATR-calculated lockout, shielding capital from adversarial liquidity pockets until the regime normalizes.
Dynamic OCA Scaling & Trailing: Leveraging advanced One-Cancels-All (OCA) brackets, the engine ruthlessly secures initial partial profits at TP1. Post-TP1, it initiates a hyper-responsive, ATR-calibrated trailing stop, autonomously riding explosive trend continuations while entirely eliminating downside risk.
Prop-Firm Safeguard Protocols: Hardcoded with unyielding equity tracking, the engine enforces strict institutional funding constraints. It actively monitors live drawdowns tick-by-tick, instantly locking down execution if the portfolio approaches daily or absolute maximum drawdown thresholds. Strategie

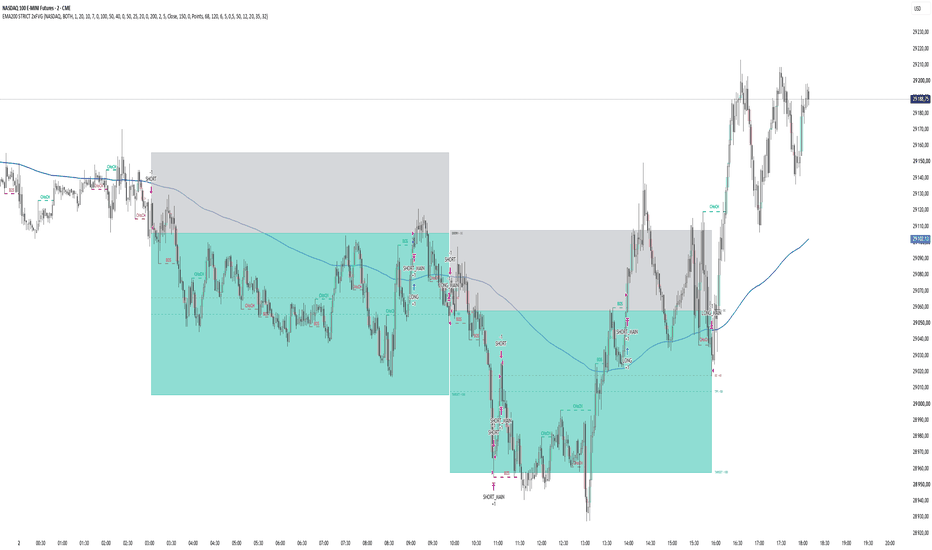
EMA200 REGIME + BOS/CHoCH + 2x FVG StrategyEMA200 Regime + BOS/CHoCH + 2x FVG Strategy
Overview
EMA200 Regime + BOS/CHoCH + 2x FVG Strategy is a rule-based TradingView strategy designed primarily for 2-minute intraday trading.
The strategy combines four core concepts:
EMA200 directional regime
Market Structure: BOS and CHoCH
Two-FVG confirmation logic
Limit entry at 50% of the body of the signal candle
The main objective is to identify continuation or reversal setups that develop while price remains on the correct side of the EMA200.
Unlike a simple EMA crossover strategy, the EMA200 is used mainly as a directional regime filter. A crossover activates either LONG or SHORT mode, but the strategy still requires market structure and Fair Value Gap confirmation before an entry can be created.
This script is a full strategy() implementation and is intended for use with TradingView's Strategy Tester.
1. EMA200 Regime Logic
The EMA200 determines the allowed trading direction.
SHORT regime
A SHORT regime begins when price crosses the EMA200 from above to below.
The regime remains active as long as price continues to close below the EMA200.
A SHORT regime is cancelled when:
Close > EMA200
A wick above the EMA200 alone does not necessarily invalidate the regime when structure confirmation is based on candle close.
During an active SHORT regime, the strategy searches for:
bearish BOS or bearish CHoCH
bearish 2x FVG
a valid signal candle
a retracement to the calculated limit-entry price
LONG regime
A LONG regime begins when price crosses the EMA200 from below to above.
The regime remains active while price closes above the EMA200.
The LONG regime is cancelled when:
Close < EMA200
During the active LONG regime, the strategy searches for:
bullish BOS or bullish CHoCH
bullish 2x FVG
a valid signal candle
a retracement to the limit-entry price
Important
The EMA regime does not expire after a fixed number of candles.
For example, if price remains below the EMA200 for 40 candles on the 2-minute chart, the SHORT regime may remain active for the entire period.
This is intentional.
The time limit applies to the relationship between the market-structure event and the 2x FVG confirmation, not to the EMA regime itself.
2. Market Structure
The strategy uses confirmed swing highs and swing lows to detect market-structure breaks.
Swing sensitivity is controlled by:
Swing Length
The default value is:
5
The script uses confirmed pivots and therefore does not require future data beyond the normal pivot-confirmation process.
3. BOS — Break of Structure
A bullish structure break occurs when price breaks above the most recent valid swing high.
A bearish structure break occurs when price breaks below the most recent valid swing low.
The user can select whether a structure break is confirmed using:
Close
Wick
The default setting is:
Close
This means that by default a wick through a swing level is not enough. The selected confirmation source must actually break the swing level.
Bullish BOS
If the current market structure is already bullish and another swing high is broken, the event is classified as:
Bullish BOS
Bearish BOS
If the current market structure is already bearish and another swing low is broken, the event is classified as:
Bearish BOS
4. CHoCH — Change of Character
CHoCH represents a break against the previously established market-structure direction.
Bullish CHoCH
If the previous structure was bearish and price breaks a valid swing high, the strategy classifies the event as:
Bullish CHoCH
Bearish CHoCH
If the previous structure was bullish and price breaks a valid swing low, the event is classified as:
Bearish CHoCH
The structure engine also handles newly confirmed pivots that may already have been broken by the time the pivot becomes confirmed.
This helps keep the strategy's BOS/CHoCH logic consistent with the structure displayed on the chart.
5. Fair Value Gap Definition
The strategy uses a classic three-candle FVG definition.
Bullish FVG
A bullish FVG exists when:
low > high
This means that the current candle's low is above the high from two candles earlier.
The gap is located between:
high and low
Bearish FVG
A bearish FVG exists when:
high < low
The gap is located between:
high and low
An optional minimum FVG-size filter can also be enabled.
The minimum size can be expressed in:
points
ticks
6. 2x FVG Logic
The strategy does not simply count every two consecutive FVG labels as a valid 2x FVG.
Instead, same-direction FVGs are grouped into clusters.
For example, several bullish FVGs that overlap each other can be treated as part of the same imbalance cluster.
A new same-direction FVG that does not overlap the existing cluster, while still occurring within the allowed number of bars, creates the second imbalance required for the:
2x FVG condition
The maximum allowed distance is controlled by:
Max bars between FVG
Default:
5
This approach is intended to prevent several overlapping gaps from being incorrectly counted as multiple independent imbalances.
7. Matching BOS/CHoCH With 2x FVG
During an active EMA regime, the strategy remembers the most recent valid structure event and 2x FVG event in the same direction.
For SHORT:
bearish BOS or bearish CHoCH
bearish 2x FVG
For LONG:
bullish BOS or bullish CHoCH
bullish 2x FVG
The two events must occur within the user-defined setup window.
Default:
Max bars: BOS/CHoCH ↔ 2x FVG = 15
On a 2-minute chart this represents a maximum separation of approximately:
30 minutes
Importantly, the two conditions do not have to occur in one fixed order.
Both sequences may qualify:
BOS/CHoCH → 2x FVG
or:
2x FVG → BOS/CHoCH
The script compares the distance between the two events.
If they are sufficiently close, the setup becomes:
SETUP READY
8. Signal Candle
Once the structure condition and 2x FVG condition have both been completed, the strategy waits for the next candle to close.
That candle becomes the:
Signal Candle
The strategy does not enter during an unfinished signal candle.
This avoids using information that would not have been known at the time.
9. Entry Price
The entry is calculated from the body of the signal candle.
The formula is:
Entry = (Open + Close) / 2
This is the midpoint of the candle body.
It is not:
(High + Low) / 2
After the signal candle closes, the strategy submits a LIMIT order at this body midpoint.
Example:
Open:
25,020
Close:
25,000
Entry:
25,010
The entry price is fixed after the signal candle closes and is not moved afterward.
10. Limit Order Validity
The market must retrace back to the calculated 50% body level.
The pending order remains valid for:
LIMIT Entry Validity Bars
Default:
5
If price does not reach the entry level during this period, the pending setup expires.
Importantly, expiration of the individual setup does not cancel the entire EMA regime.
For example:
price remains below EMA200
SHORT mode remains active
one limit entry expires
the strategy can continue searching for a new bearish BOS/CHoCH + 2x FVG setup
11. Multiple Setups Inside One EMA Regime
The strategy can detect more than one trade during the same directional EMA regime.
Example:
Price crosses below EMA200
↓
SHORT MODE
↓
Bearish BOS + bearish 2x FVG
↓
Trade #1
↓
Trade closes
↓
SHORT MODE remains active
↓
New bearish BOS/CHoCH + bearish 2x FVG
↓
Trade #2
This continues until the directional regime is invalidated.
For SHORT:
Close > EMA200
For LONG:
Close < EMA200
12. GOLD Preset
When the selected market is:
GOLD
the default values are:
Take Profit: 20 points
Stop Loss: 10 points
Break-Even Trigger: +15 points
Break-Even Offset: 0
Example SHORT:
Entry:
3800
Stop:
3810
Target:
3780
Break-even activates when price reaches:
3785
The stop is then moved to the entry price when the default BE Offset is zero.
13. NASDAQ Preset
When the selected market is:
NASDAQ
the default values are:
Take Profit: 100 points
Stop Loss: 50 points
Break-Even Trigger: +50 points
Break-Even Offset: 0
Example SHORT:
Entry:
25,000
Stop:
25,050
Target:
24,900
Break-even trigger:
24,950
These values represent actual price points, not ticks.
14. CUSTOM Market Mode
The CUSTOM preset allows manual configuration of:
Take Profit
Stop Loss
Break-Even Trigger
Break-Even Offset
This allows the strategy to be tested on other instruments or with different risk parameters.
15. Break-Even Logic
Break-even is handled automatically.
SHORT
If price reaches:
Entry - BE Trigger
the stop is moved to:
Entry + BE Offset
With:
BE Offset = 0
the stop moves exactly to the entry price.
LONG
If price reaches:
Entry + BE Trigger
the stop is moved to:
Entry - BE Offset
Once break-even has been activated, the stop is not intentionally moved back to the original stop-loss level.
16. TP1
The strategy also calculates an intermediate TP1 level.
Default:
50% of the distance between Entry and final Target
Example NASDAQ:
Main Target:
100 points
TP1:
50 points
Example GOLD:
Main Target:
20 points
TP1:
10 points
By default TP1 can be used as a visual reference.
The optional:
Enable Partial TP1
setting allows part of the position to be closed at TP1.
The percentage is controlled by:
TP1 Quantity %
17. Position Visualization
Active trades can be displayed using a risk/reward style box.
The visual structure includes:
Stop area
Entry line
TP1 line
Break-even trigger line
Main target
Trade labels
The STOP area is displayed above a SHORT entry and below a LONG entry.
The TARGET area is displayed below a SHORT entry and above a LONG entry.
The visualization is intended to resemble the logic of TradingView's Long/Short Position drawing tool.
18. Trade Direction
The strategy supports three directional modes:
SHORT ONLY
Only bearish setups are traded.
LONG ONLY
Only bullish setups are traded.
BOTH
Both bullish and bearish setups are allowed.
Default:
BOTH
19. Recommended Timeframe
The strategy is designed primarily around the:
2-minute timeframe
A visual warning can appear if another timeframe is selected.
The script is not technically locked to 2 minutes, but changing the timeframe changes the meaning of parameters expressed in bars.
For example:
15 bars
represents:
30 minutes on 2M
75 minutes on 5M
225 minutes on 15M
Users should therefore retest all parameters when changing timeframe.
20. Debug Mode
Debug Mode can be enabled to inspect the internal setup process.
It can show events such as:
SHORT MODE
LONG MODE
SETUP READY
LIMIT CREATED
The debug table can also display the current state of:
timeframe
EMA regime
BOS/CHoCH confirmation
2x FVG confirmation
setup readiness
pending limit
active position
This is particularly useful when reviewing historical setups that appear visually valid but did not produce a trade.
21. Backtesting
This script uses:
strategy()
rather than:
indicator()
and is therefore designed for TradingView's Strategy Tester.
It includes:
fixed contract quantity
configurable date range
stop loss
take profit
break-even
optional partial TP1
limit entries
Strategy Tester trade statistics
The strategy also uses:
calc_on_order_fills = true
calc_on_every_tick = true
use_bar_magnifier = true
Bar Magnifier can improve the realism of historical order execution when lower-timeframe data is available.
However, historical backtests can never perfectly reproduce live execution.
22. Futures Margin Configuration
The strategy includes:
margin_long = 10
and:
margin_short = 10
This represents a 10% simulated margin requirement in TradingView's broker emulator.
This setting is included primarily so that futures contracts with a high notional value are not automatically rejected simply because the simulated account does not contain 100% of the contract's notional value.
This is a backtesting configuration only.
It does not represent a specific broker's real margin requirement.
23. Non-Repainting Principles
The strategy is designed to avoid using future information for its trading decisions.
Important rules include:
structure breaks are evaluated only using available information
pivots are used only after confirmation
the signal candle must close before its midpoint can be calculated
the limit order is created only after the signal candle has closed
historical entry prices are not moved backward to make the backtest look better
the script does not intentionally use lookahead data
A confirmed pivot naturally requires candles to form after the actual swing point. This is standard pivot confirmation and should not be confused with repainting.
24. Entry Sequence Summary
SHORT
Price crosses below EMA200
↓
SHORT regime becomes active
↓
Bearish BOS or bearish CHoCH
↓
Bearish 2x FVG
↓
Conditions must be within allowed setup distance
↓
Next candle closes
↓
Entry = 50% of signal candle body
↓
SHORT limit order
↓
Price retraces to entry
↓
Position opened
↓
SL / BE / TP management
LONG
Price crosses above EMA200
↓
LONG regime becomes active
↓
Bullish BOS or bullish CHoCH
↓
Bullish 2x FVG
↓
Conditions must be within allowed setup distance
↓
Next candle closes
↓
Entry = 50% of signal candle body
↓
LONG limit order
↓
Price retraces to entry
↓
Position opened
↓
SL / BE / TP management
25. Main Inputs
Market Settings
Market
Trade Direction
Contracts
GOLD TP / SL / BE
NASDAQ TP / SL / BE
CUSTOM parameters
EMA Settings
Show EMA200
EMA Length
EMA Color
EMA Width
Structure Settings
Enable BOS
Enable CHoCH
Swing Length
Structure Break Confirmation
Structure labels
Structure lines
FVG Settings
Enable FVG
Show FVG
Maximum bars between FVGs
Minimum FVG filter
FVG size
FVG units
FVG colors
2x FVG markers
Setup Settings
Max bars between BOS/CHoCH and 2x FVG
Pre-cross event lookback
Entry Settings
LIMIT Entry Validity Bars
Risk Management
TP1 position
Partial TP1
TP1 quantity
Same-bar historical BE behavior
Visual Settings
Position box
Trade labels
EMA regime background
timeframe warning
26. Intended Use
This strategy is intended as a structured framework for researching a specific intraday trading model based on:
trend regime + market structure + imbalance + retracement entry
It is particularly useful for studying whether BOS/CHoCH and multiple Fair Value Gaps provide meaningful confirmation after price establishes direction relative to the EMA200.
The purpose of the script is not to predict every market move.
It is designed to convert a discretionary chart-reading process into explicit and testable rules. Strategie
Strategie

TrendLock | Multi-Timeframe Supertrend Donchian BreakoutStrategy Explanation
TrendLock combines three independent confirmations before it will ever open a trade: a primary Supertrend for local trend direction, a higher-timeframe Supertrend that must agree before entries are allowed, and a Donchian channel breakout that times the actual entry once both trend layers align. A volume-spike filter adds a final check that real participation is behind the move, not just drift.
The idea is simple: most Supertrend scripts fire on every local flip and get chopped up in ranges. TrendLock only engages when the bigger picture and the immediate price action are both pointing the same way, and only pulls the trigger on a genuine breakout — not just a trend-line touch.
Exits are ATR-based (stop and target sized off current volatility, not fixed percentages), with an optional early exit if the primary Supertrend flips against the position.
Features
Dual-timeframe Supertrend agreement filter (toggle on/off)
Donchian channel breakout entry trigger, plotted with a shaded channel
Volume-spike confirmation filter
ATR-based stop loss and take profit
Optional trend-flip exit independent of the stop/target
Long-only, short-only, or both-direction modes
Background tint shows HTF/LTF agreement at a glance
Built-in alert conditions for long and short signals
Tips
Pick an HTF meaningfully above your trading timeframe (e.g. 15m chart → 4H filter, 1H chart → 1D filter). Too close and the filter does nothing; too far and setups become rare.
Test the HTF filter on and off separately — it should reduce trade count and whipsaws, not just trade count.
Donchian lookback and ATR lengths interact: a longer Donchian window means fewer, larger breakouts, so widen your ATR stop/target multipliers accordingly.
Try disabling the volume filter on lower-liquidity assets, where volume data can be noisy or unreliable.
Backtest across several unrelated symbols and timeframes using the same input values — if it only works on one chart, the settings are likely overfit rather than a real edge.
Warnings
This is a backtesting and research tool, not financial advice — past performance in the Strategy Tester does not predict future results.
request.security calls for the HTF Supertrend can behave differently between the visible chart and actual live execution; always forward-test on a paper account before risking real capital.
Breakout strategies are prone to false starts in choppy markets even with trend filters — expect a real losing-streak tail in the backtest, not just the equity curve's best stretch.
Commission, slippage, and order-fill assumptions in the Strategy Tester are approximations; verify against your actual broker/exchange fee schedule before sizing a live position.
The HTF filter and volume filter are optional and default to specific settings — review every input before deploying, don't assume the defaults suit your instrument or timeframe.
Strategie

Ichimoku 5 Rules BacktestICHIMOKU 5/5 BACKTEST STRATEGY
This strategy is a rule-based, long-only backtesting framework designed specifically for the 1-hour timeframe.
Its purpose is to evaluate the historical behavior of a five-condition Ichimoku-based setup under predefined risk, reward, and holding-time rules.
The strategy does not attempt to predict future prices. It is designed to test whether a clearly defined technical setup produces repeatable historical outcomes across a sufficiently large sample of trades.
HOW THE STRATEGY WORKS
A potential long setup requires all five conditions to be simultaneously satisfied and confirmed.
1. CHIKOU CONFIRMATION
Current price must be above the price from 26 bars ago.
This condition is used as a historical price-structure confirmation.
2. TENKAN / KIJUN STRUCTURE
Tenkan-sen must be above Kijun-sen.
This represents bullish short-term versus medium-term Ichimoku structure.
3. MACD MOMENTUM STRUCTURE
The strategy evaluates bullish MACD and/or Signal Line divergence or convergence using confirmed price pivot lows.
The pivot comparison can identify:
- Lower Low in price with Higher Low in momentum
- Higher Low in price with Higher Low in momentum
The MACD, Signal Line, or both can be selected through the strategy inputs.
Because pivots require right-side confirmation bars, this condition only becomes available after the relevant pivot has been confirmed.
4. KUMO BREAKOUT + PULLBACK CONDITION
Price must be above the relevant Kumo reference after having traded below or inside the cloud during the selected historical lookback period.
This condition is intended to identify a transition from weaker price structure into a confirmed position above the cloud.
5. BULLISH KUMO
Senkou Span A must be above Senkou Span B.
This represents bullish future-cloud structure.
ENTRY LOGIC
A trade is generated only when a NEW confirmed 5/5 setup appears.
If all five conditions remain true for several consecutive bars, the strategy does not repeatedly generate additional entries.
Pyramiding is disabled.
The setup is confirmed using completed bars.
Because process_orders_on_close is disabled, a confirmed signal is submitted after the signal bar closes and is normally filled according to TradingView's broker-emulator execution model on the following bar.
DEFAULT CAPITAL AND POSITION SETTINGS
Initial capital:
USD 3,000
Position size:
10% of current equity
Pyramiding:
0
The strategy is intended to simulate relatively small position exposure while separating position size from the maximum intended capital risk.
RISK MANAGEMENT
Default maximum intended risk per trade:
1% of current equity
Default target:
3.5R
The initial risk amount is calculated from current strategy equity.
The stop distance is then derived from:
Initial Risk Cash / Position Size
For a long trade:
Stop Price =
Entry Price - Risk Per Share
Target Price =
Entry Price + (Risk Per Share × Reward/Risk Multiple)
The default reward/risk multiple is 3.5R but can be modified through the strategy inputs.
TRADING COSTS
The strategy uses a fixed commission of:
USD 0.10 per executed order
Under the normal one-entry / one-exit structure:
Entry commission:
USD 0.10
Exit commission:
USD 0.10
Approximate total commission for a completed trade:
USD 0.20
The commission is fixed per order and does not vary with position value.
The TRIM marker is visual only and therefore does not generate an additional order or commission.
Slippage and bid/ask spread can vary substantially by instrument, liquidity, market conditions, and order type. They should be considered when interpreting historical results. Users should apply assumptions appropriate to the instrument being tested.
MAXIMUM HOLDING TIME
Default maximum holding period:
15 trading sessions
Default 1-hour bars per session:
7
Equivalent maximum:
105 one-hour bars
If neither the stop nor the target has been reached by the maximum holding period, the position is closed using a TIME EXIT.
Both values can be modified through the strategy inputs.
TRIM REFERENCE
The strategy includes an optional TRIM marker intended to identify when price has completed a selected percentage of the theoretical Entry-to-Target distance.
Default TRIM level:
75%
The percentage is configurable.
For example, with a 3.5R target:
75% × 3.5R = 2.625R
Therefore, under the default parameters, the TRIM reference corresponds to approximately +2.625R from the entry.
IMPORTANT:
TRIM is a visual reference only.
It does NOT:
- reduce the position
- execute a partial exit
- modify the stop
- change the profit target
- affect strategy performance
- generate additional commissions
TRIM GAP HANDLING
Two different situations are considered.
NORMAL PRICE MOVEMENT
If price trades normally through the calculated TRIM level, the TRIM label is placed at the theoretical TRIM price.
GAP ABOVE TRIM
If the market opens above the calculated TRIM level, the label is placed at the opening price of that bar.
This is intended to avoid visually marking an execution at a theoretical price that was skipped by the gap.
The marker remains informational only.
BACKTEST TABLE
The strategy includes an on-chart statistical table containing:
- Closed Trades
- Wins
- Losses
- Win Rate
- Profit Factor
- Expectancy
- Net P&L
- ROI
- Maximum Drawdown
- Average Holding Period
- Target Exits
- Stop Exits
- Time Exits
- Realized R Distribution
- Mean R
- Standard Deviation of R
REALIZED R DISTRIBUTION
Each completed trade is measured relative to its initial planned risk.
Realized R is calculated as:
Trade Profit / Initial Risk Cash
For visualization, outcomes are grouped into 0.5R distribution ranges.
The distribution includes:
<= -1.0R
-0.5R
0.0R
+0.5R
+1.0R
+1.5R
+2.0R
+2.5R
+3.0R
>= +3.5R
The distribution buckets are rounded for display purposes only.
Mean R and Standard Deviation are calculated from the actual realized R values rather than from the rounded distribution buckets.
EXPECTANCY
Mean R represents the average realized R-multiple produced by the completed trades in the historical sample.
It is displayed as the strategy's historical expectancy per trade.
A positive historical expectancy does not imply that future expectancy will remain positive.
STANDARD DEVIATION
Standard Deviation measures the dispersion of individual realized R outcomes around the historical Mean R.
It is included to provide additional context regarding the variability of strategy outcomes.
The calculation does not assume that future returns will follow a normal distribution.
SAMPLE SIZE
The strategy includes a visual sample-size classification.
LOW:
Fewer than 50 completed trades
PRELIM.:
50 to 99 completed trades
VALID:
100 or more completed trades
IMPORTANT:
The term VALID refers only to the strategy's predefined minimum sample-size threshold.
It does NOT mean that the strategy has been statistically validated, that its results are reliable in every market, or that future profitability is expected.
Sample size should always be interpreted together with timeframe, instrument, market regime, expectancy, drawdown, dispersion, and other statistical characteristics.
TIMEFRAME
This strategy is designed specifically for:
1-hour charts
The script validates the chart timeframe and is not intended to be used unchanged on other timeframes.
Testing the same logic on another timeframe may produce materially different results.
CHART TYPE
The strategy is intended for use on standard price candles.
Results obtained from synthetic or non-standard chart types may not represent executable market prices and should not be interpreted in the same way as results obtained from standard OHLC market data.
ORIGINAL PURPOSE OF THE SCRIPT
This script is not intended to reproduce a standard Ichimoku indicator.
Its purpose is to combine a specific five-condition decision framework with:
- confirmed Ichimoku structure
- pivot-based MACD momentum analysis
- explicit equity-based risk modeling
- fixed reward/risk targeting
- maximum holding-time rules
- gap-aware TRIM visualization
- realized R distribution
- expectancy analysis
- outcome dispersion
- exit-type classification
- sample-size monitoring
The strategy is primarily a research and backtesting tool for studying the historical behavior of this specific rules-based setup.
BACKTEST LIMITATIONS
Historical results are simulations and do not represent actual trading performance.
Real-world results can differ due to factors including:
- slippage
- bid/ask spread
- commissions
- liquidity
- market impact
- order type
- order priority
- partial fills
- trading halts
- gaps
- broker execution
- exchange rules
- data quality
- corporate actions
- symbol history
- market regime changes
Historical OHLC bars also do not always reveal the exact sequence in which prices moved inside each bar.
When multiple relevant price levels occur within the same historical bar, TradingView's broker emulator determines fills according to the information and execution assumptions available to the strategy.
For this reason, individual historical fills should not be interpreted as a reconstruction of actual tick-by-tick execution.
REPAINTING AND CONFIRMATION
Trade setups are based on confirmed bars.
The momentum component uses confirmed pivots. Because pivot detection requires bars to the right of the pivot, a pivot is recognized only after its confirmation period has elapsed.
This confirmation delay is part of the strategy logic and should be considered when interpreting signals.
INTERPRETING RESULTS
Historical performance should not be evaluated from a single symbol, isolated market period, or individual trade.
A more robust evaluation should consider:
- a sufficiently large trade sample
- different symbols
- different market environments
- trending and non-trending periods
- drawdown
- realized R distribution
- expectancy
- outcome dispersion
- transaction costs
- execution assumptions
Changing parameters can materially alter historical results and may introduce overfitting.
Parameters should therefore be selected based on a defined trading hypothesis rather than solely because they improve historical performance.
DISCLAIMER
This strategy is provided for educational, analytical, and research purposes only.
It is not financial advice.
It does not constitute an offer, solicitation, recommendation, or instruction to buy or sell any financial instrument.
Historical performance does not guarantee future results.
All trading and investment decisions, including position sizing and risk management, remain the sole responsibility of the user.
Strategie

RSI Bullish Divergence (Oversold) BreakoutRSI BullDiv BO (Bullish Divergence Breakout)
This indicator identifies bullish RSI divergences and filters them using breakout confirmation to reduce false signals.
A bullish divergence occurs when price forms a lower low while RSI forms a higher low, indicating weakening bearish momentum. Instead of signaling immediately on divergence detection, the indicator waits for a breakout above the intervening swing high, helping confirm a potential trend reversal.
Features
Detects bullish RSI divergences automatically
Uses RSI momentum exhaustion principles
Breakout-based confirmation to improve signal quality
Configurable RSI length, oversold level, and pivot settings
Suitable for stocks, indices, futures, and cryptocurrencies
Signal Logic
Price forms a lower low.
RSI forms a higher low.
A bullish divergence is detected.
Buy signal is generated only after price breaks above the confirmation level.
Note Divergence indicates weakening downside momentum, not an immediate reversal. Signals are most effective when combined with trend analysis, support zones, volume confirmation, and risk management. Strategie

Patterns Strategy v1### 1. What the strategy does
This is a **price-action pattern strategy** that detects four patterns:
* **Bullish Engulfing** → long setup
* **Bearish Engulfing** → short setup
* **Morning Star** → long setup
* **Evening Star** → short setup
The strategy then creates an entry trigger, stop loss, and profit targets for the detected pattern.
---
### 2. Bullish Engulfing
For a bullish engulfing setup, the script looks for:
* Previous candle is bearish.
* Current candle is bullish.
* Current candle's body is large enough according to the minimum-body setting.
* The current candle completely engulfs the previous candle's body when strict engulfing is enabled.
* The current close can also be required to finish beyond the previous candle's open.
Once detected:
**Entry:** above the engulfing candle's high
**SL:** below the engulfing candle's low, with optional use of both candles
**Target:** normally 1.5R for TP1 and 2R for the final target.
---
### 3. Bearish Engulfing
The opposite structure is used:
* Previous candle is bullish.
* Current candle is bearish.
* Current candle has sufficient body strength.
* Current candle engulfs the previous candle's body.
* The close can be required to finish below the previous candle's open.
**Entry:** below the engulfing candle's low
**SL:** above the engulfing candle's high
**Target:** 1.5R and 2R by default.
---
### 4. Morning Star
The strategy uses a **three-candle pattern**:
1. Strong bearish first candle.
2. Small-body middle candle.
3. Strong bullish third candle.
4. Third candle must recover at least the configured penetration percentage of the first candle's body.
The default settings require:
* Middle candle body ≤ 35% of its range.
* Outer candles body ≥ 55%.
* Third candle penetration = 50%.
**Entry:** above the third candle's high
**SL:** below the entire three-candle pattern
**Target:** 1.5R / 2R.
---
### 5. Evening Star
This is the reverse of the Morning Star:
1. Strong bullish first candle.
2. Small middle candle.
3. Strong bearish third candle.
4. Third candle penetrates sufficiently into the first candle.
**Entry:** below the third candle's low
**SL:** above the entire pattern
**Target:** 1.5R / 2R.
---
## 6. Entry mechanism
There are **two entry modes**.
### Stop Order
The strategy places a resting order at the breakout level.
For example:
**Bullish pattern → price must break the trigger above the pattern.**
### Market on Break
The strategy waits until price actually breaks the trigger and then enters on the next bar.
So the two modes behave differently in backtesting.
There is also an **entry buffer**, meaning the trigger can be placed a few ticks beyond the pattern high/low.
---
## 7. Pending setup expiration
After a pattern appears, the setup does **not remain active forever**.
Default:
**5 bars**
If price doesn't trigger the entry within those bars, the pending setup is cancelled.
There is also an option to cancel the setup if the stop-loss level breaks before the entry occurs.
---
## 8. Stop-loss protection
The strategy has a minimum stop-distance rule.
If the calculated SL is too close to the entry, it automatically pushes the SL farther away to satisfy the minimum number of ticks.
This prevents extremely small stop distances.
---
## 9. Profit management
The default structure is:
**Entry → 1.5R TP1 → 2R final TP**
At TP1:
* 50% of the position is closed by default.
* The remaining position continues toward TP2.
* Stop loss can automatically move toward break-even.
The break-even adjustment has its own tick offset.
So conceptually:
**Risk = 1R**
If your entry-to-SL distance is 20 points:
* TP1 = +30 points
* TP2 = +40 points
with the default 1.5R / 2R settings.
---
## 10. Daily trading restrictions
The script has several controls:
* Maximum trades per day
* Maximum number of losses per day
* Only the first pattern of the day
* Long trades on/off
* Short trades on/off
* Trading session restriction
* Close trade at session end
* EMA trend filter
The default maximum trades per day is **1**.
This is important because even if several patterns appear, the strategy can prevent additional trades once the daily limit has been reached.
---
## 11. EMA trend filter
The strategy can optionally use an EMA as a directional filter.
Default EMA:
**200 EMA**
When enabled:
* Long setups require price above the EMA.
* Short setups require price below the EMA.
When disabled, the EMA does not filter the trades.
---
## 12. Position sizing
There are two approaches.
### Fixed lots
The strategy trades a fixed number of lots.
Default:
**1 lot × 65 units = 65 units**
### Risk-based sizing
You can instead specify how much of your equity you want to risk per trade.
The position size is then calculated from:
**Account equity + risk percentage + distance to SL + lot size**
It rounds the quantity to whole lots.
---
## 13. White candle feature
This is one of the important visual features of your script.
When a valid pattern is detected, the pattern candle can be painted **white**.
For two-candle patterns:
**Both candles can be highlighted.**
For three-candle patterns:
**All three candles can be highlighted.**
You can independently control this feature from the Visuals settings.
---
## 14. Chart markings
The script can display:
* Bullish triangle
* Bearish triangle
* Pattern name
* Entry/trigger level
* Entry price
* Stop loss
* TP1
* TP2
* EMA when trend filtering is enabled
The levels make it possible to visually follow the entire trade from setup → entry → SL/TP.
---
## 15. Dashboard
The top-right dashboard shows the current strategy state.
It can tell you:
* **LONG**
* **SHORT**
* **Pending Long**
* **Pending Short**
* **Flat**
It also displays:
* Trades today
* Losses today
* Last pattern
* Current 1R risk
* Net profit
When DEBUG is enabled, it additionally shows:
* Signals detected
* Orders placed
* Fills
* Expired setups
* Invalidated setups
* Blocked setups
* Last reason a setup was skipped.
---
## 16. Alerts
The script has alerts for each individual pattern:
* Bullish Engulfing
* Bearish Engulfing
* Morning Star
* Evening Star
It also has general long/short setup alerts.
The alert message can include the pattern, trigger price and SL.
---
### Overall flow
The strategy essentially works like this:
**Find pattern → check filters → calculate trigger → calculate SL → create pending setup → wait for breakout → enter → manage TP1 → move SL toward BE → target TP2 or SL → enforce daily limits.**
So this is **not simply a candle-pattern indicator**. It is a complete **backtesting/trading strategy with order management, risk sizing, daily limits, visual signals, dashboard and alerts**.
Strategie

QuantumForexTrader_SniperFusion_Strategy_v2What is the QuantumForexTrader (SniperFusion v2)?
This is an advanced, automated trading strategy written for TradingView (using Pine Script v6). It is currently calibrated specifically for ZCash (ZEC) on the 5-minute chart, but its flexible architecture allows it to run on any trading pair or timeframe.
Instead of relying on simple moving average crossovers, it acts like a digital sniper—waiting for multiple layers of market confirmation before executing a trade.
Key Features Broken Down
🧠 Quantum Core (Market Memory):
It looks back across thousands of historical bars to calculate a weighted "memory" score of recent price momentum. It determines whether bulls or bears currently dominate the market structure.
🎯 Sniper Fusion & Multi-Indicator Filters:
A trade is only triggered when a strict checklist is met. It checks the VWAP, Relative Strength Index (RSI), MACD, EMA trends, ADX (trend strength), and volume spikes simultaneously. It also cross-references a 5-minute higher-timeframe filter to ensure you are trading with the overarching trend.
🛡️ Advanced Risk Management:
Dynamic Stop-Loss: Automatically calculates risk based on market volatility (ATR).
5-Tier Take-Profits: Instead of closing the whole trade at once, it takes profits off the table in 20% chunks across five consecutive target levels.
Trailing Stop-Loss: Once the trade moves into profit by a certain amount, a trailing stop locks in gains and follows the price.
⚡ Automated Execution Ready:
It is built with webhook capabilities (compatible with platforms like Pionex). A single alert template in TradingView sends fully formatted JSON buy, sell, and close signals directly to your bot.
📊 Live On-Chart Dashboard:
It draws a clean HUD table directly on your chart, showing real-time metrics like Bull/Score percentages, market bias (STRONG BULL, MILD BEAR, etc.), active positions, net PnL, and win rate.
🔒 Zero-Repaint Protection:
All higher-timeframe and indicator calculations strictly look at confirmed completed bars ( offset), preventing false backtest results that vanish in live trading.
Strategie

XGBoost Mini Strategy [The Quant Science]This strategy implements a predictive XGBoost machine learning system using our proprietary XGBoostMini library. It's a simple test to demonstrate how to use the library within a strategic framework. Notably, with just a few lines of Pine Script, it was possible to develop an algorithm that learns in real time from recent historical data to decide when to enter the market.
👉 XGBoostMini:
🔷 Key Features Extraction
Before making decisions, the system calculates six normalized features metrics to describe the current market state:
14-period RSI on a scale from zero to one
Percentage distance between the price and the 50-period Exponential Moving Average (EMA)
5-period Rate of Change (ROC)
Normalized ATR relative to the price to estimate volatility
Volume variation compared to its 20-period moving average
Current price position relative to the highs and lows of the last 14 bars
🔷 Dynamic Model Training
Starting from bar 300 onwards, every 50 bars the code collects a historical sample consisting of 50 past observations. For each observation, the system checks whether the price increased or decreased two bars later, generating a binary target variable. Based on this recent data, a mini decision tree is trained using the XGBoost model.
🔷 Real-Time Prediction
On every bar following the training, the model analyzes the 6 current indicators and calculates a numerical probability between 0 and 1, representing the estimated likelihood of a future bullish market movement.
🔷 Order and Risk Management
A Long position entry is triggered if the model's estimated probability exceeds the configured reference threshold, set by default to 51%. The position is closed as soon as the probability falls below the opposite threshold. Finally, for capital protection, a safety exit system based on a percentage-based dynamic trailing stop is activated.
🔷 Key Stats & Profitability
Total PnL: +2,010 USDT (+20.10%). A positive return, though it must be evaluated relative to the time horizon visible in the charts (2018 to 2026).
Profit Factor: 1.36. This is a solid value above 1, indicating that gross profits exceed gross losses.
Profitable Trades Percentage: Approximately 54.88%. Over half of the operations close in profit, a robust percentage for a medium-to-high frequency algorithmic trading system.
🔷 Risk Management and Drawdown
Max Drawdown: 361.87 USDT, equal to 3.34%.
This is an exceptionally positive metric. A drawdown of less than 3.50% over such an extensive historical dataset demonstrates outstanding capital protection and very tight risk management driven by the dynamic trailing stop.
🔷 Trades Analysis & Distribution
Expectancy: +0.20% per trade.
This means that, on average, each operation has a positive expected return of 0.20%.
🔷 Risk/Reward Ratio:
Average loss: -0.78%.
Average profit: +1.21%.
Positive Note: The average profit exceeds the average loss, which helps keep the strategy profitable even with a win rate of around 55%.
🔷 Outliers and Extremes
Largest loss: 94.60 USDT.
Largest profit: 169.25 USDT.
It's worth noting that the maximum single loss exceeds the maximum single profit, which means that the strategy's profitability does not rely on isolated "lucky shots," but rather on the consistency of many small profits.
🔷 Equity Curve Analysis
Cumulative PnL Curve: Observing the cumulative PnL chart, a steady and gradual growth phase is visible, especially from 2020 onwards, accompanied by strong stability during sideways or bear market phases (such as in 2022).
Commission Load: The commission load is very low at 0.08%, indicating that transaction costs have a minimal impact on the final result.
🔷 Overall Assessment
The strategy demonstrates solid quantitative metrics: a low drawdown, a good profit factor and a favorable risk/reward ratio. However, as this strategy was developed to test the features of the XGBoost library, it should be considered exclusively for research purposes. Do not treat this strategy as ready for live deployment, but rather as a starting point for your experiments. Strategie

STP Flip "Anti-Whipsaw" Modified "Always-In" Overnight Strategy Synapse Trail Pro "Anti-Whipsaw" (Optimized for MNQ overnight on 9 min Candles)
### Overnight MNQ Always-In Flip Strategy | Optimized for 9-Minute Candles
**Synapse Trail Pro PRO** is a modified, session-aware, always-in-the-market trend-flipping strategy designed specifically for **Micro E-mini Nasdaq (MNQ) futures during the overnight trading session**, beginning around **18:00**, and optimized for the **9-minute chart**.
Rather than functioning as a conventional strategy that waits for a setup, enters a trade, takes a fixed profit, and returns to flat, this system is built around a modified **always-in directional framework**. It maintains either a long or short bias and automatically reverses direction when its underlying trend signal changes. When the market shifts from bullish to bearish, the strategy flips short; when it shifts back bullish, it flips long.
The objective is straightforward:
> **Remain engaged with the overnight market so that if MNQ makes a meaningful directional move at any point during the night, the strategy has the opportunity to capture that move and reach its nightly profit target.**
It is not designed around trying to predict the exact time of the overnight breakout, trend, or reversal. Instead, it is designed to continuously adapt to the market's direction and allow the eventual meaningful move to pay for the smaller fluctuations and reversals that may occur beforehand.
---
## Designed Specifically for Overnight MNQ
This version is optimized around the characteristics of the **overnight MNQ session**, rather than the regular cash-session environment.
The intended operating window begins around **18:00 Eastern**, allowing the strategy to participate throughout the overnight period rather than limiting itself to a narrow entry window. The 9-minute chart is used to help filter some of the excessive noise found on lower timeframes while still allowing the system to respond when a meaningful overnight trend develops.
Overnight markets can spend extended periods moving sideways, rotating, or producing several false directional changes before eventually making a substantial move. This strategy is designed to tolerate that process while remaining positioned to participate when the market finally establishes a sustained direction.
The core philosophy is:
**The market does not have to trend immediately. It only needs to produce a meaningful move sometime during the trading night.**
---
## Modified Always-In Flip Architecture
At its core, Synapse Trail Pro PRO is a **continuous directional repositioning system**.
Instead of repeatedly going:
**Flat → Long → Flat → Short → Flat**
the strategy operates more like:
**Long → Short → Long → Short → Long**
with the system remaining engaged until a defined session condition or profit objective ends the trading cycle.
The primary exit mechanism is therefore not a traditional stop-loss exit. Instead, trades are generally closed or reversed because the underlying signal changes direction. This allows the strategy to remain involved in the market rather than sitting flat after every individual trade.
The system is intended to capture the larger directional movement that may emerge after a series of smaller flips, rather than requiring every individual entry to be immediately profitable.
---
## The Overnight Profit Objective
The strategy is designed around a **nightly profit target rather than an unlimited daily trading objective**.
The intended target is approximately:
**+$250 to +$350 per overnight session**
when trading a base position of **1 MNQ**, depending on the configuration and market conditions.
Once the strategy reaches its nightly profit target, it stops trading for that session. This creates a defined objective and prevents the system from continuing to expose already-earned profits to unnecessary additional overnight fluctuations.
The profit target is not intended to be reached through one specific entry at one specific time. Instead, it is designed to be reached through the cumulative effect of the strategy remaining engaged, flipping with the market, and capturing the meaningful directional movement that develops during the night.
---
## Progressive Contract Scaling
This version also incorporates configurable progressive position sizing.
The strategy can increase exposure as the sequence develops, for example:
**1 → 2 → 3 → 4 MNQ**
depending on the selected maximum-contract setting.
This is intended to help the strategy recover from smaller unfavorable sequences and increase its ability to reach the nightly profit target when a sustained directional move develops.
The maximum contract setting is configurable, allowing the trader to determine the desired balance between:
* Profit-target hit rate
* Overnight drawdown
* Exposure during adverse sequences
* Recovery potential
* Overall account risk
For example, in testing, a configuration using a **maximum of 2 MNQ contracts** with a **+$250 profit target** has historically produced a profit-target hit rate of approximately **83% of overnight sessions** in the tested dataset.
That figure should be treated as a backtested observation rather than a guarantee of future performance.
---
## Why the Always-In Concept Matters Overnight
The overnight session is particularly suited to this type of architecture because meaningful moves can occur at unpredictable times.
A market may:
* Move sideways for several hours
* Produce multiple small reversals
* Develop a trend at 21:00
* Reverse again at midnight
* Break into a substantial move at 02:00
* Continue trending toward the morning session
A strategy that only takes one or two carefully timed entries may completely miss the night's most important move.
Synapse Trail Pro PRO is designed differently. It attempts to remain involved throughout the session so that **the timing of the meaningful move matters less than simply being present when it occurs**.
The system does not need to know whether the profitable move will happen at 19:00, 23:30, 02:15, or 04:30. Its purpose is to continue adapting until the market provides the directional opportunity necessary to reach the session objective.
---
## What Makes This Different from the Original Synapse Trail Pro
This version is based on **WillyAlgoTrader's Synapse Trail Pro**, which provides the underlying signal and trend-flipping foundation.
However, this is a significantly modified version of the original concept.
The modifications include:
* Removal of the original **TP1, TP2, and TP3 profit-taking structure**
* Removal of the original traditional stop-loss architecture
* Greater emphasis on **always-in directional flipping**
* Overnight session optimization
* 9-minute MNQ chart optimization
* Configurable progressive contract scaling
* A defined nightly profit target
* Session-based trading controls
* A focus on allowing meaningful overnight moves to complete the profit objective
The intention is to move away from a conventional multi-target trailing strategy and toward a more specialized **overnight directional capture system**.
---
## The Core Trading Philosophy
Synapse Trail Pro PRO is built around a simple premise:
> **You do not need to predict the overnight move if your strategy is designed to remain engaged long enough to capture it.**
The system is not trying to win every flip.
It is not trying to make every individual trade profitable.
It is not trying to identify the exact high or low of the night.
Instead, it is designed to:
1. Begin trading around 18:00.
2. Maintain a directional position.
3. Flip when the underlying trend changes.
4. Progressively scale contracts within configured limits.
5. Remain engaged through overnight fluctuations.
6. Capture a meaningful directional move whenever one develops.
7. Reach the nightly profit target.
8. Stop trading once the target is achieved.
The desired result is a strategy that may experience several smaller unfavorable reversals but is positioned to capitalize when MNQ finally makes the substantial move that defines the night's trading opportunity.
---
## Summary
**Synapse Trail Pro PRO** is a modified **always-in, trend-flipping overnight strategy for MNQ**, optimized for the **9-minute chart** and designed to operate beginning around **18:00**.
Its primary purpose is not to predict the market's next move, but to remain continuously adaptable so that **whenever a meaningful directional move occurs during the night, the strategy has the opportunity to capture it and reach its predefined profit target**.
With configurable progressive contract scaling, a nightly target in the approximate **$250–$350 range**, and a focus on capturing the overnight session's eventual directional movement, the system is designed as a specialized approach to extracting a defined profit objective from the often unpredictable overnight MNQ environment.
**Based on WillyAlgoTrader's Synapse Trail Pro, modified and optimized for overnight MNQ trading by removing the original multi-target and stop-loss architecture and emphasizing continuous directional flipping and configurable position scaling.**
Strategie

ICone buy and sell with smc# ICone v2.6 — Complete Trading System (Investment Circle)
ICone turns your chart into a full decision-making system: quality-filtered signals, automatic risk/reward visualization, smart money concepts, volume analysis and macro context — all in one tool, designed so that even beginners instantly understand what to do.
**🎯 One clear instruction — never guess again**
The engine trades three setup types: trend continuations (pullback-to-MA20 with momentum, volume and multi-timeframe confirmation), breakout-retest patterns from compression, and liquidity sweeps (confirmed false breakouts traded as reversals). Every setup is scored 0–100 and gated by the daily trend. The chart stays clean — you only see **ENTRY LONG / ENTRY SHORT** where a position is actually taken. When flat, a **WATCHING label** tells you exactly what the engine is waiting for.
**🟥🟩 Risk/Reward painted on the chart**
The moment a trade opens, the entire plan is drawn automatically: a **red zone** from entry to stop-loss (your risk) and **green stepped zones** up through TP1–TP4 (your reward) — like TradingView's position tool, but automatic on every signal. Lines carry R-multiples (−1R, +1R… +4.5R) and sell percentages ("TP1 – SELL 25%"). The stop moves to break-even after TP1 and trails after TP2. An optional **ADD-ON level** at −0.5R marks where to scale in. All graphics are cleaned up when the trade closes. Colors and opacity are fully customizable.
**💳 Trade Card in real money**
A compact card shows the trade in currency, not just percent: stake, risk to SL, potential at TP4, risk/reward ratio and live P/L — updating in real time. A gold **NEXT TARGET flag** points at the current objective and counts down the distance.
**🧭 Live Position Guide**
While in a trade, the guide reads the chart and escalates plain-language advice — *"Sell 25% now" → "Sell 75%" → "Close everything"* — with the reason (momentum fading, false breakout against you, macro turning). It patiently waits until TP1 is reached before advising exits, letting winners breathe.
**🌍 Gold Macro Score (−100 to +100)**
Fourteen weighted drivers — real yields, DXY, Fed liquidity, ETF flows, miners, silver, credit, VIX — compressed into one verdict from STRONG BULL to STRONG BEAR, vetoing trades that fight the macro tide.
**📊 Full smart-money context**
Market structure (HH/HL, BOS/CHoCH), buy/sell zones (order blocks), iFVG, PDH/PDL/PWH/PWL, session highs/lows, liquidity pools, yesterday's POC and a side volume profile with the highest-volume node highlighted.
**🖥️ Beginner-friendly dashboard**
A wide panel that opens with the answer everyone wants: **"WHAT TO DO RIGHT NOW"** — followed by market regime, signal strength, all timeframes in %, the macro score and a multi-asset overview. Every row explains itself on hover.
**⚙️ One-click profiles & alerts:** "Gold optimized" and "Index optimized" apply the full tested configuration instantly. A single alert covers entries, take-profits, warnings and advisor actions.
*Past performance never guarantees future results. Always forward-test on your own instrument and timeframe before trading live. Not financial advice.*
Strategie

SuperTrend Regime Confluence📊 SUPERTREND REGIME CONFLUENCE
A trend-following strategy combining a volatility-adaptive SuperTrend with a
market-regime classifier and a five-factor confluence filter.
The three components aren't stacked arbitrarily. Each one fixes a specific,
well-known weakness of the others, which is why they're combined into a single
tool rather than used separately.
🧩 WHY THESE COMPONENTS ARE COMBINED
A standard SuperTrend has two weaknesses:
- Fixed ATR multiplier: too tight in volatile markets (premature flips), too
wide in quiet trends.
- It flips on every crossover regardless of conditions, causing whipsaws in
sideways markets.
This strategy addresses both:
1️⃣ Regime detection adapts the band.
An ADX plus ATR-ratio classifier labels each bar Trending, Volatile, or Ranging.
In Volatile conditions the multiplier widens (fewer false flips during
expansion); in Ranging conditions it tightens. The band reacts to conditions
instead of using one fixed setting.
2️⃣ The regime filter removes the worst environment.
Entries during the Ranging regime (where trend-following bleeds) can be skipped
entirely.
3️⃣ The confluence score gates each flip.
Rather than trading every SuperTrend flip, each candidate entry is scored 0 to
100. Only flips clearing a minimum score are taken.
Together: the classifier makes the band adaptive, the regime filter removes the
setting where the signal fails, and the score removes the weakest signals. Each
piece compensates for a limitation of the SuperTrend it's built on.
🧮 THE CONFLUENCE SCORE (rules-based, not machine learning)
A plain weighted sum of five factors, each contributing fixed points. It is
fully deterministic and documented in the code. No model, no training, no black
box:
- Volume surge (0 to 20): entry-bar volume vs its moving average
- Displacement (0 to 25): distance price moved beyond the band, in ATR units
- Trend alignment (0 to 20): signal direction vs a longer EMA
- Regime quality (0 to 15): more points in a clean Trending regime
- Prior distance (0 to 20): how far price held from the band before the flip
The sum (capped at 100) must exceed the Min Signal Score input to trigger entry.
🛡️ RISK MANAGEMENT AND SIZING
- Risk-based sizing: each position is sized so a stop-out risks a fixed percent
of equity.
- Capped at 90% of equity: no leverage, always a margin buffer (no liquidations).
- Selectable stops (ATR, Percent, or SuperTrend flip) and take-profits
(Risk:Reward, Percent, or None).
- Optional EMA filter, volume filter, entry cooldown, and long/short toggles.
- Default risk sits within TradingView's suggested 5 to 10 percent band. Lower it
for a more conservative profile.
⚙️ DEFAULT SETTINGS (as shown)
BTCUSDT, 4H, 6% risk per trade.
ATR length 10, base multiplier 3, regime lookback 40, ADX 14, ADX threshold 20.
Trend EMA 50, min signal score 65, ATR stop 6x, risk:reward 2.5, cooldown 5 bars.
Commission 0.06%, slippage 2 ticks.
Backtest shown: Jan 2020 to Sep 2026. Return +824%, max drawdown 24.55%, profit
factor 1.80, win rate 46.4%, 168 trades.
⚠️ NOTES ON USE
This is a trend-following system, so it performs best on instruments that trend
and expand in volatility. Expect drawdowns and losing streaks during extended
sideways periods, which is inherent to the approach.
Results shown are a historical backtest on a single instrument and do not
indicate future performance. Test on your own instrument, timeframe, and cost
assumptions before use. This is not financial advice. Strategie

ICT Daily Liquidity Sweep [PineGen AI]ICT Daily Liquidity Sweep
OVERVIEW
This strategy trades liquidity sweeps in the style of ICT (Inner Circle Trader) concepts. It marks the Asian session range each day, then looks for price to sweep above or below that range — or above/below the previous day's high/low — and reverse back inside it. A sweep followed by a close back inside the range is treated as a potential liquidity grab, and the strategy enters in the direction of the reversal.
Entries are only considered during a configurable time window (London/NY hours by default), which is when these liquidity-sweep setups are most commonly discussed in ICT-based trading approaches.
HOW IT WORKS
Asian range: the script tracks the high and low of the Asian session (00:00–08:00 UTC by default, adjustable) and locks the range once the session ends.
Sweep detection: a long setup requires price to trade below the Asian low or the previous day's low and close back above it within the trading window. A short setup is the mirror condition against the Asian high or previous day's high.
Risk and exits: stop-loss is placed beyond the sweep wick with a configurable buffer. Two take-profit levels are set at user-defined risk-reward multiples (TP1 partial close, TP2 full close). A hard time-based exit closes any open position at a configurable hour to avoid holding through low-liquidity periods.
Position sizing: quantity is calculated from account equity and a user-defined risk percentage per trade, not a fixed lot size.
SETTINGS
SL Buffer (pips) — distance beyond the sweep wick for the stop
Risk % — percentage of equity risked per trade, used to size position
TP1 / TP2 R:R — take-profit distances as a multiple of initial risk
TP1 Close % — portion of the position closed at TP1
Window Start / End (UTC) — the hours during which new entries are allowed
Labels / Session backgrounds — visual toggles only, no effect on signals
BACKTEST ASSUMPTIONS
Default backtest settings use a starting capital of 10,000, 10% of equity per trade, a 0.01% commission per side, and 2 ticks of slippage. These are configurable in the Properties tab and should be adjusted to match your actual broker/instrument costs before drawing conclusions from the results — commission and slippage assumptions materially affect strategy performance, especially on lower timeframes.
IMPORTANT NOTES
This strategy does not repaint — orders are processed on bar close and higher-timeframe data is pulled with lookahead disabled. Backtest results are hypothetical and do not account for real-world factors such as latency, partial fills, or changing market conditions, and past performance is not indicative of future results. This script is provided for educational purposes and is not financial advice. Always forward-test on a demo account before considering live use, and adjust the commission/slippage settings to reflect your actual trading costs. Strategie

Strategie

STRATEGY SCRIPT Sweep Return v1 STRATEGY SCRIPT
The "EE Sweep Return v1" is a liquidity capture indicator engineered to trade the failure of Opening Range Breakouts, systematically identifying when price sweeps above or below the morning range to trap breakout traders before reversing back inside.
**Architectural Breakdown**
| Phase | Timeframe (CT) | Mechanical Function |
| --- | --- | --- |
| **Calibration** | 08:30 - 09:30 | Maps the absolute High (`orH`) and Low (`orL`) of the cash session open. Visualized as a shaded box. |
| **Arming** | 09:30 - 15:00 | The indicator monitors for a breach. If price breaks the `orH`, it arms a potential short trap. If price breaks the `orL`, it arms a potential long trap. |
| **Execution** | 09:30 - 15:00 | The trigger fires. A **SHORT** prints if price sweeps the high but closes back below `orH`. A **LONG** prints if price sweeps the low but closes back above `orL`. |
**Operational Nuances**
* **Same-Bar Logic:** By default (`sameBar = true`), the indicator allows the break and the reversion to happen on a single candle (a wick rejection). If toggled off, it requires one candle to close outside the range, and a subsequent candle to close back inside.
* **Timezone Alignment:** The `America/Chicago` timezone anchors the logic perfectly to Central Time, ensuring the 08:30 - 09:30 window aligns flawlessly with the initial hour of the New York equities open.
## AI Integration: Evolving the Sweep Strategy
To elevate this first-principles liquidity concept into a perfectly optimized, high-level quantitative model, artificial intelligence must be integrated to eliminate false signals and maximize directional efficiency.
* **Granular Execution (Micro-Structure Analysis):** A standard sweep simply measures a price close. An AI-integrated model analyzes the Level 2 order book and footprint data during the sweep itself. Machine learning algorithms can detect real-time volume absorption—confirming exactly when institutional limit orders absorb retail stop-losses at the `orH` or `orL` before the candle even closes, executing the entry at the absolute geometric peak of the wick.
* **Contextual Volatility Filtering:** Neural networks can pre-calculate the probability of a sweep versus a true trend day by analyzing pre-market volume, VIX term structure, and macroeconomic data releases. If the AI determines a high-trend probability, it dynamically disables the sweep indicator to prevent fading a genuine breakout.
* **Dynamic Range Optimization:** Instead of a static 08:30 - 09:30 Opening Range, an unsupervised learning algorithm can dynamically adjust the time window block by block based on the underlying asset's real-time average true range (ATR) and relative volume (RVOL), perfectly sizing the trap parameters to the exact heartbeat of the current session. Strategie

Aurora KAMA | KAMA Adaptive Trend StrategyAurora KAMA Trend is a trend-following strategy built around Kaufman's Adaptive Moving Average (KAMA) — a moving average that speeds up when the market is trending cleanly and slows down when it's choppy, instead of using a fixed lookback like a standard SMA/EMA.
How it works:
Core signal: KAMA's slope determines direction. The strategy requires KAMA to be persistently rising (for longs) or falling (for shorts) over a configurable number of bars, filtering out minor wiggles near turning points.
Trend filter: An optional long-term SMA only allows longs above it and shorts below it, keeping trades aligned with the dominant trend.
Trade spacing: A cooldown period (in bars) prevents new entries from stacking up too close together during a single volatile move.
Risk management: An optional fixed percentage stop-loss, plus a trailing stop that only arms after a delay period, giving new positions room to develop before being trailed tightly.
Direction control: Trade long-only, short-only, or both.
Visuals:
The KAMA line changes color with trend direction (green/rising, red/falling, gray/flat), with a glowing red/green fill between KAMA and price whose intensity scales with the distance between them.
The trend SMA is rendered as a layered "glow" line — gold when sloping up, amber when sloping down.
Entries are marked with simple triangles; exits with small gray X's.
Tips:
Test on daily bars for liquid, trending instruments (e.g. BTCUSD, ES1!, SPY, QQQ) — KAMA needs a real trend to earn its keep.
Widen the rising/falling persistence inputs if you're getting whipsawed near turning points.
Turn off the SMA filter if you want KAMA to trade purely on its own slope, independent of the broader trend.
The trailing stop's delay is there to stop you from getting stopped out on entry noise — tighten it only if you're trading a slower timeframe.
Strategie

FlyTV - a real fruit fly connectome trading on your chartA real fruit-fly brain, wired into a trading strategy and tested honestly. 17,000 measured connections from the MaleCNS v1.0 connectome run on every bar: looming detectors watch the candles, the giant fiber fires the escape reflex, and the mushroom bodies learn from realised P&L. The answer to the obvious question is no — it does not beat buy & hold, and this publication shows exactly how that was established.
█ WHAT IS REAL AND WHAT IS MODELED
Measured — taken from the connectome, not invented:
the wiring: 995 neurons and 17,000 connections in this script, distilled from a 5,084-neuron, 108,317-connection subgraph of MaleCNS v1.0
the looming pathway LC4 / LPLC2 → DNp01, 11,198 synaptic contacts
connection signs derived from predicted neurotransmitters
the identity and function of the command neurons, known from stimulation experiments
the KC→MBON plasticity rule and MBON valence, which matched the published literature
Modeled — our assumptions, and they matter:
spiking dynamics: leaky integrate-and-fire, 20 steps per bar
sensory tuning, which the annotations do not contain at all
the entire mapping from market data to sensory organs
how spikes become an order
no retinotopy: every detector receives the same stimulus
A connectome is a static anatomical snapshot, not a living brain. This is a visualization of measured neuroscience, not a validation of fly physiology.
█ CONCEPTS
Most connectome demos begin by choosing where to plug the neurons in. That question is already answered by biology: the fly has command neurons whose function is known from experiments, and they span the same discrete action space a trader picks from.
DNp09 — walks forward → go long
MDN, the "moonwalker" — walks backward → exit
DNa01 / DNa02 — turns → flip direction
DNp01, the giant fiber — takes off and escapes → flatten now, risk-off
DNg11 — grooms → stay flat and wait
A selloff is, to a fly, an object rushing toward its eye. That is not a metaphor: LC4 and LPLC2 are looming detectors and they feed the giant fiber directly, which is the fastest escape pathway in the animal.
Reward is not bolted on with reinforcement learning — the moment an optimiser touches the weights, the gradient is trading, not the fly. The animal ships its own machinery: Kenyon cells give a sparse code of context, dopaminergic PAM and PPL1 neurons carry reward and punishment, and KC→MBON synapses depress when a cell was active as dopamine arrived. Realised P&L drives that dopamine, so learning happens bar by bar, inside the backtest, using only bars the fly has already seen.
█ THREE LAYERS, ONLY ONE OF THEM LEARNS
Reflexes — frozen. The measured connections. No reward, no gradient, no fitting. There is nothing here to overfit with.
Body interface — about 15 numbers. Sensory gain, the spikes-to-order threshold, the escape cooldown. These are not in the connectome, so they were tuned externally. The brain was not touched.
Mushroom bodies — online learning. 4,934 KC→MBON synapses in this build, updated by the three-factor rule the animal uses.
█ FEATURES
Version selector: buy & hold, reflexes only, reflexes + mushroom bodies, or mushroom bodies only. Use it to see which layer is responsible for what.
The fly panel : one pixel fly with a see-through head, drawn on the price chart. Optic lobes, mushroom bodies, central complex, giant fiber and legs light up as the circuits that carry them fire.
HUD : per-circuit readout — looming input, giant-fiber charge against its threshold, mushroom body bias, dopamine, and how much of the synaptic weight the learning has eaten so far.
Crowd sense : an optional non-price input, the long/short account ratio on the perpetual. Off by default, and the description below explains why.
█ HOW TO USE IT
Built and tested on crypto, H1. Start with the defaults, watch the giant-fiber charge during a selloff, and switch Version between "reflexes" and "reflexes+MB" to see which part moves the curve. Every state update happens on bar close; the avatar animates intraday, the network does not. The network is computed over the last 4,000 bars only — 17,000 connections times 20 steps per bar does not leave room for more inside the 20-second run budget — so the Strategy Tester covers that window, not the seven and a half years quoted below. The mushroom bodies need a long run to accumulate anything, so keep the timeframe low enough that 4,000 bars still span a meaningful stretch.
█ RESULTS, AND WHY THEY PROVE NOTHING
Tested on BTCUSDT, H1, from 7 October 2018 to 3 May 2026 — 66,315 bars, one window, no window shopping. Starting equity $1,000, long only, one position.
the fly: $4,231, max drawdown 48%, exposure 44.6%, 13,958 round trips
buy & hold: $11,904, max drawdown 77%, one entry in seven and a half years
random entries at the same exposure, 12 seeds: $7,400 ± 8,900 — the fly beat six of twelve
with a realistic maker fee of 0.02% per side: $16
So it ends up in profit, and the profit carries no information. It was long 45% of the time in an asset that went up 12x; any process entering at that rate would also print a gain, and the random benchmark's dispersion swallows the result whole. The simplest possible approach — buy and do nothing — wins by almost three times. Fees finish what randomness starts.
One result did survive every control: drawdown came in below the random benchmark in ten runs out of twelve, and 1.6x below buy & hold. The effect is small and it is about risk, not return.
█ LIMITATIONS
No edge was found. Ten hypotheses, roughly forty-five runs, each with a shuffled-weight control and an out-of-sample split. None beat a random benchmark reliably on price inputs.
The escape reflex does not anticipate. It fires on the close of the bar that already fell. It catches crashes cleanly — 19 of the 20 largest drops — but there is no foresight in it.
Crowd sense is non-stationary : 17/18 in-sample, 6/18 out-of-sample. That is why it ships off.
Trade count is high. Any realistic fee dominates the result. The script ships with a 0.02% maker fee per side and no slippage, because that is what the published test used. Set both to your own venue before drawing conclusions from the Strategy Tester.
This is a distillation. The full subgraph is six times larger; it does not fit in the platform budget. Measured on a separate 2022-2026 window, the distilled circuit reproduces 0.968 of the full circuit's giant-fiber activity and 36 of its 39 escapes to within one bar.
█ THE CONTROL THAT MAKES THIS MORE THAN A STUNT
Any connectome demo faces one question: is the brain responding, or the scaffolding around it? Shuffle the connection weights while preserving the node degree distribution — same neurons, same connection count, same total activity, random addressing. On the same looming stimulus the real wiring produces 98 giant-fiber spikes over 100 simulation steps and the shuffled one produces zero, identically across ten seeds, while total network activity differs by half a percent (15,648 versus 15,570). The avoidance response lives in the measured connections, not in the code around them.
█ WHY THIS IS IN PINE AND NOT IN A NOTEBOOK
The platform limits are the interesting part: 500 ms per bar, 20 seconds per run, a cap on tokens in the source. A budget you cannot buy your way out of, which is what forced the distillation and then the proof that the decisions had not moved. Two techniques do the heavy lifting and are reusable for any network with fixed weights: a string literal costs one token regardless of length, so the edge list ships as packed text and expands on the first bar; and propagation is event-driven, walking a spike queue instead of sweeping every cell. The source is open — take them.
█ DATA AND CREDITS
Connectome: MaleCNS v1.0, licensed CC BY 4.0 — FlyEM at HHMI Janelia Research Campus, University of Cambridge, MRC Laboratory of Molecular Biology, and Google Research. Berg et al., 2026. The FlyWire connectome is deliberately not used here: its licence is non-commercial.
Nothing in this publication is financial advice. Past behaviour of any strategy, including this one, says nothing about the future. Strategie

Double U Strategy with Webhook AlertsDouble U Strategy with Webhook Alerts
Double U Strategy is a trend-following strategy built around two independent ATR-based engines, one for long entries and one for short entries. The idea comes from the ATR trailing-stop approach commonly associated with UT Bot, but Double U uses a different implementation and trading structure. The reason for separating the two sides is simple: bullish and bearish moves often behave differently, so forcing both directions to use exactly the same ATR settings is not always useful.
The long and short engines each have their own sensitivity and ATR period. A long entry can occur when price crosses above the long ATR trail while remaining above the trend EMA, while a short entry can occur when price crosses below the short ATR trail while remaining below the same EMA. The EMA is therefore used as a regime filter rather than as an entry signal by itself.
The strategy also supports pyramiding. If another valid signal appears while a position in the same direction is already open, the strategy can add to that position until the pyramiding limit is reached. The default limit is three entries, but this can be changed from the Strategy Properties.
Exits use a separate mechanism instead of simply waiting for the ATR engine to reverse. The script compares the current close with the close a configurable number of bars earlier and counts consecutive moves in the same direction. Once the required sequence is reached, the current position is closed. This keeps entry and exit logic independent: ATR behavior decides when to enter, while the sequence logic decides when an extended move has progressed far enough to exit.
The default configuration was selected as a practical starting point for testing rather than as a claim of universal optimization. The current setup uses a long-term EMA filter together with different ATR settings for long and short trades, reflecting the asymmetric design of the strategy. Results can change significantly between instruments and timeframes, so the parameters should be tested rather than treated as fixed recommendations.
Webhook alerts
Webhook support is built directly into the strategy. Entry and exit orders generate structured alert messages automatically, so there is no need to manually create separate JSON messages for buys, sells, or closes.
When creating a TradingView strategy alert, the Message field should contain only:
{{strategy.order.alert_message}}
The strategy includes a platform selector and an optional symbol override. If the symbol field is left empty, the chart ticker is sent in the webhook message. If an external execution system requires a different symbol, the required ticker can be entered directly. This is useful not only for crypto, but also for futures, forex, indices, metals, or any case where the TradingView symbol differs from the execution symbol.
For example, a strategy can run on a continuous futures chart while the webhook sends the currently tradable contract instead. The trading logic remains attached to the chart, while the execution symbol can be changed without modifying the Pine code.
Statistics
A compact statistics table is displayed on the chart to make parameter testing faster. It shows net profit, number of closed trades, win rate, profit factor, test period, pessimistic profit factor, maximum intratrade drawdown, and Sharpe ratio.
The drawdown value in this table is intentionally different from TradingView's portfolio-level maximum drawdown. It shows the largest adverse movement experienced inside any closed trade, which makes it useful when comparing parameter combinations and estimating how much floating loss a trade may have experienced before closing.
The Sharpe ratio is calculated from monthly equity returns using a 2% annual risk-free rate and is annualized from monthly observations.
Backtesting notes
The strategy uses 10% of equity as the default order size, allows up to three pyramided entries, processes orders on bar close, and includes 15 ticks of slippage by default. Commission is not hard-coded because the script can be tested on instruments with very different pricing models. Users should set commission, margin, slippage, and other Strategy Properties according to the broker, exchange, and instrument they actually intend to trade.
Historical results are hypothetical and depend on the selected market, timeframe, data source, execution assumptions, and parameters. The purpose of Double U Strategy is to provide a transparent strategy that can be backtested, adjusted, and connected to webhook-based execution, not to predict future performance. Strategie

Adaptive Supertrend MA Crossover StrategyAdaptive Supertrend MA Crossover
Overview
This strategy trades the crossover between a Moving Average and a Supertrend line - a classic trend-following combination - but with two design choices that set it apart from the standard version of this idea already published elsewhere:
1. The Supertrend and the Moving Average each take their own independently selectable price source (Open, High, Low, Close, HL2, HLC3, OHLC4, or HLCC4), rather than both being locked to Close.
2. A new Moving Average source option: "EMA of Supertrend." Instead of feeding the MA a raw price series, this applies an EMA directly to the Supertrend line itself, and then runs your chosen MA type (SMA/EMA/HMA/WMA) on top of that smoothed line. The result is a crossover between two different "views" of the same underlying trend structure, rather than a crossover between price and trend.
Why "EMA of Supertrend" matters
A standard Supertrend line is deliberately steppy - it holds a level and jumps, rather than moving smoothly, which is what makes it useful as a stop/trend marker but also means a plain price-vs-Supertrend crossover can be noisy on choppy days (price whipsaws across a flat Supertrend step repeatedly).
Applying an EMA to the Supertrend line first produces a smoothed trend proxy that still reacts to genuine Supertrend flips, but rounds off the sharp step edges. Running your chosen Moving Average on top of that, rather than on top of price, means the crossover signal is comparing two related measures of trend, not fighting against Supertrend's inherent steppiness. This tends to produce fewer false flips in sideways conditions while still catching genuine trend changes, without adding a second unrelated indicator to the chart.
This source option is exposed directly in the settings (MA Source = "EMA of Supertrend"), with its own dedicated smoothing period, so it's a toggle away from the standard price-source approach for direct comparison on your own charts.
Caption: Chart example on GOLDPETAL, 15-min: long & short entry on the MA-Supertrend crossover.
How it works
Supertrend: calculated from your selected source (default HL2, the traditional Supertrend basis) with a configurable ATR Period and ATR Factor. Unlike TradingView's built-in Supertrend function (which is hard-coded to HL2), this version lets the basis price and the trend-flip check both use whichever source you select.
Moving Average: choose SMA, EMA, HMA (Hull), or WMA, computed on your selected source, including the "EMA of Supertrend" option described above.
Entry signal: long when the Moving Average crosses above the Supertrend line, short on the opposite cross.
Reverse Trading Mode: a single toggle that inverts the signal (useful for quickly testing whether the opposite side of a crossover performs better on a given instrument/timeframe, without rebuilding the logic).
Stop Loss / Take Profit: both optional and independently toggleable, with a shared basis switch between Percentage (of entry price) and Points, so the same settings panel works whether you're trading a low-priced or high-priced instrument.
Settings guide
(select this whole list after pasting and click the bullet-list button)
Supertrend Source - price series used for the Supertrend basis and trend-flip check
ATR Period / ATR Factor - standard Supertrend volatility inputs
MA Type - SMA / EMA / HMA / WMA
MA Source - price source, or "EMA of Supertrend"
EMA of Supertrend Period - smoothing period applied to the Supertrend line (only active when MA Source = EMA of Supertrend)
Reverse Trading Mode - inverts long/short signals
Use SL / Use TP, Basis, Values - optional exit management, Percentage or Points
Caption: Strategy Tester summary, GOLDPETAL futures, 15-min, , default settings.
Disclaimer:
This script is a technical trading tool for educational and informational purposes. It does not constitute financial advice, and past performance in backtesting does not guarantee future results. Always test thoroughly on your own instruments and timeframes, and use appropriate risk management, before considering live use. Strategie

Sweep & Reverse | Liquidity Sweep Reversal StrategyThis strategy trades the liquidity-sweep reversal pattern: price wicks through a prior swing high or low — clearing out the stops resting there — then closes back inside the range, suggesting the move beyond that level was a stop-hunt rather than a genuine breakout.
How it works:
Confirmed swing highs and lows (via pivot detection) are stored as watched levels.
A sweep triggers when a bar wicks past a level but closes back on the other side.
Longs enter on swept lows, shorts on swept highs. The stop sits just beyond the sweeping wick (with an ATR buffer); the target is set from your chosen reward:risk ratio.
Levels expire if left untouched for too long, and new levels too close to an existing one (relative to ATR) are skipped to keep zones from cluttering.
Features:
Optional volume-spike filter — only counts sweeps backed by above-average volume
Optional rejection-wick filter — requires the sweeping wick to be meaningfully larger than the bar's body, filtering out weak/low-conviction sweeps
Optional next-bar confirmation — waits one bar past the sweep and only enters if price actually continues in the reversal direction, reducing whipsaw entries
Optional session window filter (defaults to the London/NY overlap, the highest-liquidity window)
Adjustable stop distance, minimum stop size, and reward:risk ratio
Breakeven stop management once a trade moves partway to target
Long/short can be toggled independently
Every trade's entry/SL/TP lines persist on the chart after the trade closes (auto-expiring after a configurable number of bars), so past trades stay visible for review
Styled performance dashboard: trade count, win rate, net profit, live position state
Warnings:
This is fundamentally a mean-reversion pattern. In strongly trending markets, sweeps frequently continue rather than reverse — no combination of filters here eliminates that risk.
Backtest results are sensitive to pivot length, stop distance, and which filters are enabled. A high win rate on a small number of trades is not statistically meaningful — test across multiple instruments and timeframes, and evaluate profit factor and max drawdown alongside net profit, not net profit alone.
Past performance in a backtest, including this one, does not guarantee future results. This is not financial advice. Strategie

LINK Above $12.20: Is $15 Back on the Table?Hey traders! 👋
After that solid push higher, LINK is now pulling back into the breakout zone, so $12.00–$12.20 is back on my radar. This was the area that kept a lid on price through most of August and I still see it as the key zone for keeping the bullish structure alive.
I’m definitely not the guy who wants to jump on a moving train just because everyone else is buying. 😄 My plan is simple and emotionless: close above $12.20, then checks three things before entering: price above the long-term SMA 200, RSI 14 above 50, and a bullish MACD 12/26/9.
This filter keeps us away from fake breakouts that lack real momentum.
For the trade itself, my preferred entry zone is $12.20–$12.30 after confirmation. With the strategy’s default settings, the SL is 1.5% below entry, which puts it around $12.02–$12.12, while the mechanical TP is 3% above entry, around $12.57–$12.67. These levels are calculated automatically from the actual entry price rather than being fixed on the chart.
📈 Where could LINK go next?
If LINK gets back above $12.20 and keeps the momentum going, $13.67 is the next level I’m watching closely. Above that, we have $14, and if buyers can push through that area cleanly, the bigger $15–$15.50 zone starts looking pretty interesting.
What about support?
🟢 $12.00 - key psychological support
🟢 $11.50 - first lower support
🟢 $11.00 - next support zone
🟢 $10.70 - deeper technical support
The beauty of this setup? No guessing tops or bottoms. We just wait for buyers to show up, let RSI and MACD confirm and execute.
So, what would you do here? 👀 Take the breakout above $12.20, or wait for LINK to clear $13.67 before getting involved? Drop your setup in the comments.
Disclaimer: Trading crypto involves substantial risk, and this is only my personal read of LINK’s market structure, not financial advice. I always define invalidation before entering, size positions carefully, and accept that price can do something different from my base case.
Strategie

Strategie

ORB+VWAP NY BounceORB + VWAP Bounce — opening-range break with a resting VWAP retest
An intraday entry model for the 1-minute chart on index futures. It
combines an opening-range breakout filter with a mean-reversion entry,
and it only ever takes one trade per session.
THE IDEA IN ONE SENTENCE
The opening range breaks; a resting LIMIT order then waits at the
session VWAP and fills the moment price retests it in the direction of
that break.
HOW IT WORKS
Each session runs through three phases.
1. RANGE — the script records the high and low of the opening-range
window (09:30–10:00 New York by default). Nothing is armed until
this window closes.
2. BREAK — when price closes beyond that high or low, the side of the
break sets the direction for the rest of the day. Broke up = long
only. Broke down = short only. This is the only thing that decides
direction.
3. RETEST — from the start of the entry window, a limit order rests on
the session VWAP, anchored at the RTH open. A long fills on the
pullback down to it; a short fills on the rally up to it.
WHY THE ENTRY IS A RESTING LIMIT, NOT A MARKET ORDER
This is the part worth understanding before using it.
A buy limit can only rest BELOW the market, and a sell limit only
ABOVE it. So "price is on the correct side of VWAP" is not something
the script has to check — it is inherent to the order type itself. A
long only exists if price is above the VWAP and pulls back into it; a
short only exists if price is below and rallies into it.
That is why there is no separate trend filter or bias input in this
script: there would be nothing left for it to decide. The break sets
direction, the order type enforces location.
The trade-off is real and you should know it: a resting limit fills at
a known price but is not guaranteed to fill at all. Days where price
breaks and never returns to the VWAP simply produce no trade. The
script is designed to sit out far more often than it trades.
SETTINGS
Session / Time — timezone, the RTH session that defines the trading
day, the opening-range window, the entry window, and a forced flat
time. No position is ever carried overnight.
Entry Logic — direction (long only / short only / both), which VWAP
anchor the limit rests on (RTH open or Globex open), an optional tick
offset so the limit sits a hair on the approach side, and the maximum
number of trades per day.
Filters / Seasonality — day-of-week switches, month exclusions, and
separate gates for the short side only (a time cut-off, weak months,
and a weekday block). All of these are OFF or neutral by default. They
exist so you can test whether your own instrument and session show
asymmetries, not because any particular setting is recommended.
Setup Quality — an optional gate on the size of the opening range,
measured either in points or as a multiple of the previous day's ATR.
The ATR mode is self-scaling, so one setting holds across changing
volatility regimes. OFF by default.
Stop / Target — the stop can be a fixed tick distance, a multiple of
the daily ATR, the VWAP line itself, the opposite side of the opening
range, or a retest swing. Targets can be an R multiple, a multiple of
the range, a fixed tick distance, or none at all.
Trailing Stop — optional, by R multiple or by points, with a
configurable activation threshold. There is a switch to remove the
fixed target once the trail is active, so a runner is not capped.
Risk Management — position size derived from a fixed dollar risk and
the actual stop distance, or a fixed contract count. Note that the
derived size is a step function: contracts = floor(risk / (stop
distance x point value)). Small changes in risk can leave the contract
count unchanged, and then jump it by a whole contract.
WHAT ELSE IS ON THE CHART
A Market Positioning table compares price against five VWAPs (session,
overnight, previous session, high-of-day, low-of-day) plus the opening
range, for the chart symbol and two correlated tickers you choose. It
also reports the opening-range size in points and in ATR multiples,
and the daily ATR itself.
There is an optional risk:reward box drawn on each entry, and an
optional prop-firm tracker that reports balance, distance to a
trailing drawdown line, worst margin reached, and a consistency
measure.
Every order carries a JSON alert_message suitable for automation
platforms that parse webhook payloads.
BACKTESTING NOTES — PLEASE READ
Two Properties settings change results substantially on this script,
and both default to values that flatter it:
- Limit order execution. Every entry here is a limit order resting on
the VWAP. The "Requested price" setting assumes a fill the moment
price grazes the line without trading through it, which is
optimistic for a resting order. Use "Standard".
- Bar detalization. Set it to High. On a 1-minute chart with intrabar
stop and target logic, the default resolution is too coarse.
Also apply realistic commission and slippage for your instrument
before drawing any conclusion.
LIMITATIONS
This script takes at most one trade per session and requires both a
range break and a retest, so it trades infrequently. On any given
instrument the sample it produces over a few years may be small enough
that ordinary variance dominates. Treat any backtest of it as a
description of one particular past, not as an expectation.
Seasonal and day-of-week filters are especially easy to overfit: with
a handful of trades per month, apparent patterns appear by chance.
They ship neutral for that reason. If you turn them on, check that the
effect holds in every year of your sample independently, not just in
the total.
Defaults are a starting point for the instrument and session they were
written around. They are not tuned for yours.
Nothing here is financial advice. Strategie