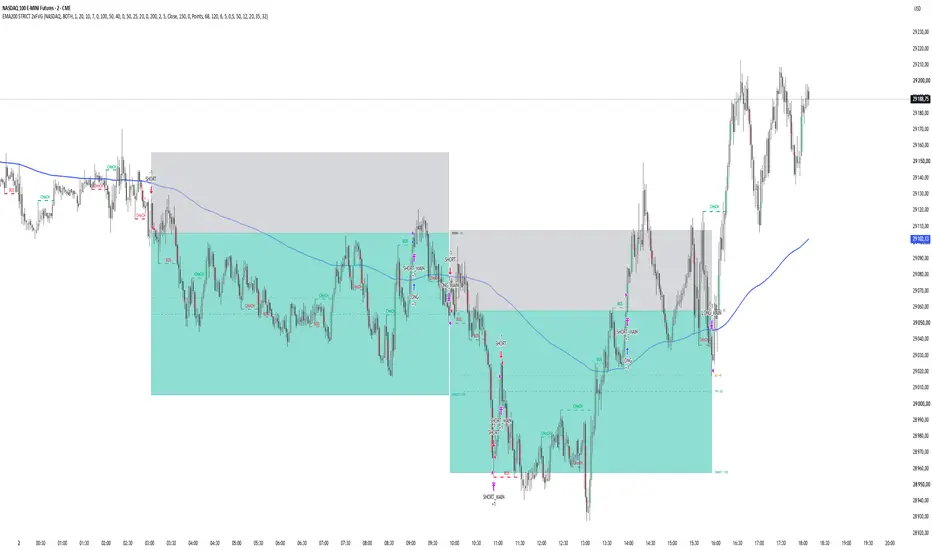
EMA200 REGIME + BOS/CHoCH + 2x FVG StrategyEMA200 Regime + BOS/CHoCH + 2x FVG Strategy
Overview
EMA200 Regime + BOS/CHoCH + 2x FVG Strategy is a rule-based TradingView strategy designed primarily for 2-minute intraday trading.
The strategy combines four core concepts:
EMA200 directional regime
Market Structure: BOS and CHoCH
Two-FVG confirmation logic
Limit entry at 50% of the body of the signal candle
The main objective is to identify continuation or reversal setups that develop while price remains on the correct side of the EMA200.
Unlike a simple EMA crossover strategy, the EMA200 is used mainly as a directional regime filter. A crossover activates either LONG or SHORT mode, but the strategy still requires market structure and Fair Value Gap confirmation before an entry can be created.
This script is a full strategy() implementation and is intended for use with TradingView's Strategy Tester.
1. EMA200 Regime Logic
The EMA200 determines the allowed trading direction.
SHORT regime
A SHORT regime begins when price crosses the EMA200 from above to below.
The regime remains active as long as price continues to close below the EMA200.
A SHORT regime is cancelled when:
Close > EMA200
A wick above the EMA200 alone does not necessarily invalidate the regime when structure confirmation is based on candle close.
During an active SHORT regime, the strategy searches for:
bearish BOS or bearish CHoCH
bearish 2x FVG
a valid signal candle
a retracement to the calculated limit-entry price
LONG regime
A LONG regime begins when price crosses the EMA200 from below to above.
The regime remains active while price closes above the EMA200.
The LONG regime is cancelled when:
Close < EMA200
During the active LONG regime, the strategy searches for:
bullish BOS or bullish CHoCH
bullish 2x FVG
a valid signal candle
a retracement to the limit-entry price
Important
The EMA regime does not expire after a fixed number of candles.
For example, if price remains below the EMA200 for 40 candles on the 2-minute chart, the SHORT regime may remain active for the entire period.
This is intentional.
The time limit applies to the relationship between the market-structure event and the 2x FVG confirmation, not to the EMA regime itself.
2. Market Structure
The strategy uses confirmed swing highs and swing lows to detect market-structure breaks.
Swing sensitivity is controlled by:
Swing Length
The default value is:
5
The script uses confirmed pivots and therefore does not require future data beyond the normal pivot-confirmation process.
3. BOS — Break of Structure
A bullish structure break occurs when price breaks above the most recent valid swing high.
A bearish structure break occurs when price breaks below the most recent valid swing low.
The user can select whether a structure break is confirmed using:
Close
Wick
The default setting is:
Close
This means that by default a wick through a swing level is not enough. The selected confirmation source must actually break the swing level.
Bullish BOS
If the current market structure is already bullish and another swing high is broken, the event is classified as:
Bullish BOS
Bearish BOS
If the current market structure is already bearish and another swing low is broken, the event is classified as:
Bearish BOS
4. CHoCH — Change of Character
CHoCH represents a break against the previously established market-structure direction.
Bullish CHoCH
If the previous structure was bearish and price breaks a valid swing high, the strategy classifies the event as:
Bullish CHoCH
Bearish CHoCH
If the previous structure was bullish and price breaks a valid swing low, the event is classified as:
Bearish CHoCH
The structure engine also handles newly confirmed pivots that may already have been broken by the time the pivot becomes confirmed.
This helps keep the strategy's BOS/CHoCH logic consistent with the structure displayed on the chart.
5. Fair Value Gap Definition
The strategy uses a classic three-candle FVG definition.
Bullish FVG
A bullish FVG exists when:
low > high
This means that the current candle's low is above the high from two candles earlier.
The gap is located between:
high and low
Bearish FVG
A bearish FVG exists when:
high < low
The gap is located between:
high and low
An optional minimum FVG-size filter can also be enabled.
The minimum size can be expressed in:
points
ticks
6. 2x FVG Logic
The strategy does not simply count every two consecutive FVG labels as a valid 2x FVG.
Instead, same-direction FVGs are grouped into clusters.
For example, several bullish FVGs that overlap each other can be treated as part of the same imbalance cluster.
A new same-direction FVG that does not overlap the existing cluster, while still occurring within the allowed number of bars, creates the second imbalance required for the:
2x FVG condition
The maximum allowed distance is controlled by:
Max bars between FVG
Default:
5
This approach is intended to prevent several overlapping gaps from being incorrectly counted as multiple independent imbalances.
7. Matching BOS/CHoCH With 2x FVG
During an active EMA regime, the strategy remembers the most recent valid structure event and 2x FVG event in the same direction.
For SHORT:
bearish BOS or bearish CHoCH
bearish 2x FVG
For LONG:
bullish BOS or bullish CHoCH
bullish 2x FVG
The two events must occur within the user-defined setup window.
Default:
Max bars: BOS/CHoCH ↔ 2x FVG = 15
On a 2-minute chart this represents a maximum separation of approximately:
30 minutes
Importantly, the two conditions do not have to occur in one fixed order.
Both sequences may qualify:
BOS/CHoCH → 2x FVG
or:
2x FVG → BOS/CHoCH
The script compares the distance between the two events.
If they are sufficiently close, the setup becomes:
SETUP READY
8. Signal Candle
Once the structure condition and 2x FVG condition have both been completed, the strategy waits for the next candle to close.
That candle becomes the:
Signal Candle
The strategy does not enter during an unfinished signal candle.
This avoids using information that would not have been known at the time.
9. Entry Price
The entry is calculated from the body of the signal candle.
The formula is:
Entry = (Open + Close) / 2
This is the midpoint of the candle body.
It is not:
(High + Low) / 2
After the signal candle closes, the strategy submits a LIMIT order at this body midpoint.
Example:
Open:
25,020
Close:
25,000
Entry:
25,010
The entry price is fixed after the signal candle closes and is not moved afterward.
10. Limit Order Validity
The market must retrace back to the calculated 50% body level.
The pending order remains valid for:
LIMIT Entry Validity Bars
Default:
5
If price does not reach the entry level during this period, the pending setup expires.
Importantly, expiration of the individual setup does not cancel the entire EMA regime.
For example:
price remains below EMA200
SHORT mode remains active
one limit entry expires
the strategy can continue searching for a new bearish BOS/CHoCH + 2x FVG setup
11. Multiple Setups Inside One EMA Regime
The strategy can detect more than one trade during the same directional EMA regime.
Example:
Price crosses below EMA200
↓
SHORT MODE
↓
Bearish BOS + bearish 2x FVG
↓
Trade #1
↓
Trade closes
↓
SHORT MODE remains active
↓
New bearish BOS/CHoCH + bearish 2x FVG
↓
Trade #2
This continues until the directional regime is invalidated.
For SHORT:
Close > EMA200
For LONG:
Close < EMA200
12. GOLD Preset
When the selected market is:
GOLD
the default values are:
Take Profit: 20 points
Stop Loss: 10 points
Break-Even Trigger: +15 points
Break-Even Offset: 0
Example SHORT:
Entry:
3800
Stop:
3810
Target:
3780
Break-even activates when price reaches:
3785
The stop is then moved to the entry price when the default BE Offset is zero.
13. NASDAQ Preset
When the selected market is:
NASDAQ
the default values are:
Take Profit: 100 points
Stop Loss: 50 points
Break-Even Trigger: +50 points
Break-Even Offset: 0
Example SHORT:
Entry:
25,000
Stop:
25,050
Target:
24,900
Break-even trigger:
24,950
These values represent actual price points, not ticks.
14. CUSTOM Market Mode
The CUSTOM preset allows manual configuration of:
Take Profit
Stop Loss
Break-Even Trigger
Break-Even Offset
This allows the strategy to be tested on other instruments or with different risk parameters.
15. Break-Even Logic
Break-even is handled automatically.
SHORT
If price reaches:
Entry - BE Trigger
the stop is moved to:
Entry + BE Offset
With:
BE Offset = 0
the stop moves exactly to the entry price.
LONG
If price reaches:
Entry + BE Trigger
the stop is moved to:
Entry - BE Offset
Once break-even has been activated, the stop is not intentionally moved back to the original stop-loss level.
16. TP1
The strategy also calculates an intermediate TP1 level.
Default:
50% of the distance between Entry and final Target
Example NASDAQ:
Main Target:
100 points
TP1:
50 points
Example GOLD:
Main Target:
20 points
TP1:
10 points
By default TP1 can be used as a visual reference.
The optional:
Enable Partial TP1
setting allows part of the position to be closed at TP1.
The percentage is controlled by:
TP1 Quantity %
17. Position Visualization
Active trades can be displayed using a risk/reward style box.
The visual structure includes:
Stop area
Entry line
TP1 line
Break-even trigger line
Main target
Trade labels
The STOP area is displayed above a SHORT entry and below a LONG entry.
The TARGET area is displayed below a SHORT entry and above a LONG entry.
The visualization is intended to resemble the logic of TradingView's Long/Short Position drawing tool.
18. Trade Direction
The strategy supports three directional modes:
SHORT ONLY
Only bearish setups are traded.
LONG ONLY
Only bullish setups are traded.
BOTH
Both bullish and bearish setups are allowed.
Default:
BOTH
19. Recommended Timeframe
The strategy is designed primarily around the:
2-minute timeframe
A visual warning can appear if another timeframe is selected.
The script is not technically locked to 2 minutes, but changing the timeframe changes the meaning of parameters expressed in bars.
For example:
15 bars
represents:
30 minutes on 2M
75 minutes on 5M
225 minutes on 15M
Users should therefore retest all parameters when changing timeframe.
20. Debug Mode
Debug Mode can be enabled to inspect the internal setup process.
It can show events such as:
SHORT MODE
LONG MODE
SETUP READY
LIMIT CREATED
The debug table can also display the current state of:
timeframe
EMA regime
BOS/CHoCH confirmation
2x FVG confirmation
setup readiness
pending limit
active position
This is particularly useful when reviewing historical setups that appear visually valid but did not produce a trade.
21. Backtesting
This script uses:
strategy()
rather than:
indicator()
and is therefore designed for TradingView's Strategy Tester.
It includes:
fixed contract quantity
configurable date range
stop loss
take profit
break-even
optional partial TP1
limit entries
Strategy Tester trade statistics
The strategy also uses:
calc_on_order_fills = true
calc_on_every_tick = true
use_bar_magnifier = true
Bar Magnifier can improve the realism of historical order execution when lower-timeframe data is available.
However, historical backtests can never perfectly reproduce live execution.
22. Futures Margin Configuration
The strategy includes:
margin_long = 10
and:
margin_short = 10
This represents a 10% simulated margin requirement in TradingView's broker emulator.
This setting is included primarily so that futures contracts with a high notional value are not automatically rejected simply because the simulated account does not contain 100% of the contract's notional value.
This is a backtesting configuration only.
It does not represent a specific broker's real margin requirement.
23. Non-Repainting Principles
The strategy is designed to avoid using future information for its trading decisions.
Important rules include:
structure breaks are evaluated only using available information
pivots are used only after confirmation
the signal candle must close before its midpoint can be calculated
the limit order is created only after the signal candle has closed
historical entry prices are not moved backward to make the backtest look better
the script does not intentionally use lookahead data
A confirmed pivot naturally requires candles to form after the actual swing point. This is standard pivot confirmation and should not be confused with repainting.
24. Entry Sequence Summary
SHORT
Price crosses below EMA200
↓
SHORT regime becomes active
↓
Bearish BOS or bearish CHoCH
↓
Bearish 2x FVG
↓
Conditions must be within allowed setup distance
↓
Next candle closes
↓
Entry = 50% of signal candle body
↓
SHORT limit order
↓
Price retraces to entry
↓
Position opened
↓
SL / BE / TP management
LONG
Price crosses above EMA200
↓
LONG regime becomes active
↓
Bullish BOS or bullish CHoCH
↓
Bullish 2x FVG
↓
Conditions must be within allowed setup distance
↓
Next candle closes
↓
Entry = 50% of signal candle body
↓
LONG limit order
↓
Price retraces to entry
↓
Position opened
↓
SL / BE / TP management
25. Main Inputs
Market Settings
Market
Trade Direction
Contracts
GOLD TP / SL / BE
NASDAQ TP / SL / BE
CUSTOM parameters
EMA Settings
Show EMA200
EMA Length
EMA Color
EMA Width
Structure Settings
Enable BOS
Enable CHoCH
Swing Length
Structure Break Confirmation
Structure labels
Structure lines
FVG Settings
Enable FVG
Show FVG
Maximum bars between FVGs
Minimum FVG filter
FVG size
FVG units
FVG colors
2x FVG markers
Setup Settings
Max bars between BOS/CHoCH and 2x FVG
Pre-cross event lookback
Entry Settings
LIMIT Entry Validity Bars
Risk Management
TP1 position
Partial TP1
TP1 quantity
Same-bar historical BE behavior
Visual Settings
Position box
Trade labels
EMA regime background
timeframe warning
26. Intended Use
This strategy is intended as a structured framework for researching a specific intraday trading model based on:
trend regime + market structure + imbalance + retracement entry
It is particularly useful for studying whether BOS/CHoCH and multiple Fair Value Gaps provide meaningful confirmation after price establishes direction relative to the EMA200.
The purpose of the script is not to predict every market move.
It is designed to convert a discretionary chart-reading process into explicit and testable rules. Strategie
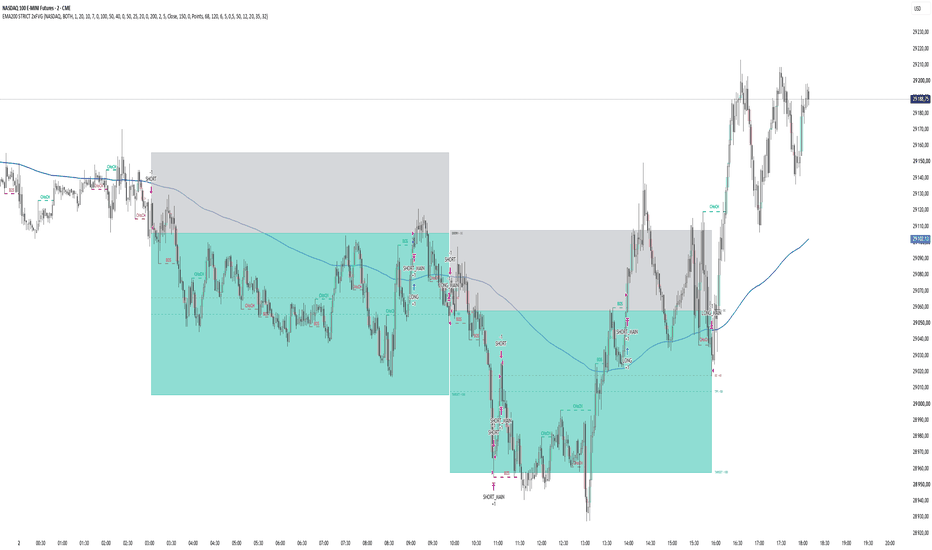
Indikator

2x FVG + BOS/CHoCH + EMA + RSI Gradient + PVSRAOVERVIEW
2x FVG Structure and PVSRA Footprint Toolkit is an intraday market-analysis indicator designed to combine several different layers of market information into one structured workflow:
1. Trend and directional context using EMA 50 and EMA 200
2. Market structure using BOS and CHoCH
3. Price imbalance using Fair Value Gaps
4. Detection of two distinct same-direction FVG structures
5. Volume-based PVSRA / Vector Candle classification
6. Volume Footprint Buy/Sell dominance
7. Optional RSI-based candle coloring
8. Alerts for selected structural, EMA, FVG and PVSRA events
The purpose of combining these modules is not to produce a standalone automatic buy or sell signal.
Instead, the indicator is intended to help traders evaluate several independent pieces of market information on the same chart and determine whether price structure, imbalance, volume activity and directional participation are supporting the same market scenario.
The indicator does not place trades, calculate position size, define risk, or guarantee future price direction.
WHY THESE MODULES ARE COMBINED
This indicator is not intended to be a collection of unrelated indicators.
Each module has a specific role in the analysis process.
EMA 50 and EMA 200 provide broader directional context.
BOS and CHoCH identify changes or continuation in confirmed market structure.
Fair Value Gaps identify three-candle price inefficiencies.
The 2x FVG module identifies situations where two separate same-direction imbalance structures occur within a configurable number of bars.
PVSRA highlights candles with abnormal volume or volume-spread activity.
Volume Footprint statistics provide additional information about the distribution of classified Buy and Sell volume inside selected candles.
The intended workflow is therefore:
CONTEXT
→ STRUCTURE
→ IMBALANCE
→ VOLUME
→ FOOTPRINT CONFIRMATION
A trader can use each layer independently, but the main purpose of the indicator is to provide contextual confirmation between different types of market information.
EMA 50 AND EMA 200
The indicator calculates two Exponential Moving Averages:
Fast EMA:
Default length = 50
Slow EMA:
Default length = 200
Both lengths, colors and line widths can be changed in the settings.
The EMA module provides a simple representation of medium-term and longer-term price direction.
A bullish EMA cross occurs when the Fast EMA crosses above the Slow EMA.
A bearish EMA cross occurs when the Fast EMA crosses below the Slow EMA.
The script can display small visual markers when these crosses occur and can generate corresponding alert conditions.
The EMA module should be treated as market context rather than as an independent entry system.
For example, a trader may choose to give more weight to bullish structural setups while the Fast EMA is above the Slow EMA and more weight to bearish setups while the opposite condition exists.
This is only one possible interpretation and is not enforced by the indicator.
MARKET STRUCTURE: SWING HIGH AND SWING LOW
Market structure is calculated using confirmed pivot highs and pivot lows.
The Swing Length setting determines how many bars are required on each side of a potential swing.
With the default Swing Length of 5, a pivot requires five bars to the left and five bars to the right before it can be confirmed.
This has an important consequence:
A swing point cannot be known at the moment the original high or low occurs.
It becomes confirmed only after the required number of right-side bars exists.
Therefore, historical swing locations must not be interpreted as signals that were available at the original swing bar.
The indicator uses these confirmed swings as reference levels for BOS and CHoCH detection.
BOS — BREAK OF STRUCTURE
A Break of Structure identifies a break of a previously confirmed swing level in the current structural direction.
Depending on the Structure Break Confirmation setting, a break can be confirmed using:
Close
or
Wick
When Close is selected, price must close beyond the swing level.
When Wick is selected, the high or low of the candle can confirm the break.
A bullish BOS represents a confirmed break above a relevant swing high while the internal structural direction is already bullish or has not previously established a bearish reversal condition.
A bearish BOS represents the corresponding break below a relevant swing low.
BOS should generally be interpreted as a structural continuation event rather than an automatic trade signal.
CHOCH — CHANGE OF CHARACTER
CHoCH is used to identify a possible change in structural direction.
A bullish CHoCH occurs when price breaks a confirmed swing high while the previously tracked structure was bearish.
A bearish CHoCH occurs when price breaks a confirmed swing low while the previously tracked structure was bullish.
This can help identify potential transitions between bearish and bullish structure.
A CHoCH does not guarantee a reversal.
Markets frequently produce temporary structural breaks before continuing in the previous direction.
For this reason, CHoCH is intended to be evaluated together with other information such as FVGs, EMA context, PVSRA activity and Footprint dominance.
IMPORTANT STRUCTURE DISPLAY BEHAVIOR
When a BOS or CHoCH occurs, the horizontal structure line begins at the historical swing that was broken and ends at the bar that confirmed the break.
The visual line therefore extends backward to the location of the swing.
This does NOT mean the BOS or CHoCH signal was known at the swing bar.
The actual structural event is confirmed only when the later candle breaks the swing according to the selected Close or Wick confirmation method.
This distinction is important when visually reviewing historical charts.
FAIR VALUE GAP — FVG
The indicator detects traditional three-candle Fair Value Gaps.
A Bullish FVG is detected when:
Current Low > High from two bars earlier
A Bearish FVG is detected when:
Current High < Low from two bars earlier
This represents a price range that was not overlapped by the first and third candles of the three-candle sequence.
The FVG is created only on a confirmed bar.
Users can optionally apply a minimum FVG size filter.
The minimum size can be expressed in:
Points
or
Ticks
This can be useful for reducing very small imbalances that may have limited analytical value on a particular instrument.
The appropriate minimum FVG size depends on the instrument, volatility and timeframe.
There is no universal value that works for every market.
FVG VISIBILITY
The indicator allows users to display:
All available FVGs
or
Only FVGs from the most recent configured number of hours.
The default historical window is 24 hours.
A maximum number of FVG objects is also enforced to protect chart performance and TradingView object limits.
IMPORTANT:
The current implementation does not automatically remove an FVG simply because price later trades through or mitigates the zone.
The displayed FVG therefore represents the historical detection of the imbalance, not necessarily an active or unmitigated trading zone.
2x FVG LOGIC
The 2x FVG module is more selective than simply counting any two Fair Value Gaps.
The script tracks FVGs of the same direction occurring within the configurable Max Bars Between FVG setting.
The default value is 5 bars.
If a new same-direction FVG overlaps the currently tracked FVG cluster, the indicator treats the gaps as part of the same broader imbalance structure.
The cluster boundaries are expanded when necessary.
A 2x FVG event is generated when another same-direction FVG appears within the allowed bar window but forms a separate, non-overlapping imbalance rather than simply extending the existing cluster.
Therefore:
Two overlapping bullish FVGs are not necessarily treated as a completed 2x Bullish FVG signal.
Two distinct bullish FVG structures occurring close together can generate the bullish 2x marker.
The same logic applies in the bearish direction.
When an opposite-direction FVG occurs, the previous same-direction cluster is reset.
This design attempts to distinguish between one extended imbalance and two separate displacement events.
HOW TO INTERPRET 2x FVG
A 2x FVG should not automatically be interpreted as an entry.
It indicates that price has created multiple distinct inefficiencies in the same direction over a relatively short sequence of candles.
For example:
Bullish market structure
+
price above the broader EMA context
+
bullish BOS
+
two separate bullish FVGs
+
strong bullish PVSRA activity
provides more contextual information than a single FVG alone.
However, the indicator does not assign a statistical probability of success to such a configuration.
Users should test the behavior on the specific instrument and timeframe they trade.
PVSRA / VECTOR CANDLES
The PVSRA module classifies candles according to volume and candle spread.
The default volume lookback period is 10 bars.
The script calculates the average volume over this lookback period.
The default Above Average threshold is:
150% of average volume
The default Climax threshold is:
200% of average volume
A candle can also qualify as a Climax candle through the Volume x Spread calculation.
Volume x Spread is calculated as:
Volume × (High - Low)
The script compares this value with the highest Volume x Spread value over the configured PVSRA lookback.
This allows unusually large volume combined with a wide candle range to be identified even when the simple volume threshold alone may not fully describe the event.
PVSRA CANDLE COLORS
By default, the PVSRA candle categories are displayed as:
Green:
Bullish 200% / Climax candle
Red:
Bearish 200% / Climax candle
Blue:
Bullish 150% Above Average candle
Purple:
Bearish 150% Above Average candle
Light Gray:
Regular bullish candle
Dark Gray:
Regular bearish candle
All colors can be modified by the user.
The bullish or bearish classification of the candle itself is determined by comparing its Open and Close.
A bullish candle has:
Close > Open
A bearish candle has:
Close <= Open
PVSRA SOURCE SYMBOL
By default, PVSRA calculations use the current chart symbol.
An optional Override PVSRA Source Symbol setting is available.
This allows the volume calculations to use another symbol or data feed.
This feature should be used carefully.
If the PVSRA source symbol is different from the chart symbol, the volume information no longer represents exactly the same instrument displayed on the chart.
The user is responsible for selecting a logically appropriate source.
WHAT A PVSRA CLIMAX MEANS
A Climax candle indicates unusually high activity relative to recent bars.
It does NOT automatically indicate reversal.
For example, a bullish Climax candle can represent:
Strong continuation buying
Aggressive participation during a breakout
Buying absorption
Late participation near the end of a move
or increased activity around an important level.
Context is therefore essential.
A high-volume candle is evidence of increased activity, not proof of the next market direction.
VOLUME FOOTPRINT BUY/SELL DOMINANCE
The Footprint module uses TradingView's volume footprint data.
For selected candles, the script retrieves:
Total Volume
Buy Volume
Sell Volume
Volume Delta
The script then calculates:
Buy % = Buy Volume / Total Volume × 100
Sell % = Sell Volume / Total Volume × 100
Delta % = Volume Delta / Total Volume × 100
where:
Volume Delta = Buy Volume - Sell Volume
IMPORTANT INFORMATION ABOUT BUY AND SELL VOLUME
The words BUY and SELL in the Footprint module refer to TradingView's volume footprint classification.
TradingView classifies lower-timeframe volume according to the direction of intrabar price movement.
This should not be interpreted as direct access to every participant's intentions, resting limit orders, or the complete exchange order book.
The indicator does NOT display DOM resting liquidity.
It does NOT show pending limit orders.
It does NOT identify how many individual traders are buying or selling.
It displays TradingView's calculated Buy and Sell footprint volume categories.
This distinction is important when interpreting the values.
FOOTPRINT DOMINANCE
The indicator compares Buy % and Sell %.
If the difference between the two sides is smaller than or equal to the Neutral Threshold, the candle is classified as NEUTRAL.
The default Neutral Threshold is 5 percentage points.
For example:
BUY = 52%
SELL = 48%
Difference = 4 percentage points
With a 5% Neutral Threshold, this candle is considered neutral.
Another example:
BUY = 67%
SELL = 33%
Difference = 34 percentage points
This candle is classified as BUY dominance.
The same logic applies to SELL dominance.
FOOTPRINT BUBBLES
Footprint information is displayed using bubbles near selected candles.
BUY dominance is displayed below the candle.
SELL dominance is displayed above the candle.
Neutral conditions are also displayed above the candle.
The bubble can contain:
BUY or SELL classification
Buy or Sell percentage
Volume Delta percentage
A detailed tooltip can additionally display:
Buy Volume
Sell Volume
Total Volume
Buy %
Sell %
Absolute Delta
Delta %
Dominance classification
Difference between Buy and Sell percentages
DYNAMIC BUBBLE SIZE
When Dynamic Bubble Size is enabled, stronger Buy/Sell differences can produce larger bubbles.
The bubble size is therefore a visual representation of the magnitude of the Buy/Sell dominance difference.
It should not be interpreted as a prediction of future price movement.
The script also uses a simple anti-collision system that assigns nearby bubbles to different visual lanes to reduce overlap.
FOOTPRINT VISIBILITY FILTER
Users can choose which candles receive Footprint bubbles.
Available modes are:
200% Climax only
150% + 200%
All candles
The default mode is 200% Climax only.
This is intentional.
Displaying Footprint statistics only around unusually active PVSRA candles can reduce visual noise and focuses the Footprint module on bars where volume participation is already elevated.
FOOTPRINT HISTORY
The indicator includes an option to limit Footprint bubble history to approximately the most recent hour.
This reduces chart clutter and helps manage the amount of footprint data used by the script.
The current implementation also restricts footprint calculations to a limited number of recent bars for memory efficiency.
As a result, the Footprint component is primarily intended as a recent intraday analysis tool rather than a long-term historical footprint database.
The availability and precision of Footprint data can also depend on the symbol, timeframe, available market data and TradingView account/data access.
FOOTPRINT ROW SIZE
Ticks Per Footprint Row controls the aggregation size used in the footprint request.
However, this indicator currently uses the overall Buy Volume, Sell Volume, Total Volume and Delta of each requested footprint.
It does not display every individual footprint price row.
It therefore should not be confused with a complete Footprint chart showing bid/ask-style information at every individual price level.
RSI CANDLE GRADIENT
The indicator also includes an optional RSI candle-coloring mode.
The default RSI length is 14.
The gradient transitions through several ranges:
Very low RSI
→ green
Lower RSI
→ green/yellow
Mid-range RSI
→ yellow/orange
Higher RSI
→ red
Extreme high RSI
→ dark red
The default Oversold and Overbought reference values are 30 and 70.
This module is designed primarily as an alternative momentum visualization.
IMPORTANT:
PVSRA candle coloring has priority over RSI candle coloring.
If PVSRA and RSI Gradient are both enabled, PVSRA colors are displayed.
To view the RSI candle gradient directly, disable PVSRA candle coloring.
ALERTS
The indicator provides alert conditions for:
2x Bullish FVG
2x Bearish FVG
Any 2x FVG
Bullish BOS
Bearish BOS
Any BOS
Bullish CHoCH
Bearish CHoCH
Any CHoCH
Any Structure Break
Bullish EMA Cross
Bearish EMA Cross
Any EMA Cross
Bullish PVSRA Climax candle
Bearish PVSRA Climax candle
Any PVSRA Climax candle
Master "Any Signal" condition
The script also includes a repeating alert engine using alert() calls.
Signals are evaluated using confirmed bars.
This means alerts are intended to trigger after the relevant candle has closed rather than continuously changing during the still-forming candle.
The current Footprint bubble itself is not included as a separate alert condition.
PRACTICAL WORKFLOW
One possible way to use the indicator is to begin with directional context.
First evaluate the position and relationship of EMA 50 and EMA 200.
Then evaluate the most recent confirmed BOS or CHoCH.
Next examine whether the displacement created one or more Fair Value Gaps.
A 2x FVG can indicate that multiple separate price inefficiencies have formed in the same direction.
PVSRA can then be used to determine whether the move occurred with unusually high volume or Volume x Spread activity.
Finally, the Footprint bubble can provide additional information about TradingView-classified Buy/Sell volume dominance inside the selected high-activity candle.
This creates a multi-layer confirmation process rather than relying on one isolated indicator.
EXAMPLE OF BULLISH CONFLUENCE
A trader may observe:
EMA context favoring the upside
Bullish BOS or bullish CHoCH
Bullish FVG structure
Bullish 2x FVG
Bullish PVSRA Climax candle
BUY-dominant Footprint statistics
This combination may justify further investigation of a bullish scenario.
It does NOT mean a long trade must be taken.
The same concept can be mirrored for bearish conditions.
DIVERGENCE BETWEEN PRICE AND FOOTPRINT
The Footprint module may also be useful when its information disagrees with the candle direction.
For example, price may close bullish while the Footprint statistics show stronger Sell classification.
Likewise, a bearish candle may contain strong classified Buy volume.
Such situations can indicate more complex interaction between price movement and volume participation.
They can be worth observing around:
previous highs or lows
liquidity areas
major support or resistance
BOS or CHoCH levels
FVG boundaries
session extremes
However, these relationships are contextual observations and are not automatically classified by this version of the indicator as absorption or reversal signals.
TIMEFRAMES AND MARKETS
The indicator is primarily designed for intraday use.
It can technically operate on multiple standard chart timeframes, but the meaning of each component changes with timeframe and market structure.
Short timeframes generate more structural events and more FVGs, but also more noise.
Higher timeframes produce fewer signals and generally larger structural zones.
Users should adjust:
Swing Length
Minimum FVG Size
Maximum Bars Between FVGs
PVSRA thresholds
Footprint settings
according to the volatility and tick size of the instrument being analyzed.
The default settings should be treated as starting values rather than universally optimized parameters.
Volume-dependent modules are most meaningful on markets where reliable volume data is available.
STANDARD CANDLESTICK CHARTS RECOMMENDED
The indicator is designed for use with standard time-based candlestick charts.
Using synthetic chart types such as:
Heikin Ashi
Renko
Kagi
Point & Figure
Range
or Line Break
can change the relationship between displayed OHLC values and actual market prices.
For structural or signal-based analysis, standard candlestick charts are recommended.
REPAINTING, CONFIRMATION AND HISTORICAL DISPLAY
The script intentionally uses confirmed candles for FVG, structure, EMA-cross and PVSRA signal events.
The PVSRA security request uses lookahead disabled.
However, users should understand the behavior of confirmed pivots.
A pivot high or pivot low requires future right-side bars before it becomes confirmed.
The structure line is then drawn starting from the historical pivot.
Therefore, the historical location of a swing does not mean the swing was known in real time at that original candle.
Likewise, a BOS/CHoCH line visually beginning at a previous swing does not mean the structure break occurred there.
The actual BOS or CHoCH event occurs only on the later bar that confirms the break.
This is normal pivot-based structure behavior and should be considered when reviewing historical charts.
LIMITATIONS
This indicator does not predict future market direction.
It does not provide guaranteed entries or exits.
It does not calculate Stop Loss or Take Profit levels.
It does not calculate risk or position size.
It does not execute trades.
FVG zones are not automatically removed after mitigation.
BOS and CHoCH depend on confirmed swing pivots and therefore include structural confirmation delay.
PVSRA identifies unusual volume activity but cannot determine the intention of market participants.
Footprint BUY and SELL statistics are based on TradingView's footprint volume classification and should not be confused with direct DOM order-book liquidity.
The Footprint module currently uses bar-level total Buy/Sell statistics rather than displaying the complete footprint ladder at every price level.
The availability and granularity of Footprint data depend on TradingView's available lower-timeframe data and market-data access.
Historical results should not be interpreted as evidence of future performance.
INTENDED USE
This indicator is intended as a discretionary market-analysis toolkit.
It is most useful when the trader evaluates the relationship between:
market direction
confirmed structure
price imbalance
volume expansion
and Buy/Sell volume distribution
rather than interpreting any single visual element as an automatic trading signal.
Users are encouraged to test the indicator on historical and real-time data, understand each component independently, and build their own risk-management rules before using the information in live trading. Indikator

Indikator

RSI + S/R + FVG + BOS + CHoCH SetupRSI + Support/Resistance + FVG + BOS + CHoCH
This indicator combines five popular technical analysis concepts into one structured market setup: RSI, Support & Resistance, Fair Value Gaps (FVG), Break of Structure (BOS), and Change of Character (CHoCH).
The goal is to identify higher-quality potential long and short setups by requiring multiple confirmations instead of relying on a single indicator.
How the Indicator Works
🟢 Long / BUY Setup
A bullish setup is generated when the following conditions align:
Support: Price is trading near a recent swing-low support area.
BOS / CHoCH: The market confirms bullish structural strength by breaking a previous swing high.
Bullish FVG: A bullish Fair Value Gap is detected or price returns into the latest bullish FVG.
RSI: RSI is above the configured bullish level, confirming bullish momentum.
When the required conditions are satisfied, the indicator displays a BUY signal.
Basic flow:
Support → Bullish BOS/CHoCH → Bullish FVG → RSI Confirmation → BUY
🔴 Short / SELL Setup
A bearish setup is generated when:
Resistance: Price is trading near a recent swing-high resistance area.
BOS / CHoCH: The market confirms bearish structural weakness by breaking a previous swing low.
Bearish FVG: A bearish Fair Value Gap is detected or price returns into the latest bearish FVG.
RSI: RSI is below the configured bearish level, confirming bearish momentum.
When the required conditions are satisfied, the indicator displays a SELL signal.
Basic flow:
Resistance → Bearish BOS/CHoCH → Bearish FVG → RSI Confirmation → SELL
Main Features
RSI Confirmation
Uses RSI to help determine whether bullish or bearish momentum is present. The RSI levels can be customized according to your trading style.
Support & Resistance
Recent swing highs and swing lows are used to identify potential resistance and support areas.
BOS — Break of Structure
Detects when price breaks an important recent swing high or swing low, helping identify continuation or structural changes.
CHoCH — Change of Character
Helps identify potential changes in market direction when price breaks structure against the previously established trend.
FVG — Fair Value Gap
Identifies three-candle price imbalances and displays bullish and bearish FVG zones directly on the chart.
Signal Window
The structure confirmation can remain valid for a configurable number of bars, allowing price time to return toward an FVG or key level.
Alerts
BUY and SELL alert conditions are included so you can create TradingView alerts when a setup is confirmed.
Recommended Usage
The indicator is designed to be used as a confluence-based confirmation tool, rather than as a standalone automatic trading system.
For example, a trader could wait for:
1. Price to approach support.
2. A liquidity reaction or market-structure shift.
3. Bullish BOS/CHoCH confirmation.
4. A bullish FVG to form or become available for a retracement.
5. RSI to confirm bullish momentum.
6. BUY signal to appear.
7. Stop-loss to be placed below the relevant swing/support.
8. Take-profit to be based on a predefined risk/reward ratio or the next major resistance/liquidity area.
The opposite process can be used for short trades.
Important Note
This indicator does not guarantee profitable trades. Market conditions, volatility, timeframe, spread, liquidity and execution can significantly affect results.
BOS, CHoCH, FVG, support/resistance and RSI are interpreted using predefined mathematical rules in the script. These definitions may differ from how individual traders manually identify them.
Always test the indicator on your preferred market and timeframe before using it with real money, and use appropriate risk management.
Best practice: combine the signals with higher-timeframe market structure, liquidity levels and disciplined risk management rather than taking every BUY or SELL signal automatically. Indikator

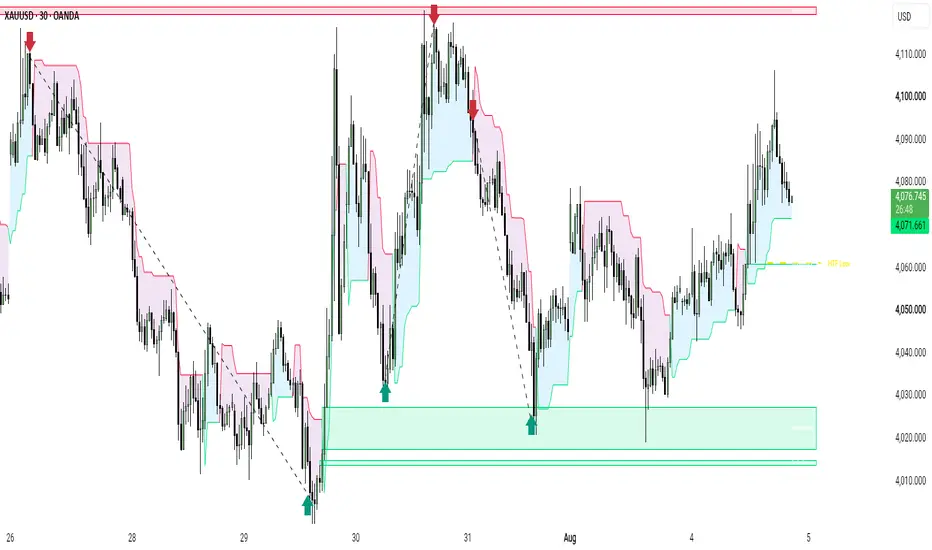
XAUUSD FVG Supertrend SignalsXAUUSD FVG Supertrend Signals
XAUUSD FVG Supertrend Signals is a clean technical analysis indicator designed for Gold (XAUUSD), combining Supertrend, EMA 200, and Fair Value Gap (FVG) concepts to identify potential BUY and SELL opportunities.
How It Works
The indicator looks for alignment between three key market concepts:
Supertrend — identifies the current market direction and helps filter bullish and bearish conditions.
EMA 200 — provides a broader trend filter. BUY setups are favored above the EMA, while SELL setups are favored below it.
Fair Value Gap (FVG) — identifies areas of potential imbalance that may act as important reaction zones.
When the trend, price position, and FVG conditions align, the indicator generates a visual BUY or SELL signal.
Target & Stop Levels
The indicator also displays projected target and stop levels for each signal.
Default settings:
Target: $40
Stop: $15
Risk/Reward: approximately 2.67:1
These values are adjustable and should be adapted to the trader's preferred risk management and market conditions.
Best Use
The indicator is designed primarily for XAUUSD and can be used on multiple timeframes.
It is recommended to combine the signals with:
Market structure
Support and resistance
Session timing
Higher-timeframe analysis
Proper risk management
The indicator should be treated as a technical analysis and decision-support tool, not as a guarantee of future market movement.
Important Disclaimer
No indicator can predict the market with certainty. BUY and SELL signals are based on historical price calculations and technical conditions and may produce false signals, especially during sideways markets, high-impact news, and unusual volatility.
Always perform your own analysis and use appropriate risk management. Past performance does not guarantee future results.
Key Features
✓ Supertrend trend detection
✓ EMA 200 trend filter
✓ Bullish & bearish FVG detection
✓ BUY / SELL signals
✓ Projected targets
✓ Stop levels
✓ TradingView alerts
✓ Designed for XAUUSD
✓ Fully adjustable settings
✓ No automatic trade execution Indikator

Intraday Master ProIntraday Master Pro is a high-precision trading script engineered to identify high-probability intraday opportunities by filtering momentum, volume, and multi-timeframe alignment into automated trade setups.
Key Features
Multi-Timeframe Trend Dashboard: Real-time alignment checks across the 1m, 5m, and 15m timeframes.
Dynamic Trend Flow Band: Visual volatility channels indicating overall market bias.
Precision Entry Signals: Volume-filtered entries based on EMA crossovers and RSI constraints.
Automated Risk Management: Dynamic Stop Loss (SL) and 3 Take Profit targets (TP1, TP2, TP3) anchored directly to active signal bars.
Setup Rating Score (1–100): Real-time setup scoring algorithm based on multi-timeframe concordance and volume strength.
How It Works
1. High-Precision Signals & Entry Conditions
The indicator issues BUY or SELL labels only when multiple conditions align:
Trend & Momentum: Fast and Slow EMA crossovers filtered by RSI.
Volume Confirmation: Spikes exceeding 1.25x the 20-period volume average.
Cooldown Guard: Built-in bar cooldown filters to prevent whipsaws during choppy consolidated markets.
2. Multi-Timeframe Dashboard & Setup Rating
Located on the right side of your chart, the dashboard updates live:
1m / 5m / 15m Trend Status: Green (BULL) or Red (BEAR) depending on price position relative to core moving averages.
Setup Rating (1 to 100): A live score grading the quality of the current setup.
80–100 (Green): High-confluence setup across all timeframes and volume.
60–79 (Orange): Moderate setup; proceed with standard risk.
Below 60 (Gray): Low confluence or weak trend.
3. Dynamic Stop Loss & Take Profit Levels
When a valid signal triggers, the indicator projects extended level lines onto your chart:
SL (Orange Line): Calculated dynamically using ATR based on recent market volatility.
TP1 (1.5x R:R): Partial profits / initial target.
TP2 (2.8x R:R): Main target.
TP3 (4.5x R:R): Extended runner target for strong trending days.
How to Use Intraday Master Pro
Wait for a Signal: Look for a clear BUY or SELL label on the chart.
Check Confluence: Glance at the Dashboard. Look for Setup Ratings of 80/100 or higher and alignment across 1m, 5m, and 15m timeframes for maximum statistical edge.
Set Orders: Place your Stop Loss at the SL line and split your position across TP1, TP2, and TP3.
Manage Risk: Once price reaches TP1, consider moving your Stop Loss to entry (Breakeven) to lock in a risk-free trade while riding the position to TP2 and TP3.
Settings & Configuration
Risk Management Inputs: Adjust Core Sensitivity or Volatility Factor to widen or tighten stop-loss distances based on the asset’s volatility.
Visuals: Toggle the Dashboard or Flow Band visibility on/off and customize accent colors to fit dark or light charts.
Disclaimer
The Intraday Master Pro indicator is designed strictly for educational and informational purposes and does not constitute financial, investment, or trading advice. Past performance is not indicative of future results. Trading equities, options, forex, and cryptocurrencies involves significant financial risk and can result in the loss of your capital. Always practice proper risk management and consult a licensed financial advisor before executing trades. Indikator

Indikator

EMA + RSI + VWAP Targets🚀 EMA + RSI + VWAP Trading Indicator | Smart Buy & Sell Signals
Trade with confirmation, not guesswork. 📊
This indicator combines EMA trend direction, RSI momentum, and VWAP price positioning into one clean trading system designed to help identify potential BUY and SELL opportunities.
🔥 Key Features:
🟢 BUY & 🔴 SELL signals
📈 EMA trend filter
⚡ RSI momentum confirmation
🎯 VWAP market positioning
🎯 Automatic Target 1, Target 2 & Target 3
🛑 Configurable Stop Loss
🔔 BUY/SELL alerts
👀 Clean and easy-to-read chart
⚙️ Customizable settings for different markets and timeframes
💡 How it works:
BUY signals look for bullish conditions when price is above the EMA and VWAP with RSI confirmation.
SELL signals look for bearish conditions when price is below the EMA and VWAP with RSI confirmation.
🎯 Multiple targets help you plan potential trade exits, while the configurable Stop Loss helps define risk.
Perfect for traders looking for a simple, confirmation-based approach across crypto, forex, stocks, and other markets.
⚠️ Disclaimer: This indicator is an analytical tool, not financial advice. No indicator can guarantee profits. Always use proper risk management and test the settings on your market and timeframe before trading live.
⭐ Like, follow, and share if you find this indicator useful! Indikator

24-hour Volumeoppock Curve Multi-Filter is a trend and momentum-based indicator designed to identify potential high-probability Long and Short opportunities. It combines the Coppock Curve with multiple confirmation filters to determine market bias and provides visual Entry, Stop Loss, TP1, TP2 and TP3 levels.
Use the indicator alongside market structure, support/resistance and price action for confirmation. It is designed as a decision-support and risk-management tool, not a guaranteed signal generator. Always apply proper risk management.
If you want, I can also write you a much more professional TradingView publication description with sections like “How It Works,” “Buy Conditions,” “Sell Conditions,” “Risk Management,” and “Settings,” tailored specifically to your script.
Indikator

ICT 15M Liquidity -> 5M Entry + PriceCT 15M Liquidity → 5M Entry Indicator
This indicator is designed to identify ICT-style trade setups by combining 15-minute liquidity confirmation with 5-minute execution timing.
The 15-minute timeframe is used to detect the higher-quality setup conditions. It looks for major liquidity such as Previous Day High/Low, Asia High/Low, London High/Low, and selected 15M/4H swing levels. Once price sweeps one of these liquidity levels, the indicator waits for a reclaim and then looks for displacement in the opposite direction.
After the 15M setup is confirmed, the script classifies the setup based on the strongest confirmation present:
iFVG — an opposing Fair Value Gap is invalidated and becomes an inverse FVG.
FVG — displacement creates a new Fair Value Gap in the direction of the trade.
DISP — liquidity sweep, reclaim, and displacement are present, but no qualifying iFVG or FVG is detected.
The 5-minute timeframe is then used for the actual execution. The indicator waits for a pullback after the 15M confirmation, identifies the relevant 5M market structure, and requires a body close through that structure to confirm the MSS.
The final signal is plotted at the actual 5-minute execution price, which is the close of the candle that confirms the entry.
The chart only displays the final signals:
BUY • iFVG — sell-side liquidity was swept, bullish displacement confirmed an iFVG, and a bullish 5M MSS triggered the entry.
BUY • FVG — sell-side liquidity was swept, bullish displacement created an FVG, and a bullish 5M MSS triggered the entry.
BUY • DISP — sell-side liquidity was swept and reclaimed, bullish displacement occurred, and a bullish 5M MSS confirmed the entry.
SELL • iFVG — buy-side liquidity was swept, bearish displacement confirmed an iFVG, and a bearish 5M MSS triggered the entry.
SELL • FVG — buy-side liquidity was swept, bearish displacement created an FVG, and a bearish 5M MSS triggered the entry.
SELL • DISP — buy-side liquidity was swept and reclaimed, bearish displacement occurred, and a bearish 5M MSS confirmed the entry.
The indicator is intended to be used on the 5-minute chart, while the 15-minute confirmation logic runs internally. It is designed to reduce random buy/sell signals by requiring liquidity to be taken first and then waiting for structural confirmation before identifying an execution. Indikator

RvDiv Regular Divergence (Daily)Rv-Div — Regular Divergence (Daily)
Rv-Div marks confirmed regular divergences on the daily chart and draws the line that connects them, so you can see the structure the signal is based on instead of trusting an arrow.
**What it does**
A bullish divergence is price making a lower low while the oscillator makes a higher low: price is still falling, but with less force behind it. A bearish divergence is the mirror image — a higher high in price against a lower high in the oscillator.
Rv-Div marks the exact candle that confirms the divergence, draws the line between the two pivots it used, and can fire an alert.
**The problem it solves**
Most divergence tools compare each new pivot against the immediately previous one. That works until a small wrinkle appears between the two lows that actually matter — and then the line gets drawn between the wrinkle and the new low instead of between the two real lows. The divergence you see on screen is not the one your eye would have drawn.
Rv-Div compares each new pivot against the last N pivots, not just the previous one, and keeps the one that forms a valid divergence. That is what the eye does: connect the two lows that matter, skipping the noise in between.
It also spends each anchor. Without that, one old pivot gets reused against every new pivot that appears, and you end up with several lines fanning out from the same point — the same divergence counted three or four times, which inflates any count you make of them. Here, once an anchor is used it is discarded along with everything older.
**Quality filters**
Not every pair of pivots deserves to be called a divergence. Four filters, all adjustable:
- Minimum price difference between the two extremes, measured in ATR, so it travels across symbols and volatility regimes instead of using a fixed percentage.
- Minimum difference between the two oscillator pivots.
- Both oscillator pivots on the correct side of zero.
- Minimum and maximum bar separation between the two pivots.
**Settings**
Three oscillators to choose from — Awesome Oscillator, MACD histogram, and a linear-regression momentum. All three are public-domain formulas.
The pivot definition (bars to the left and right), the quality filters, the two EMAs, the colours, the label size and the line width are all adjustable. The default values are the ones I use on the daily chart.
**How to use it**
Daily chart only. The indicator says so on screen if you load it on any other timeframe.
Set alerts to **Once per bar close**. A forming candle keeps changing until it closes, and a divergence is not confirmed until then.
**Dropping to a lower timeframe to confirm**
The signal is a daily signal, but you do not have to take it blind on the daily close. Once the daily marks the entry, drop to 4h and wait for a break of the local high followed by a pullback — or go from 4h down to 1h and look for the same thing. You give up a little of the move in exchange for not entering into a candle that is still falling.
This is deliberately not built into the indicator. It is a judgement call, and judgement calls belong to the trader, not to a script that has to work the same way on every symbol and every market.
**What it does not do**
It does not manage exits. It marks an entry candle and nothing else — no targets, no stops, no position sizing. Those decisions are yours.
It is not a standalone system. A divergence tells you that momentum is fading, not that the trend has turned. What you do with that information is where your own judgement goes.
**About the confirmation delay**
A pivot does not exist until the required bars have closed to its right, so the signal arrives with that delay. This is deliberate. Removing it would mean signalling on unconfirmed pivots, which look excellent in hindsight and vanish in real time.
Historical signals do not repaint: once a pivot is confirmed, it stays confirmed. The forming candle is the only thing that can change, which is why alerts should be set to bar close.
---
**Español**
Rv-Div marca divergencias regulares confirmadas en gráfico diario y dibuja la línea que las une, para que veas la estructura en la que se apoya la señal en lugar de fiarte de una flecha.
Una divergencia alcista es el precio haciendo un mínimo más bajo mientras el oscilador hace un mínimo más alto: sigue cayendo, pero con menos fuerza detrás. La bajista es la imagen espejo.
La diferencia con la mayoría de detectores de divergencia está en el trazado. Casi todos comparan cada pivote nuevo con el inmediatamente anterior, y en cuanto aparece una arruga entre los dos suelos que de verdad importan, la línea sale mal dibujada. Rv-Div compara contra los últimos N pivotes y se queda con el que forma la divergencia válida — que es lo que hace el ojo. Además consume cada ancla, así que un mismo pivote antiguo no se reutiliza una y otra vez generando varias líneas en abanico desde el mismo punto.
Cuatro filtros de calidad ajustables (diferencia mínima de precio en ATR, diferencia mínima del oscilador, ambos pivotes del lado correcto del cero, y separación mínima y máxima), tres osciladores a elegir, y todo el aspecto configurable.
Solo diario. Alertas configuradas como "Una vez por barra al cerrar".
**Bajar a una temporalidad menor para confirmar.** La señal es del diario, pero no hace falta tomarla a ciegas en el cierre diario. Cuando el diario marca la entrada, se puede bajar a 4h y esperar una ruptura del máximo local con su retroceso — o de 4h bajar a 1h y buscar lo mismo. Se cede un poco del movimiento a cambio de no entrar en una vela que todavía viene cayendo. Esto no está metido en el indicador a propósito: es criterio del operador, y el criterio no se le delega a un script que tiene que funcionar igual en todos los símbolos.
No gestiona salidas ni es un sistema completo: marca la vela de entrada y nada más. Una divergencia dice que el impulso se está agotando, no que la tendencia ya giró.
El retraso de confirmación es deliberado: un pivote no existe hasta que cierran las velas que lleva a su derecha. Quitarlo significaría señalar sobre pivotes sin confirmar, que se ven perfectos en el pasado y desaparecen en vivo. Las señales históricas no repintan. Indikator

Triple RSI Stochastic Hybrid MTF Smooth# Triple RSI + Stochastic Hybrid MTF — Smooth
## Overview
Triple RSI + Stochastic Hybrid MTF — Smooth is a multi-timeframe momentum oscillator designed to combine RSI and Stochastic information into a single adaptive Hybrid line.
The indicator displays up to three independent Hybrid oscillators:
* Hybrid 1 — Chart timeframe
* Hybrid 2 — Higher timeframe x5
* Hybrid 3 — Higher timeframe x15
Each Hybrid combines RSI and Stochastic momentum into one normalized 0–100 oscillator. Each Hybrid has its own independently configurable RSI length, Stochastic length, %K smoothing, RSI weighting, signal length, signal smoothing, signal method, timeframe, and MTF smoothing settings.
The goal is to make short-term momentum and higher-timeframe momentum visible in the same oscillator pane.
---
## What Does the Indicator Show?
The indicator displays three possible Hybrid momentum lines.
### Hybrid 1 — Chart Timeframe
Hybrid 1 is calculated on the selected chart timeframe.
It combines:
* RSI
* Stochastic price position
* Stochastic %K smoothing
* Adjustable RSI/Stochastic weighting
The default configuration is:
* RSI Length: 9
* Stochastic Length: 9
* %K Smoothing: 3
* RSI Weight: 50%
This means the Hybrid is initially composed of approximately 50% RSI and 50% Stochastic information.
The timeframe can be set independently through the Hybrid 1 timeframe input.
---
### Hybrid 2 — Higher Timeframe
Hybrid 2 retrieves the Hybrid calculation from a selectable higher timeframe using TradingView's `request.security()` mechanism.
The default timeframe is 5 minutes.
The resulting higher-timeframe Hybrid is then smoothed using the configurable MTF smoothing settings.
Default:
* Timeframe: 5 minutes
* RSI Length: 9
* Stochastic Length: 9
* %K Smoothing: 3
* RSI Weight: 50%
* MTF Smooth: 5
* MTF Smooth Method: EMA
This provides a higher-timeframe momentum reference without requiring a separate oscillator pane.
---
### Hybrid 3 — Higher Timeframe
Hybrid 3 works in the same way as Hybrid 2 but uses a higher timeframe.
The default timeframe is 15 minutes.
Default:
* Timeframe: 15 minutes
* RSI Length: 9
* Stochastic Length: 9
* %K Smoothing: 3
* RSI Weight: 50%
* MTF Smooth: 8
* MTF Smooth Method: EMA
Hybrid 3 is intended to provide a slower and broader momentum reference.
---
# How the Hybrid Is Calculated
The Hybrid is not a simple RSI and not a standard Stochastic.
First, an RSI value is calculated:
RSI = Relative Strength Index of the selected source.
A Stochastic component is then calculated from the selected source relative to the highest high and lowest low over the selected Stochastic length.
The Stochastic component is smoothed using the selected %K smoothing length.
The final Hybrid value is a weighted combination of the two:
Hybrid = RSI × RSI Weight + Stochastic × (1 − RSI Weight)
The RSI Weight input determines the balance between the two components.
For example:
* 100% RSI = RSI-dominant Hybrid
* 75% RSI = mostly RSI
* 50% RSI = balanced RSI/Stochastic Hybrid
* 25% RSI = mostly Stochastic
* 0% RSI = Stochastic-dominant Hybrid
This allows the oscillator to be adapted from a more RSI-oriented momentum tool to a more Stochastic-oriented momentum tool.
---
# Signal Lines
Each Hybrid has its own Signal line.
The Signal line is calculated from the corresponding Hybrid and can use:
* EMA
* SMA
* WMA
* RMA
Signal length and additional Signal smoothing can be adjusted independently for each Hybrid.
The Signal line acts as a momentum reference for the corresponding Hybrid.
A faster Signal setting produces more responsive crosses.
A slower Signal setting produces fewer but generally smoother crossings.
---
# Cross Dots
The colored dots identify crossings between a Hybrid line and its corresponding Signal line.
### Green / Bullish Dot
A bullish dot appears when the Hybrid moves from below or equal to the Signal line to above it.
This indicates that momentum has crossed upward relative to its Signal line.
### Red / Bearish Dot
A bearish dot appears when the Hybrid moves from above or equal to the Signal line to below it.
This indicates that momentum has crossed downward relative to its Signal line.
The cross detection is based directly on the difference between the Hybrid and Signal series:
Hybrid − Signal
A bullish cross occurs when this difference changes from zero/negative to positive.
A bearish cross occurs when the difference changes from zero/positive to negative.
The dots therefore respond directly to the current Hybrid and Signal settings.
---
# Momentum Levels
The oscillator uses a normalized 0–100 scale.
The default levels are:
* 0 — Extreme lower boundary
* 10 — Lower reference
* 30 — Oversold reference
* 50 — Midline / neutral reference
* 70 — Overbought reference
* 90 — Upper reference
* 100 — Extreme upper boundary
All levels are independently adjustable.
The 50 level can be used as the primary momentum balance line.
Above 50 generally means that the Hybrid is showing positive momentum.
Below 50 generally means that the Hybrid is showing negative momentum.
The 30 and 70 levels can be used as traditional oversold/overbought references.
The 10 and 90 levels provide additional extreme-zone information.
---
# How to Read the Three Hybrids Together
The main purpose of the three Hybrid lines is to compare momentum across different timeframes.
A simple interpretation is:
### Bullish Momentum Alignment
When:
* Hybrid 1 is above its Signal
* Hybrid 2 is above its Signal
* Hybrid 3 is above its Signal
momentum is aligned positively across the three selected timeframes.
This can be used as confirmation for long setups.
### Bearish Momentum Alignment
When:
* Hybrid 1 is below its Signal
* Hybrid 2 is below its Signal
* Hybrid 3 is below its Signal
momentum is aligned negatively across the three selected timeframes.
This can be used as confirmation for short setups.
### Pullback Environment
A common use is to wait for the higher-timeframe Hybrids to maintain their direction while the lower-timeframe Hybrid temporarily moves against them.
For example:
Higher timeframes remain bullish:
* Hybrid 3 > Signal 3
* Hybrid 2 > Signal 2
while Hybrid 1 temporarily falls below Signal 1.
If Hybrid 1 then crosses back above Signal 1, the cross can be interpreted as a potential momentum re-entry trigger in the direction of the higher-timeframe momentum.
The opposite logic can be applied for short setups.
---
# Example Long Setup
One possible momentum-based workflow:
1. Check Hybrid 3 for the broader momentum direction.
2. Check Hybrid 2 for intermediate momentum confirmation.
3. Prefer long setups when both higher-timeframe Hybrids are above their Signals.
4. Wait for Hybrid 1 to pull back.
5. Look for Hybrid 1 to cross back above Signal 1.
6. A green Hybrid 1 cross dot marks the momentum crossover.
7. Additional confirmation can come from the 50 level or from price structure.
8. The actual trade entry, stop loss and position size should be determined using the trader's own risk-management rules.
The indicator itself does not place trades.
---
# Example Short Setup
The inverse workflow can be used for short setups:
1. Check Hybrid 3 for broader bearish momentum.
2. Check Hybrid 2 for intermediate bearish momentum.
3. Prefer short setups when both higher-timeframe Hybrids are below their Signals.
4. Wait for Hybrid 1 to rally against the higher-timeframe direction.
5. Look for Hybrid 1 to cross back below Signal 1.
6. A red Hybrid 1 cross dot marks the bearish momentum crossover.
7. Additional confirmation can come from the 50 level or price structure.
8. Apply independent risk-management rules before entering a trade.
---
# Using the 50 Level
The 50 level can be used as a neutral momentum filter.
### Above 50
The Hybrid is in the upper half of its normalized range.
This can support a bullish momentum interpretation, particularly when the Hybrid is also above its Signal.
### Below 50
The Hybrid is in the lower half of its normalized range.
This can support a bearish momentum interpretation, particularly when the Hybrid is also below its Signal.
A stronger momentum condition can therefore be defined by combining:
Direction + Signal Cross + 50-Level Position.
For example:
Bullish:
Hybrid > Signal and Hybrid > 50
Bearish:
Hybrid < Signal and Hybrid < 50
This is a confirmation framework, not a guaranteed trading signal.
---
# Using the 30 and 70 Levels
The 30 and 70 levels provide additional momentum context.
A move below 30 can indicate that momentum has entered a relatively weak or oversold area.
A move above 70 can indicate that momentum has entered a relatively strong or overbought area.
These levels should not automatically be interpreted as reversal signals.
A strong trend can remain above 70 or below 30 for an extended period.
Therefore, the direction of the Hybrid, its Signal relationship, and the higher-timeframe Hybrids should be considered together.
---
# Recommended Multi-Timeframe Workflow
For short-term trading, a practical configuration is:
Chart timeframe:
1 minute
Hybrid 1:
1 minute
Hybrid 2:
5 minutes
Hybrid 3:
15 minutes
This creates a three-layer momentum structure:
1-minute = execution momentum
5-minute = intermediate momentum
15-minute = higher-timeframe momentum
The lower timeframe can be used for timing while the higher timeframes provide directional context.
For example:
15M bullish → 5M bullish → wait for 1M pullback → 1M bullish Signal cross → potential long setup.
The inverse can be used for short setups.
---
# What Information Does the Indicator Use?
The indicator primarily uses price-derived information.
The Hybrid calculation uses:
* Selected price source
* RSI
* Highest high over the Stochastic lookback
* Lowest low over the Stochastic lookback
* Stochastic calculation
* Stochastic smoothing
* RSI/Stochastic weighting
The Signal calculation uses the resulting Hybrid series.
The MTF versions retrieve the Hybrid calculation from their selected higher timeframe using TradingView's `request.security()` functionality.
The indicator does not directly use:
* Order flow
* Level 2 data
* Bid/ask volume
* Market profile
* Fundamental data
* News
* Economic calendar data
* Open interest
* Institutional positioning
It is a price-derived momentum oscillator.
---
# What the Indicator Is Designed For
This indicator is designed primarily for:
* Momentum analysis
* Multi-timeframe momentum comparison
* Pullback identification
* Momentum crossover timing
* Trend-direction confirmation
* Short-term and intraday trading analysis
It can be used on different markets and timeframes, but parameter optimization should be performed for the specific instrument and trading timeframe.
---
# Important Interpretation
A cross dot does not automatically mean "buy" or "sell."
A bullish cross means that the Hybrid has crossed above its Signal.
A bearish cross means that the Hybrid has crossed below its Signal.
The quality of a setup depends on the surrounding market structure, timeframe alignment, volatility, trend conditions and risk management.
A stronger approach is to treat the dots as momentum timing information rather than standalone trade signals.
---
# Example Confirmation Framework
### Long Bias
Prefer long setups when:
* Hybrid 3 > Signal 3
* Hybrid 2 > Signal 2
* Price structure supports an upside move
* Hybrid 1 pulls back
* Hybrid 1 crosses back above Signal 1
* Hybrid 1 is preferably above or recovering through 50
### Short Bias
Prefer short setups when:
* Hybrid 3 < Signal 3
* Hybrid 2 < Signal 2
* Price structure supports a downside move
* Hybrid 1 rallies into the pullback
* Hybrid 1 crosses back below Signal 1
* Hybrid 1 is preferably below or falling through 50
This approach uses the higher-timeframe Hybrids for directional context and the lower-timeframe Hybrid for timing.
---
# Important Limitations
This indicator is an analytical tool and does not predict future prices with certainty.
Higher-timeframe values are obtained using TradingView's multi-timeframe data functionality. The behavior of higher-timeframe values can differ from lower-timeframe calculations, particularly while the higher-timeframe candle is still forming.
Cross dots represent mathematical momentum crossings. They are not guaranteed entry signals and should not be interpreted as guaranteed profitable trades.
No indicator can eliminate market risk.
Always evaluate price structure, volatility, liquidity, spread, execution conditions and position sizing before entering a trade.
---
## Summary
Triple RSI + Stochastic Hybrid MTF — Smooth combines RSI and Stochastic momentum into three configurable multi-timeframe Hybrid oscillators.
The core concept is:
**Higher Timeframe Direction → Lower Timeframe Pullback → Signal Cross → Momentum Confirmation**
Hybrid 3 provides the broadest momentum context.
Hybrid 2 provides intermediate momentum context.
Hybrid 1 provides the most responsive momentum information for timing.
The colored cross dots identify changes in the relationship between each Hybrid and its Signal line.
The 50 level provides a neutral momentum reference, while the 30/70 and 10/90 levels provide additional context for weak, strong and extreme momentum conditions.
The indicator is intended to support discretionary technical analysis, not to function as an autonomous trading system.
Indikator

Pipstorm & SessionsThis indicator is designed to help traders identify the behavior of price during the major forex trading sessions: Asian, London, New York AM, and New York PM.
It automatically highlights each trading session on the chart, making it easy to analyze session ranges, volatility, and market structure.
Key Features
Automatically marks Asian, London, NY AM, and NY PM sessions.
Displays each session's trading range with colored boxes.
Helps identify session highs and lows.
Useful for spotting liquidity grabs, breakouts, and reversals.
Supports Smart Money Concepts (SMC), ICT, and price action trading strategies.
Clean and simple visual layout for better chart analysis.
How It Can Be Used
Trade London breakouts after the Asian session.
Identify New York reversals and continuation setups.
Monitor liquidity above session highs and below session lows.
Improve entry and exit timing using session-based market behavior.
Suitable for Gold (XAU/USD), Forex pairs, and major indices.
Best Timeframes
Works effectively on M5, M15, M30, and H1 charts.
Disclaimer
This indicator is an analytical tool and should be used alongside proper risk management and market confirmation. It does not guarantee profitable trades. Indikator

Premium VWAP Bands Long Short# Premium Session VWAP Bands — Long / Short Trend
## Overview
Premium Session VWAP Bands is a minimalist trend-direction indicator designed to provide an immediate visual reading of the current intraday market bias.
The indicator uses only:
* Session VWAP
* VWAP slope
* Price position relative to VWAP
* Standard-deviation bands
It does not use RSI, MACD, moving averages, ATR, ADX, SuperTrend, order flow, volume profile, fair value gaps, or Smart Money Concepts.
The main objective is simplicity. A trader should be able to look at the chart and identify one of three market states:
* LONG
* SHORT
* NEUTRAL
The current state is communicated through a subtle chart background and a compact information panel in the upper-right corner.
This is an indicator, not a strategy. It does not place orders, calculate position size, provide automatic entries, or generate backtest results.
---
## Core VWAP Calculation
The central gold line represents the session VWAP.
VWAP stands for Volume Weighted Average Price. It measures the average traded price while assigning greater weight to prices where more volume occurred.
The VWAP calculation resets at the beginning of each new trading day. This makes the indicator primarily suitable for intraday analysis.
The session VWAP acts as the main directional reference:
* Price above VWAP indicates that the market is trading above the session’s volume-weighted average.
* Price below VWAP indicates that the market is trading below the session’s volume-weighted average.
* Price moving repeatedly around VWAP usually indicates balance, consolidation, or an unclear directional advantage.
The VWAP line is intentionally more prominent than the bands and uses a matte-gold color by default.
---
## VWAP Bands
The indicator displays one upper band and one lower band around VWAP.
The bands are calculated using standard deviation and are designed to show how far price has moved away from the session VWAP.
The default Band Multiplier is:
1.0
A lower multiplier creates narrower bands and makes them more sensitive to smaller price movements.
A higher multiplier creates wider bands and highlights more significant price extensions.
The bands should not automatically be interpreted as buy or sell signals.
For example:
* A touch of the Upper Band does not automatically mean that price should reverse downward.
* A touch of the Lower Band does not automatically mean that price should reverse upward.
During a strong trend, price may remain near or outside one band for an extended period.
The bands are best used to evaluate:
* Price extension from VWAP
* Pullbacks toward the session average
* Trend continuation conditions
* Potential mean-reversion areas
* The current structure of intraday volatility
---
# Background Trend Logic
The background is the primary directional feature of the indicator.
It uses three possible states:
* Green background: LONG
* Red background: SHORT
* No background: NEUTRAL
The background is intentionally highly transparent so that candles, drawings, levels, and price action remain clearly visible.
The default transparency is 91%.
---
## Green Background — LONG Trend
The chart background becomes dark green only when all required LONG conditions are confirmed.
A LONG state requires:
1. The current price to close above VWAP.
2. VWAP to be higher than it was on the previous bar.
3. The calculated VWAP slope to be positive.
4. Price to remain clearly above the internal neutral zone around VWAP.
5. The bar to be closed and confirmed.
In simplified terms:
Price is above a rising VWAP.
The green background indicates a bullish intraday environment in which long setups may be given priority over short setups.
It does not mean that a trader should immediately enter a long position when the background turns green.
A more conservative approach is to wait for:
* A pullback toward VWAP
* A successful rejection of VWAP
* A higher low
* A bullish candle confirmation
* A breakout followed by continuation
* Confluence with the trader’s existing market structure analysis
The green background should therefore be treated as a directional filter rather than an automatic entry signal.
### Example LONG interpretation
When the background is green:
* Long setups are aligned with the current VWAP direction.
* Countertrend short positions carry additional risk.
* Pullbacks toward VWAP may provide more favorable locations than buying after an extended move.
* Price remaining above a rising VWAP supports the continuation of the bullish state.
The LONG state remains active only while the required conditions continue to be satisfied.
---
## Red Background — SHORT Trend
The chart background becomes dark red only when all required SHORT conditions are confirmed.
A SHORT state requires:
1. The current price to close below VWAP.
2. VWAP to be lower than it was on the previous bar.
3. The calculated VWAP slope to be negative.
4. Price to remain clearly below the internal neutral zone around VWAP.
5. The bar to be closed and confirmed.
In simplified terms:
Price is below a falling VWAP.
The red background indicates a bearish intraday environment in which short setups may be given priority over long setups.
It does not mean that a trader should immediately enter a short position when the background turns red.
A more conservative approach is to wait for:
* A pullback toward VWAP
* A rejection below VWAP
* A lower high
* A bearish candle confirmation
* A breakdown followed by continuation
* Confluence with the trader’s existing market structure analysis
The red background should be treated as a directional filter rather than an automatic entry signal.
### Example SHORT interpretation
When the background is red:
* Short setups are aligned with the current VWAP direction.
* Countertrend long positions carry additional risk.
* Pullbacks toward VWAP may provide better locations than selling after an extended decline.
* Price remaining below a falling VWAP supports the continuation of the bearish state.
The SHORT state remains active only while the required conditions continue to be satisfied.
---
## No Background — NEUTRAL Trend
When neither the LONG nor SHORT conditions are fully satisfied, the indicator changes to the NEUTRAL state.
The background is then completely removed.
A NEUTRAL state may occur when:
* VWAP is flat or nearly flat.
* Price is too close to VWAP.
* Price is above VWAP while VWAP is falling.
* Price is below VWAP while VWAP is rising.
* Price repeatedly crosses VWAP.
* The market is consolidating.
* Directional conditions are conflicting.
* The session has just started and insufficient VWAP information is available.
The indicator uses a small internal neutral zone around VWAP. This zone is equal to 5% of the current distance between VWAP and the Upper Band.
Its purpose is to prevent very small movements directly around VWAP from being immediately classified as LONG or SHORT.
When price remains inside this area, the state stays NEUTRAL even if price is marginally above or below VWAP.
This helps reduce rapid background switching when the market is balanced around its session average.
A NEUTRAL state should not automatically be interpreted as a reversal signal. It means only that the indicator does not currently detect a sufficiently clear directional alignment.
---
# Trend Information Panel
A compact panel appears in the upper-right corner of the chart.
It displays one of three values:
* Trend: LONG
* Trend: SHORT
* Trend: NEUTRAL
The panel uses:
* Green text for LONG
* Red text for SHORT
* Gray text for NEUTRAL
The panel is intended to provide a clear trend reading without adding unnecessary statistics or visual clutter.
It can be disabled in the indicator settings.
---
# Alert Conditions
The indicator includes three alert conditions:
## LONG Trend Activated
Triggered when the confirmed trend state changes from SHORT or NEUTRAL to LONG.
The alert is generated only when a closed bar confirms that:
* Price is above VWAP
* VWAP is rising
* Price is outside the neutral zone
## SHORT Trend Activated
Triggered when the confirmed trend state changes from LONG or NEUTRAL to SHORT.
The alert is generated only when a closed bar confirms that:
* Price is below VWAP
* VWAP is falling
* Price is outside the neutral zone
## Neutral Trend
Triggered when the confirmed trend state changes from LONG or SHORT to NEUTRAL.
This may indicate that:
* Trend momentum has weakened
* Price has returned toward VWAP
* VWAP has flattened
* Price and VWAP direction are no longer aligned
Alerts trigger only when the state changes. They do not repeat on every bar while the same state remains active.
For the most consistent behavior, alerts should be configured using:
Once Per Bar Close
---
# Suggested Use on the 2-Minute Timeframe
The indicator was designed primarily for the 2-minute timeframe, especially for intraday markets such as index futures.
On a 2-minute chart, the indicator can be used as a directional filter:
## During a LONG state
Traders may focus on:
* Pullbacks toward VWAP
* Bullish reactions above VWAP
* Higher-low formations
* Continuation after consolidation
* Long setups that agree with the session direction
## During a SHORT state
Traders may focus on:
* Pullbacks toward VWAP
* Bearish reactions below VWAP
* Lower-high formations
* Continuation after consolidation
* Short setups that agree with the session direction
## During a NEUTRAL state
Traders may consider:
* Waiting for clearer directional alignment
* Reducing trade frequency
* Avoiding repeated entries around VWAP
* Monitoring for a confirmed transition into LONG or SHORT
Because the 2-minute timeframe contains significant market noise, the indicator should not be used as a standalone entry system.
It is better suited to filtering direction while entries are determined using price action, market structure, support and resistance, risk management, or another independently tested method.
---
# Recommended Starting Settings
For a standard 2-minute intraday chart:
* Show VWAP: Enabled
* Show Bands: Enabled
* Band Multiplier: 1.0
* Enable Background: Enabled
* Background Transparency: 91
* Show Trend Panel: Enabled
Possible Band Multiplier adjustments:
* 0.8: Narrower and more sensitive bands
* 1.0: Balanced default setting
* 1.2–1.5: Wider bands showing more significant price extension
There is no universal setting that will perform equally well on every instrument or market condition. Parameters should be evaluated separately for the selected symbol, session, and trading style.
---
# Best Market Conditions
The indicator is generally easier to interpret when:
* The market has a clear intraday direction.
* VWAP has a visible positive or negative slope.
* Price remains consistently on one side of VWAP.
* Pullbacks are orderly.
* Trading volume and liquidity are sufficient.
* The market has moved out of an earlier consolidation.
The indicator may become less useful when:
* VWAP is nearly flat.
* Price crosses VWAP repeatedly.
* The market is moving sideways.
* Liquidity is low.
* Price action is highly erratic.
* Major economic news creates extreme short-term volatility.
* A new trading session has only recently started.
---
# Important Limitations
This indicator does not predict future price movements.
A green background does not guarantee that price will continue rising.
A red background does not guarantee that price will continue falling.
VWAP and its slope are calculated from existing price and volume data. As market conditions change, the trend state can also change.
The indicator does not include:
* Entry signals
* Stop-loss levels
* Take-profit levels
* Position sizing
* Risk-to-reward calculations
* Trade management
* Performance statistics
* Strategy backtesting
Users remain responsible for defining their own entry criteria, exit criteria, risk limits, session selection, and position size.
---
# Repainting and Calculation Behavior
The indicator does not use future data, look-ahead settings, or higher-timeframe security requests.
Trend states and alerts are confirmed only after the current candle closes.
Once a historical candle has closed, its confirmed trend state does not change because of later price data.
During the formation of a live candle, the VWAP line and bands may naturally move as price and volume update. However, a new confirmed LONG, SHORT, or NEUTRAL state is registered only at the candle close.
This design helps prevent alerts from being generated by temporary intrabar movements.
---
# Summary
Premium Session VWAP Bands is designed for traders who want a clean and immediate view of intraday direction without using multiple overlapping indicators.
Its interpretation is intentionally simple:
* Green background: price is above a rising VWAP
* Red background: price is below a falling VWAP
* No background: directional conditions are unclear or neutral
The indicator is best used as a trend-direction filter and market-context tool. It should be combined with independently tested entry rules and appropriate risk management.
This indicator is provided for informational and educational purposes only. It does not constitute financial advice or a recommendation to buy or sell any financial instrument.
Indikator

Indikator

Indikator

Indikator

Indikator

Bill Williams: Alligator, Fractals, AO, AC, BW MFI, BDB# Bill Williams Chaos System — Alligator • Fractals • AO • AC • BW MFI • BDB
A complete Bill Williams inspired trading toolkit combining market structure, momentum, volume analysis and price behavior into one indicator.
This indicator is designed to help traders analyze the market through the principles of **Trading Chaos** by combining several key elements:
### 🐊 Alligator
The indicator includes the Bill Williams Alligator with Jaw, Teeth and Lips lines to identify market phases:
* Sleeping market (low activity)
* Awakening phase
* Trend development
* Trend continuation
The Alligator is also used as a filter for signal confirmation, helping avoid trades against the current market structure.
### 🔺 Fractals
Classic Bill Williams fractals are included to identify potential breakout levels and important swing points.
Fractals can help traders:
* Detect local highs and lows
* Identify breakout areas
* Understand market structure
### 🌈 Awesome Oscillator (AO)
AO momentum analysis with:
* Zero line crossing signals
* Saucer signals
* Alligator confirmation filter
Signals are generated only when price position agrees with the Alligator structure.
### 💎 Accelerator Oscillator (AC)
AC measures the acceleration and deceleration of momentum.
Included signals:
* Momentum continuation
* Counter-trend acceleration setups
* Filtered signals to reduce noise
### 📊 Bill Williams Market Facilitation Index (BW MFI)
Volume and price range analysis based on Bill Williams' Market Facilitation concept.
The indicator highlights four market states:
🟢 Green — volume and range increase (strong market participation)
🔵 Blue — range increases while volume decreases (possible continuation)
🩷 Pink — volume increases while range decreases (possible battle between buyers and sellers)
🟤 Brown — low activity / market pause
### 🔥 BDB (Divergent Bar Behavior)
Price action analysis based on bar location and relationship with the Alligator.
Detects:
* Strong bullish and bearish bars
* Weak divergent bars
* Market exhaustion behavior
Signals are filtered using Alligator positioning to improve quality.
### 📌 PB Signals (Price Behavior)
Additional price behavior signals based on:
* Candle position inside its range
* Relationship with the Alligator Teeth line
* Strong directional candle structure
Designed to highlight candles showing possible continuation behavior.
---
## Indicator Philosophy
This script combines:
* Market structure
* Momentum
* Volume
* Price action
* Trend confirmation
The goal is not to predict the market, but to help traders recognize current market conditions and make decisions using multiple confirmations.
⚠️ This indicator is an analytical tool and does not provide guaranteed buy or sell signals. Always combine signals with risk management and your own market analysis.
Created by OlekBard
Indikator

ATLAS AI Trade Mentor PRO v0.31ATLAS AI Trade Mentor PRO v0.31
ATLAS AI Trade Mentor PRO is an advanced Pine Script v6 indicator system designed to combine trend tracking, market structure analysis, momentum evaluation, and dynamic risk management into a unified AI-driven scoring engine.
It aims to filter out market noise, prevent false signals, and provide clean trade execution opportunities for both discretionary traders and algorithmic trading strategies.
🚀 Key Features
1. Trend & Momentum Scoring Engine
The indicator relies on a multi-dimensional logic rather than a single technical tool:
Trend Engine: Calculates a Trend Score (0 to 100) based on 20, 50, and 200 EMA slopes, moving average alignment, and ATR-based volatility channels.
Momentum & Volume: Integrates RSI and MACD confluence alongside volume spikes and volatility expansion to refine signal confidence.
Smart Score: Generates actionable BUY / SELL signals only when the threshold score (default: 65) is exceeded.
2. Market Structure Engine (BOS & CHOCH)
Pivot Swing Detection: Automatically identifies key swing highs and swing lows (HH, HL, LH, LL).
BOS (Break of Structure): Highlights trend continuation breaks directly on the chart.
CHOCH (Change of Character): Detects early structural trend shifts.
3. Automated Risk & Position Management
Dynamic Stop Loss / Take Profit: Calculates exact TP1, TP2, and Stop Loss levels dynamically upon trade entry.
ATR Trailing Stop: Protects accrued profits by trailing active trends.
Break-Even System: Moves the stop price to entry automatically once favorable price targets are hit.
4. Webhook & Automated Trading Ready
JSON Webhook Payload: Built-in JSON formatting makes it fully compatible with external brokerage APIs and automated execution bots.
Uses the modern alert() framework to send dynamic BUY, SELL, and EXIT payloads bar-by-bar.
5. On-Screen Live Dashboard
Includes a clean, transparent on-screen dashboard displaying:
Primary Trend Direction (BULL / BEAR / SIDE)
Long and Short Final Smart Scores
Confidence Level & Risk Assessment
AI Mentor: Real-time contextual trade advice (e.g., "SELL AFTER PULLBACK").
⚙️ How to Use
Recommended Timeframes: Best performance is achieved on 15m, 30m, and 1h timeframes.
Asset Compatibility: Compatible with equities, index futures, forex parities, and crypto assets.
Customization: Parameters like Minimum Signal Score, ATR Multipliers, and TP/SL percentages can be adjusted via the Inputs panel.
⚠️ Disclaimer:
This indicator is built strictly for educational and technical analysis purposes. It does not constitute financial or investment advice. Always backtest against your personal risk parameters before live execution. Indikator

Institutional Adaptive VWAP Trend Ribbon ProInstitutional Adaptive VWAP Trend Ribbon Pro
Overview
Institutional Adaptive VWAP Trend Ribbon Pro is an advanced institutional trend-following indicator built from the ground up in Pine Script® Version 6 for traders who want a cleaner understanding of market structure, directional momentum, trend continuation, and potential reversal zones without relying on multiple separate indicators.
Unlike traditional moving averages or standard trend indicators that react slowly to changing market conditions, this indicator combines an Adaptive VWAP Engine, Dynamic Volatility Analysis, Institutional Trend Ribbon, Adaptive ATR Trail, Momentum Evaluation, Trend Strength Scoring, and Smart Confirmation Filters into one unified trading framework.
The primary objective of this indicator is to simplify complex market information into an easy-to-read institutional trend ribbon that visually highlights bullish, bearish, and neutral market conditions while automatically identifying trend transitions and momentum changes.
The indicator is suitable for traders who prefer price action combined with adaptive market analysis rather than fixed moving averages or lagging trend systems.
Why This Indicator Was Developed
Financial markets constantly change their volatility, liquidity, and momentum characteristics. Traditional trend indicators usually operate using fixed calculations, making them less effective during changing market environments.
This indicator was specifically developed to solve several common problems faced by traders:
• Late trend entries
• Frequent false trend reversals
• Choppy market conditions
• Lack of institutional trend visualization
• Difficulty identifying trend strength
• Poor volatility adaptation
• Multiple indicators creating chart clutter
Instead of using several different indicators simultaneously, Institutional Adaptive VWAP Trend Ribbon Pro combines multiple adaptive calculations into a single visual framework.
The result is a cleaner chart while maintaining a large amount of market information.
Core Concept
The indicator continuously evaluates price relative to an Adaptive VWAP while simultaneously measuring volatility, momentum, trend persistence, deviation expansion, and directional strength.
Instead of asking only:
"Is price above or below a moving average?"
the indicator asks a much more advanced question:
"Is there enough institutional evidence to consider this trend healthy, sustainable, and worth following?"
Only after evaluating multiple market conditions does the trend ribbon update its state.
Adaptive VWAP Engine
The heart of this indicator is its Adaptive VWAP Engine.
Instead of relying on only one fixed VWAP calculation, the user may choose different operating modes including:
• Rolling Bars
• Rolling Days
• Daily VWAP
• Weekly VWAP
• Monthly VWAP
Each mode allows the indicator to adapt to different trading styles.
Scalpers may prefer shorter rolling calculations.
Swing traders may choose weekly or monthly anchored VWAP calculations.
This flexibility allows the indicator to remain useful across multiple market environments.
Adaptive Deviation System
Markets constantly expand and contract.
Using fixed-width bands often creates misleading signals during high or low volatility periods.
To solve this issue, the indicator dynamically measures market deviation while simultaneously protecting the band width using ATR.
This prevents the ribbon from collapsing during quiet markets while also allowing it to naturally expand during high volatility periods.
The adaptive deviation envelope therefore reflects actual market conditions rather than static calculations.
Institutional Trend Trail
The indicator continuously builds an adaptive trailing trend line using volatility-adjusted calculations.
Unlike simple ATR trails, this trail automatically adjusts its distance according to current market strength.
During strong trends:
• Trail becomes tighter
• Trend reacts faster
• Pullbacks remain inside the ribbon
During weak trends:
• Trail widens
• Noise is filtered
• False reversals become less frequent
This adaptive behaviour helps create smoother trend transitions.
Institutional Trend Ribbon
One of the most recognizable visual components of the indicator is the Institutional Trend Ribbon.
Instead of drawing a single colored line, the indicator creates multiple gradient layers which produce a professional ribbon effect.
The ribbon changes dynamically according to market conditions.
Green Ribbon
Represents bullish market conditions.
The brighter the ribbon becomes, the stronger the bullish trend.
Red Ribbon
Represents bearish market conditions.
Increasing ribbon intensity indicates strengthening bearish momentum.
Neutral Ribbon
When trend strength becomes weak, the ribbon automatically switches into a neutral state to indicate uncertainty.
This helps traders avoid forcing trades during low-quality market conditions.
Adaptive Glow System
The glow surrounding the ribbon is not simply cosmetic.
Its size automatically changes according to:
• Trend strength
• Volatility
• Momentum
• Recent trend flips
Strong institutional trends produce a wider and brighter glow.
Weak trends produce a smaller glow.
This provides additional visual confirmation without adding chart clutter.
Institutional Trend Strength Engine
One of the most advanced parts of this indicator is its internal Trend Strength Engine.
Rather than using a single measurement, the indicator evaluates multiple market characteristics including:
• Price position relative to VWAP
• VWAP slope
• Price momentum
• Distance from adaptive trail
• Band participation
• ATR expansion
• Trend persistence
• Price velocity
• Volatility regime
These components are combined into a normalized strength score ranging from 0 to 100.
Higher scores indicate stronger institutional participation.
Lower scores indicate weakening momentum or sideways conditions.
Smart Confirmation Filters
Before generating confirmed trend signals, the indicator can evaluate several optional confirmation filters.
These include:
• VWAP confirmation
• Momentum confirmation
• Slope confirmation
• ATR expansion confirmation
• RSI confirmation
• Minimum strength confirmation
These filters allow traders to customize how conservative or aggressive the signals should become.
Buy Signals
Bullish signals appear when:
• Trend flips bullish
• Confirmation requirements are satisfied (depending on settings)
• Institutional trend strength exceeds the selected threshold
Buy markers are plotted directly on the adaptive trend ribbon.
Sell Signals
Bearish signals appear when:
• Trend flips bearish
• Confirmation requirements are satisfied
• Institutional strength requirements are met
Sell markers appear directly on the ribbon for immediate visual recognition.
Candle Coloring
The indicator can automatically paint candles according to trend direction.
Green candles indicate bullish conditions.
Red candles indicate bearish conditions.
Neutral conditions remain unpainted.
This provides instant trend recognition even without watching the ribbon continuously.
Alert System
Multiple alert conditions are included:
• Bullish Trend
• Bearish Trend
• Buy Signal
• Sell Signal
• Trend Change
• Ribbon Flip
• Momentum Expansion
These alerts allow traders to automate notifications without constantly monitoring charts.
Recommended Markets
The indicator has been designed to work across a wide range of liquid financial markets, including:
• Forex
• Gold (XAU/USD)
• Silver
• Stock Indices
• Individual Stocks
• Cryptocurrencies
• Commodities
Recommended Timeframes
Depending on the selected VWAP mode, the indicator can be used on multiple timeframes.
Scalping:
1 Minute
3 Minutes
5 Minutes
Intraday:
15 Minutes
30 Minutes
1 Hour
Swing Trading:
4 Hour
Daily
Important Notes
This indicator is designed as a trend analysis and market structure tool.
Like every technical indicator, it should be used together with sound risk management, proper trade planning, and overall market context.
No indicator can predict future price movement with certainty.
Author Verification Declaration
This indicator has been independently researched, designed, engineered, coded, tested, optimized, and maintained by Forex_Market_Insights.
Every algorithm, visualization method, adaptive calculation, trend engine, ribbon construction, confirmation framework, and implementation included in this publication represents the original work of the author.
The indicator has been developed using Pine Script® Version 6 through independent software engineering practices with the objective of providing a professional institutional trend-following solution for TradingView users.
Original Indicator Script Implementation Verification
Institutional Adaptive VWAP Trend Ribbon Pro is an original implementation created by Forex_Market_Insights.
The script architecture, adaptive VWAP framework, dynamic deviation calculations, institutional trend ribbon visualization, adaptive trailing methodology, trend strength engine, confirmation logic, gradient rendering system, and overall implementation have been independently developed specifically for this indicator.
This publication represents an original Pine Script implementation created for TradingView and reflects the author's own design decisions, coding structure, visualization techniques, and algorithm integration.
Copyright & Ownership Declaration
© Forex_Market_Insights
All original source code, implementation logic, calculations, visualization methods, user interface design, documentation, and accompanying publication text are the intellectual work of Forex_Market_Insights.
This indicator has been created specifically for educational and analytical purposes on TradingView. Unauthorized redistribution, misrepresentation of authorship, or republication of the original implementation without appropriate permission may violate applicable intellectual property rights and TradingView House Rules.
www.tradingview.com Indikator

Market Trend Machine Learning SignalsMarket Trend Machine Learning Signals
Overview
Market Trend Machine Learning Signals is a professional trend-following and smart trade setup indicator developed to help traders identify high-probability buying and selling opportunities directly from live market structure. Instead of relying on a single moving average or a basic crossover system, this indicator combines multiple layers of market analysis to determine when price is reacting from important support or resistance zones with sufficient confirmation to justify a potential trading opportunity.
The indicator continuously tracks live market conditions, evaluates trend strength, identifies dynamic support and resistance zones, analyzes price rejection behavior, and automatically builds complete trade setups consisting of:
Entry Price
Stop Loss
TP1
TP2
TP3
Final Target
Risk-to-Reward Ratio
Alongside these visual trade setups, the indicator also displays a fully customizable dashboard that summarizes the current market condition, confidence levels, trend direction, volatility, signal quality, support/resistance zones, and all active trade information in one place.
The primary goal of this indicator is to simplify professional market analysis by transforming complex price action into easy-to-read institutional-style trading setups.
---
Why This Indicator Was Created
Many traders spend a significant amount of time manually identifying support and resistance levels, evaluating trend direction, calculating risk management, and estimating realistic profit targets.
This process is often subjective and inconsistent.
The purpose of Market Trend Machine Learning Signals is to automate this workflow.
Instead of requiring traders to manually draw zones and calculate trade parameters, the indicator continuously monitors live market behavior and performs these tasks automatically.
Its objective is to help traders:
Identify high-quality trend continuation opportunities.
Detect strong market reversals from significant price zones.
Reduce emotional decision-making.
Improve consistency in trade planning.
Save chart analysis time.
Present structured trading opportunities with predefined risk management.
---
How the Indicator Works
The indicator continuously scans every incoming candle and evaluates multiple conditions before generating a signal.
Rather than reacting to every market movement, it waits for strong confirmation that price is interacting with an important technical area.
Its internal logic evaluates factors such as:
Market trend direction
Swing structure
Dynamic support zones
Dynamic resistance zones
Price rejection
Momentum
Trend continuation probability
Bullish/Bearish strength
Market confidence
Only when multiple conditions align together does the indicator generate a trading setup.
This filtering process helps reduce unnecessary signals during sideways market conditions.
---
Dynamic Support & Resistance Detection
Unlike fixed horizontal levels, the support and resistance zones generated by this indicator continuously adapt to changing market conditions.
As new price data becomes available:
Support zones shift when stronger buying areas are detected.
Resistance zones move as selling pressure changes.
Old zones become inactive.
New zones replace them automatically.
This allows the indicator to remain synchronized with live market structure on every timeframe.
---
Long Trade Detection
When price approaches a strong support zone, the indicator evaluates whether buyers are beginning to regain control.
Before generating a BUY setup it looks for evidence such as:
Strong bullish rejection.
Failure to break below support.
Increasing bullish momentum.
Trend confirmation.
Market strength improvement.
Bullish confidence exceeding bearish pressure.
Once enough confirmation exists, the indicator automatically plots:
BUY signal
Entry level
Stop Loss
TP1
TP2
TP3
Final Target
The complete setup appears instantly on the chart with visual trade boxes that clearly display both the potential reward and risk.
---
Short Trade Detection
The same process is applied in reverse.
When price reaches an important resistance zone, the indicator evaluates whether sellers are taking control.
The system checks for:
Bearish rejection
Failed breakout attempts
Selling momentum
Trend confirmation
Increasing bearish confidence
Market weakness
Once confirmed, a complete SELL setup is created with:
Sell Entry
Stop Loss
TP1
TP2
TP3
Final Target
This allows traders to quickly visualize the entire trading plan without manually drawing levels.
---
Automatic Trade Management
One of the most practical features of the indicator is its automatic trade visualization.
Each setup includes professionally organized trading levels.
These include:
Entry
Stop Loss
TP1
TP2
TP3
Final Target
The trade boxes visually separate:
Risk Area
Profit Area
making it easier to understand the complete trade before entering.
As price progresses through the targets, traders can easily monitor the development of the setup.
---
Smart Dashboard
The indicator also includes a fully customizable dashboard positioned in the chart corner.
The dashboard provides a quick summary of current market conditions without requiring additional indicators.
It displays information including:
Current Market Trend
Bullish Confidence %
Bearish Confidence %
Market Strength
Signal Quality
Volatility Status
Active Timeframe
Current Support Zone
Current Resistance Zone
Active Trade Direction
Trade Status
Entry Price
Stop Loss
TP1
TP2
TP3
Final Target
Risk : Reward Ratio
The dashboard can be resized and repositioned through the settings, allowing traders to customize it according to their workspace.
---
Multi-Timeframe Compatibility
The indicator is designed to work across multiple markets and timeframes.
It automatically adapts its calculations based on the active chart and can be used for:
Scalping
Intraday Trading
Swing Trading
Position Trading
Compatible with:
Forex
Cryptocurrency
Stocks
Indices
Commodities
Futures
---
Professional Visualization
To improve chart readability, the indicator uses clean institutional-style graphics.
Visual elements include:
Dynamic Support Zones
Dynamic Resistance Zones
Buy Labels
Sell Labels
Entry Box
Stop Loss Zone
Multiple Target Levels
Profit Projection Box
Risk Box
Dashboard Summary
These visual tools help traders understand market structure at a glance without cluttering the chart.
---
Intended Purpose
This indicator was developed to provide traders with a complete decision-support system rather than just another buy/sell signal generator.
Its goal is to combine trend analysis, market structure, confidence evaluation, support and resistance detection, and risk management into a single comprehensive trading tool.
By presenting organized trade setups with predefined entry, stop-loss, and target levels, it helps traders maintain consistency and discipline while reducing the need for manual calculations.
It is designed as an analytical assistant to support informed decision-making, while final trade execution remains the responsibility of the user.
---
Verification
Market Trend Machine Learning Signals has been independently designed and developed by Forex_Market_Insights.
The Pine Script implementation, chart visualization, dashboard system, trade management logic, market structure analysis, support/resistance detection methodology, and overall workflow have been written specifically for this indicator.
This publication represents an original implementation created by the developer and is intended to provide traders with a unique analytical tool for identifying high-probability trading opportunities.
---
Clarification
This indicator is an original work authored by Forex_Market_Insights.
The complete Pine Script codebase, visual interface, dashboard design, trade setup presentation, signal generation logic, and supporting algorithms have been independently developed for this project. The implementation was written from the ground up to achieve the intended analytical behavior and user experience.
While the indicator applies widely recognized concepts from technical analysis—such as trend evaluation, support and resistance, momentum, and risk management—the specific combination of these concepts, the calculation workflow, visualization style, and software implementation are original to this publication.
This indicator is not presented as a guaranteed prediction system or financial advisory service. It is an analytical tool designed to assist traders in evaluating market conditions and organizing trade plans more efficiently. Trading financial markets involves risk, and users should always apply appropriate risk management and independent judgment before making trading decisions.
Indikator