Indikator

Indikator

Indikator
Strategie

Indikator

Indikator
Indikator

Indikator
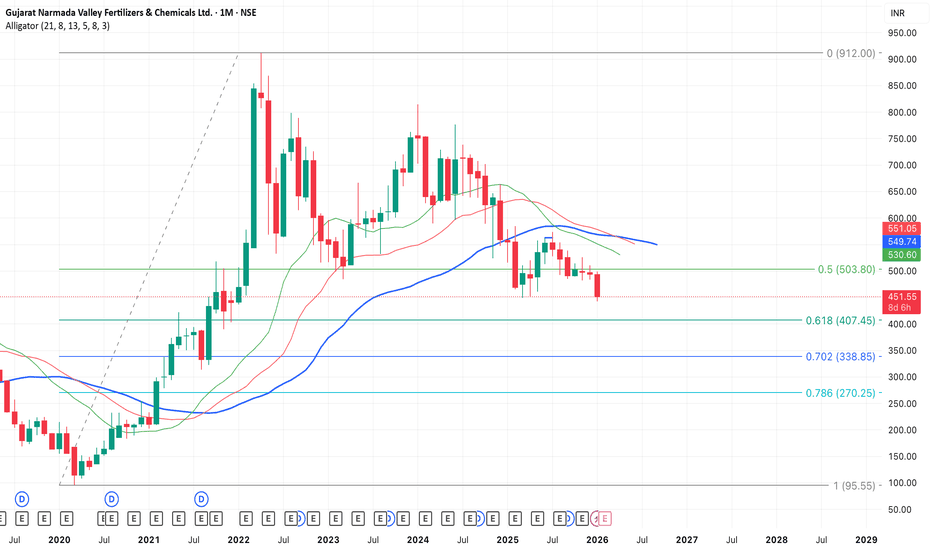
N Option Selling 1
**NIFTY Weekly Option Seller – Regime & Risk Framework (HTF + RSI)**
This indicator is a **decision-support tool for NIFTY option sellers**, designed to identify whether current market conditions favor:
* **Iron Condor (IC)** – range / mean-reversion
* **Put Credit Spread (PCS)** – bullish bias
* **Call Credit Spread (CCS)** – bearish bias
The script focuses on **structure selection and risk management**, not trade execution.
---
## Core logic
### 1) Multi-timeframe context
* Signals are calculated on the **active chart timeframe** (commonly 4H).
* **Daily (HTF) EMA trend and Daily ADX** are used as **gating conditions**, ensuring strong directional scores are not allowed against the higher-timeframe context.
This prevents aggressive trend selling when the daily structure does not support it.
---
### 2) Three independent regime scores (0–5)
The script computes three capped and smoothed scores:
* **IC score (Range quality)**
Based on low ADX, price inside CPR, proximity to VWAP, Camarilla H3–L3, daily range confirmation, and mid-band RSI.
* **PCS score (Bullish structure)**
Based on EMA up-stack, trend strength (ADX), price relative to CPR/VWAP, with RSI and Daily trend acting as **brakes**, not entry signals.
* **CCS score (Bearish structure)**
Based on EMA down-stack, trend strength (ADX), price relative to CPR/VWAP, with RSI and Daily trend acting as **brakes**, not entry signals.
RSI is used only to **cap aggressiveness at extremes**, not to predict reversals.
---
### 3) Cross-penalty & smoothing
* When multiple regimes score high simultaneously, **cross-penalties reduce conflicting scores** so only one regime dominates.
* Final scores are **smoothed across bars** to avoid frequent regime flips and unstable sizing decisions.
---
### 4) Regime selection
The script selects **one primary regime** (IC / PCS / CCS) based on the highest adjusted score, with tie-break logic that prefers trend regimes only when ADX confirms strength; otherwise it defaults to IC.
---
### 5) Non-repainting reference levels
The indicator plots key **previous-day, non-repainting levels**:
* CPR (Low / High with Narrow–Wide classification)
* Camarilla H3, L3, H4, L4
* VWAP
These are contextual reference levels for structure and risk placement.
---
### 6) DEFEND / HARVEST prompts
Using ATR-based proximity logic, the script provides:
* **DEFEND** alerts when price approaches modeled risk zones
* **HARVEST** alerts when sufficient cushion exists
* **REGIME** alerts on confirmed regime changes
These are **risk-management prompts**, not buy/sell signals.
---
### 7) Visual dashboard
A compact panel displays:
* Active regime and score
* ADX / RSI
* CPR width classification
* EMA structure and tightness
* VWAP proximity
* IC / PCS / CCS scores
* Key level snapshot
---
## Intended use
* Designed for **weekly option selling**
* Best used on **4H charts with Daily context**
* Suitable for traders who manage positions **once per day**
* Encourages **structure-first thinking** (IC base with controlled directional bias)
---
## Disclaimer
This indicator does **not place trades** and does not calculate position size or P&L.
It is a **market regime and risk-awareness tool** and must be used with proper capital management and execution discipline.
Indikator

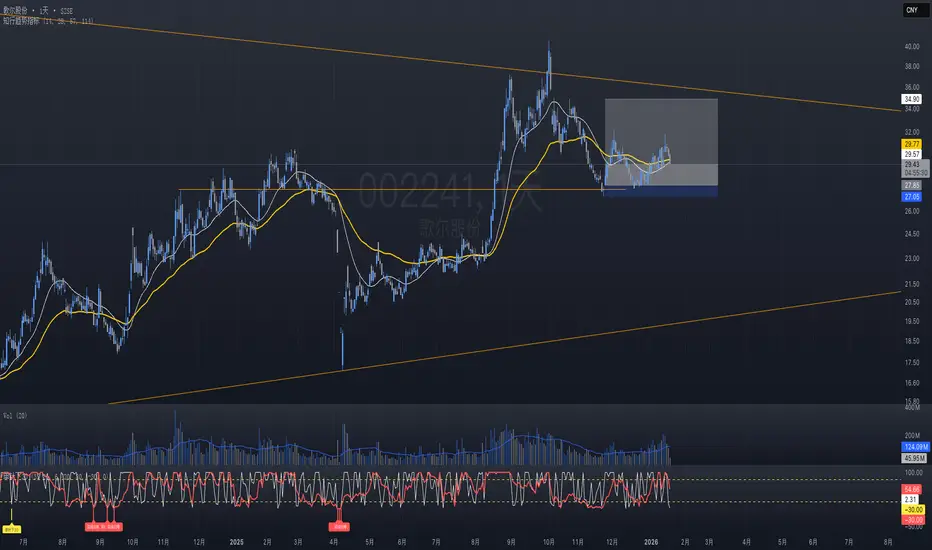
Needle Below 20, Sub-chart## 指标名称
**单针下20副图(Needle Below 20, Sub-chart)**
## 一句话概述
在**中周期保持强势**的背景下,用短周期的“快速降温”来定位**强势回撤/错杀**,并额外标记**极端超卖(双线归零)**的情绪极值窗口。
---
## 指标逻辑与构成
本指标包含两条强弱线(随机指标风格的区间归一化):
* **短期线(默认 3)**
反映近短周期内价格在区间的位置,敏感度高,用于捕捉短线回撤与情绪快速降温。
* **长期线(默认 21)**
反映中周期强弱分布,用作“趋势/强势背景”的过滤。
并提供两类柱状提示(STICK):
1. **双线归零(默认:短期≤6 且 长期≤6)**
代表“情绪极端恐慌/极端超卖”的窗口,更多用于观察**反弹可能性**与“风险释放阶段”。
2. **单针下20(默认:短期≤20 且 长期≥80)**
代表“中周期强势未破 + 短线急跌/下探”的典型回撤信号,用于寻找趋势交易中的**回撤介入候选**。
图中绘制 **80/20** 参考线,帮助快速判断分位区域。
---
## 使用方法(推荐工作流)
### 1)先定“背景”:只在你认可的趋势环境使用
本指标本质是“**强势回撤定位器**”,并不负责替你判断大盘/板块/个股是否处于可交易趋势。建议搭配以下任一类过滤器:
* **趋势过滤(强烈推荐)**
* 价格位于中长期均线之上(例:MA50/MA200 上方)
* 或者你自己的趋势线/多空线系统显示多头趋势(如:快线>慢线、结构未破)
* **结构过滤(强烈推荐)**
* 回撤仍然在关键支撑之上(前高、趋势线、箱体上沿回踩等)
* 避免在明显“破位下跌”的结构中把信号当作抄底依据
### 2)信号触发后的处理:不要“看到就买”,而是“进入观察与触发”
* **单针下20(黄柱)**:
作为“候选提示”,下一步关注是否出现:
* 回踩关键位后的止跌K线(锤子线/吞没/放量止跌等)
* 次日/后续重新站回关键位或出现趋势延续确认
* 量价关系转好(缩量回撤、放量反转等)
* **双线归零(红柱)**:
更偏“情绪极值”提示,常见用途是:
* 提醒你风险已经释放到极端区域,观察是否出现反弹结构
* 不建议无过滤硬抄底;更适合与“结构止跌/大盘企稳”一起使用
---
## 风险控制与止损思路(示例,不构成建议)
以下仅提供“如何把信号落到可执行”的框架示例:
* **入场触发(示例)**
* 黄柱出现后:等待价格在关键位止跌,或出现确认K线再介入
* 分批:先小仓试错,确认后再加
* **止损锚点(示例)**
* 关键支撑位下破(趋势线/前低/箱体下沿)
* 或“信号触发后的反弹失败又破前低”
* **仓位建议(原则)**
* 把仓位大小与止损距离联动:止损距离越大,仓位越小
* 避免单次信号重仓;这类信号更适合“低风险试错 + 确认加仓”的趋势回撤逻辑
---
## 参数说明与调参建议
### 1)为什么是 3 / 21?
* **3**:强调“短期情绪/回撤”的敏感度,适合捕捉快速下探
* **21**:近似一个月交易日,刻画中周期强弱背景,适合作为“强势过滤”
如果你交易周期更短(更偏日内/隔日):
* 可考虑 **短期 2–5**、长期 **13–34** 区间做测试。
如果你交易周期更长(偏波段/中线):
* 可考虑 **短期 5–8**、长期 **34–55**。
### 2)为什么阈值是 6 / 20 / 80?
* **6**:更接近“极端”区域,用于标记情绪极值(双线归零)
* **20/80**:经典分位阈值,表示低位/高位区域,用于区分“短弱/长强”的错位状态
### 3)如何调参更贴合你的市场与标的?
建议按“信号密度—胜率—回撤”三者权衡:
* 信号太多:
* 降低“长期≥”阈值的触发频率(如 80→85)
* 或提高“短期≤”门槛的严苛度(20→15)
* 或把长期周期加长(21→34)
* 信号太少:
* 放宽阈值(长期 80→75、短期 20→25)
* 或缩短长期周期(21→13)
调参务必结合你常交易的品种波动特征,建议在同一市场同一类标的上做一致性回测/复盘。
---
## 免责声明
本脚本仅用于教育与研究目的,展示一种技术分析可视化方法,不构成任何形式的投资建议、交易建议或收益承诺。市场有风险,交易需谨慎。使用者应基于自身风险承受能力独立决策,并对交易结果自行负责。作者不对任何因使用本脚本导致的直接或间接损失承担责任。
---
## 致谢与来源
* **策略/思路来源**:B站 UP 主 **z哥** 的相关分享与讲解。
* **实现说明**:本脚本为 TradingView(Pine Script)版本的复现与可视化实现,便于在 TradingView 环境中使用与研究。
* 如原作者对公开引用有额外要求,请以原作者说明为准;若有侵权或需要修改归因方式,请联系我调整/下架相关描述。
下面给你补齐一份**英文版(可直接用于 TradingView 发布页)**,并与中文版结构对齐,符合社区常见写法(Overview / How it works / How to use / Inputs / Risk / Credits)。
---
## Title
**Needle Below 20 (Sub-chart) — TDX Style Recreation**
## Overview
This indicator is an auxiliary tool designed to spot **sharp short-term pullbacks (shakeouts) within a strong mid-term regime**, and to highlight **extreme oversold “panic” zones**. It is best used as a **candidate filter and timing aid** inside a broader trend-following framework, rather than as a standalone buy/sell signal.
## How it works
The script plots two normalized strength lines (stochastic-style normalization over a lookback window):
* **Short-term line (default: 3 bars)**
Captures fast sentiment cooling and short-term compression (high sensitivity).
* **Long-term line (default: 21 bars)**
Represents the mid-cycle regime strength, used as a context filter.
It also provides two stick/column signals:
1. **Double-Line Near-Zero (Red stick)**
Triggered when **Short-term ≤ 6 AND Long-term ≤ 6** (defaults).
This typically represents an **extreme oversold / capitulation-like** window, often used to monitor potential technical rebounds (confirmation recommended).
2. **Needle Below 20 (Yellow stick)**
Triggered when **Short-term ≤ 20 AND Long-term ≥ 80** (defaults).
This is commonly interpreted as a **strong regime intact + sudden short-term dump/pullback**, useful for spotting potential **trend pullback re-entry candidates**.
Reference levels **80/20** are drawn for quick zone reading.
### How to use (recommended workflow)
1. **Define the regime first (strongly recommended)**
This indicator does not decide whether a market is tradable. Use a trend/structure filter, for example:
* Price above a medium/long MA (e.g., MA50/MA200), or your own trend model
* Structure not broken (support holds, pullback into a valid support zone)
2. **Treat signals as “watchlist triggers,” not instant entries**
* **Yellow stick (Needle Below 20):**
After it prints, look for confirmation such as:
* A hold/reclaim of a key level (prior high, trendline, range top retest, etc.)
* A reversal candle or continuation confirmation
* Constructive volume/price behavior (e.g., pullback on lighter volume, rebound with demand)
* **Red stick (Double-Line Near-Zero):**
Best viewed as an **extreme sentiment/oversold marker**. Avoid blind bottom-fishing; combine with structure stabilization and broader market context.
## Risk management (examples, not financial advice)
* **Entry trigger (example):** scale in after confirmation rather than buying the first signal
* **Stop reference (example):** below the key support / prior swing low / structural invalidation level
* **Position sizing principle:** size positions based on stop distance; larger stop = smaller size
## Inputs / Parameters
* **Lookbacks (3 / 21):**
* 3 bars: short-term sensitivity for fast pullback detection
* 21 bars: mid-cycle regime context (roughly one trading month)
Suggested adjustments:
* Shorter-term trading: try **2–5** (short) and **13–34** (long)
* Longer swing trading: try **5–8** (short) and **34–55** (long)
* **Thresholds (6 / 20 / 80):**
* 6: “extreme” zone for near-zero panic marker
* 20/80: classic zone thresholds for low/high regime separation
If signals are too frequent:
* tighten thresholds (e.g., long ≥ 80 → 85, short ≤ 20 → 15), or lengthen long lookback (21 → 34)
If signals are too rare:
* loosen thresholds (e.g., long ≥ 80 → 75, short ≤ 20 → 25), or shorten long lookback (21 → 13)
## Disclaimer
This script is provided for **educational and research purposes only**. It does **not** constitute financial advice, investment recommendations, or any guarantee of performance. Trading involves risk. You are solely responsible for your decisions and outcomes.
## Credits / Attribution
* **Concept origin:** Inspired by the Bilibili creator **“z哥”**.
* **Implementation:** This is a TradingView (Pine Script) recreation for visualization and study.
If the original creator has specific attribution requirements, please follow the creator’s instructions. If any changes are needed, attribution text can be updated accordingly.
## Citation snippet
> Concept inspired by Bilibili creator “z哥”. Pine Script recreation for educational/research use. Indikator

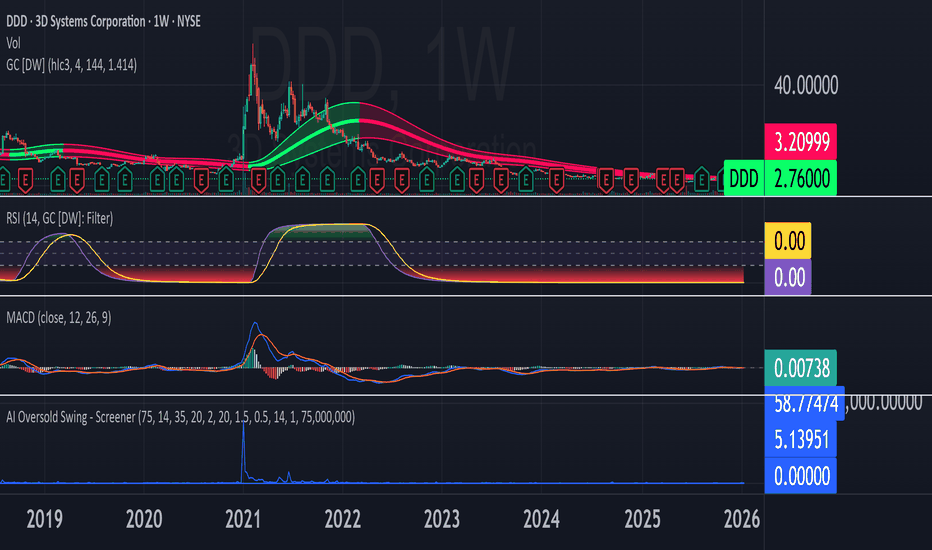
AI Oversold Swing - Screener//@version=5
indicator("AI Oversold Swing - Screener", overlay=false)
// ─────────────────────────
// USER INPUTS
// ─────────────────────────
maxPrice = input.float(75.0, "Max Price ($)")
rsiLen = input.int(14, "RSI Length")
rsiOversold = input.float(35.0, "RSI Oversold Level")
bbLen = input.int(20, "BB Length")
bbMult = input.float(2.0, "BB StdDev")
supportLen = input.int(20, "Support Lookback (days)")
nearSupportPct = input.float(1.5, "Near Support %")
undercutPct = input.float(0.5, "Allowed Undercut %")
atrLen = input.int(14, "ATR Length")
maxATRfromSup = input.float(1.0, "Max ATR From Support")
minDollarVol = input.float(75000000.0, "Min Dollar Volume", step=1000000)
requireTrigger = input.bool(false, "Require Reversal Trigger")
// ─────────────────────────
// DAILY DATA (screener uses indicator outputs)
// ─────────────────────────
dClose = request.security(syminfo.tickerid, "D", close)
dLow = request.security(syminfo.tickerid, "D", low)
dVol = request.security(syminfo.tickerid, "D", volume)
dPrevC = request.security(syminfo.tickerid, "D", close )
// ─────────────────────────
// INDICATORS
// ─────────────────────────
rsi = ta.rsi(dClose, rsiLen)
basis = ta.sma(dClose, bbLen)
dev = bbMult * ta.stdev(dClose, bbLen)
bbLow = basis - dev
atr = request.security(syminfo.tickerid, "D", ta.atr(atrLen))
support = ta.lowest(dLow, supportLen)
distPct = support > 0 ? (dClose - support) / support * 100.0 : na
distATR = atr > 0 ? (dClose - support) / atr : na
dollarVol = dClose * dVol
// ─────────────────────────
// CONDITIONS
// ─────────────────────────
priceOK = dClose > 0 and dClose <= maxPrice
liqOK = dollarVol >= minDollarVol
oversold = (rsi <= rsiOversold) and (dClose <= bbLow)
nearSup =
support > 0 and
dClose <= support * (1 + nearSupportPct / 100.0) and
dClose >= support * (1 - undercutPct / 100.0) and
distATR <= maxATRfromSup
setup = priceOK and liqOK and oversold and nearSup
// Optional reversal confirmation
rsiReversal = ta.crossover(rsi, rsiOversold)
greenCandle = dClose > dPrevC
trigger = rsiReversal or greenCandle
signal = requireTrigger ? (setup and trigger) : setup
// ─────────────────────────
// SCREENER OUTPUTS
// ─────────────────────────
plot(signal ? 1 : 0, title="Signal (1 = YES)")
plot(rsi, title="RSI (Daily)")
plot(distPct, title="Dist to Support % (Daily)")
plot(distATR, title="Dist to Support ATR (Daily)")
plot(dollarVol, title="Dollar Volume (Daily)")
Indikator
Indikator

Indikator

Indikator

Indikator
Indikator

Indikator

Liquidity Gravity Engine [Pineify]```markdown
Liquidity Gravity Engine - Market Structure, Displacement, Liquidity Rails
Overview
Liquidity Gravity Engine is a market structure + liquidity visualization indicator designed to help you read flow , impulse , and liquidity magnets on any symbol and timeframe. Instead of relying on a single moving average, it builds a dynamic “flow ribbon” from confirmed swing structure, highlights displacement candles that create imbalance (FVG-style gaps), and projects unmitigated swing levels as liquidity rails that price often revisits.
Key Features
Liquid Flow Ribbon: a structure-based dynamic band that adapts to volatility.
Displacement Highlighting: flags momentum candles that expand beyond ATR and form an imbalance.
Liquidity Rails: extends unmitigated swing highs/lows as potential targets until swept.
Trend Context: displacement is filtered using the ribbon’s smoothed centerline.
How It Works
Market Structure (Swings) : swing highs/lows are detected using pivot logic over your “Structure Lookback”. Pivots become confirmed only after the lookback window completes, which means historical swing points can update until they are confirmed.
Flow Construction : the most recent confirmed swing high and swing low define a top and bottom boundary. Their midpoint is then smoothed with an EMA to create the “liquid” centerline.
Displacement + Imbalance : a candle is considered displacement when its range expands beyond ATR(14) × Displacement Factor and it creates a simple FVG-style gap (current low above the high two bars back for bullish, or current high below the low two bars back for bearish). The bar is then filtered by being on the correct side of the smoothed flow center.
Liquidity Rails : each new confirmed swing high/low can become a dotted rail. Rails extend forward and are removed once price sweeps beyond the level (mitigation), keeping the chart focused on active liquidity.
Trading Ideas and Insights
Use the ribbon as context : bias is stronger when price holds one side of the flow centerline.
Treat displacement markers as impulse confirmation : they often appear at breakout moments or at the start of expansions.
Use liquidity rails as magnets : unmitigated swing highs/lows can act as targets for continuation or mean-reversion moves.
Combine structure + displacement: a sweep into a rail followed by an opposite displacement can hint at a reversal attempt.
How Multiple Components Work Together
This indicator is intentionally built as a single liquidity-driven workflow:
Swings define structure.
Structure defines the flow ribbon (trend/volatility context).
The ribbon filters displacement so you see momentum that aligns with flow.
Liquidity rails provide objective target zones derived from the same swing structure.
The result is a cohesive view of market structure flow, institutional-style displacement, and liquidity targets without stacking multiple separate indicators.
Unique Aspects
Structure-first ribbon: the band is anchored to confirmed swing points, not just a price average.
Imbalance-aware displacement: requires both range expansion and a gap-style condition, reducing generic “big candle” noise.
Self-cleaning liquidity rails: mitigated levels are removed to keep the chart readable.
How to Use
Start with defaults on a clean chart.
Identify the flow: price above the smoothed centerline favors bullish flow; below favors bearish flow.
Watch for displacement diamonds (“D”): they often validate a push away from structure and can mark the start of a leg.
Plan around rails: treat dotted lines as potential objectives and areas where reactions/sweeps can occur.
Customization
Structure Lookback : smaller values = more sensitive swings; larger values = cleaner, slower structure.
Displacement Factor : higher values = fewer, stronger displacement bars; lower values = more signals.
Show Liquidity Rails + Liquidity Lookback : control whether rails are plotted and how active levels are emphasized.
Visuals : adjust bullish/bearish flow colors and liquidity line styling for your chart theme.
Conclusion
Liquidity Gravity Engine helps you map market structure, highlight displacement and imbalance (FVG-style) momentum, and visualize liquidity targets with rails that stay relevant until swept. Use it for trend context, breakout confirmation, and liquidity-based trade planning on forex, crypto, stocks, and indices.
Indikator

Indikator

Indikator
Indikator
Indikator

Strategie