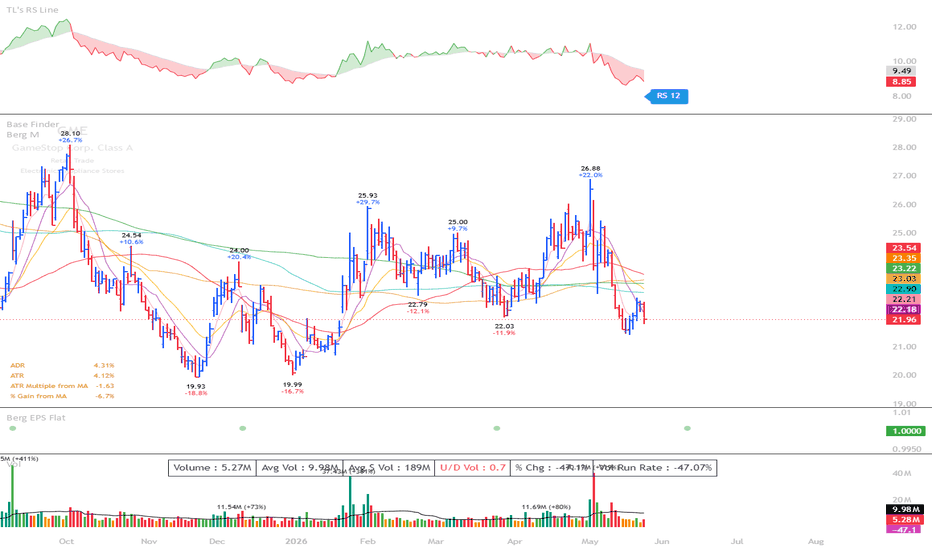
Smart Market Dashboard PRO Gap Trader EditionA comprehensive intraday dashboard designed specifically for Borsa Istanbul (BIST) equity traders. This indicator focuses on opening gap analysis, combining volume, delta, and price action to help traders make informed decisions at market open.
Key Features:
Gap Detection & Classification – Automatically identifies and labels opening gaps (Full Gap Up/Down, Partial Gap Up/Down) with configurable minimum gap % threshold
Volume & Delta Analysis – Displays real-time cumulative delta, buy/sell volume ratio, and VWAP deviation
Multi-Timeframe Data – Fetches previous day’s OHLCV data to calculate gap reference levels accurately
Visual Dashboard – A clean on-chart table showing key metrics: gap size, volume trend, delta direction, and gap fill probability
Smart Alerts – Configurable alerts for gap setups, gap fill events, and volume anomalies
How It Works:
Gap levels are calculated using End-of-Day (previous session close) as the reference price
All calculations are based on confirmed bar data (barmerge.lookahead_off) to prevent repainting on historical bars
Recommended Usage:
Timeframe: 1–15 minute charts
Market: BIST stocks (optimized for Turkish market open at 10:00 AM)
Works best during the first 30–60 minutes of the trading session
Disclaimer: This indicator is for educational and informational purposes only. It does not constitute financial advice. Always manage your risk accordingly.
Note: As with all intraday indicators, values may update within the current live bar until it closes Indikator

Delta Volume Profile ProDelta Volume Profile Pro is a volume profile indicator built upon the quadrant structure originally introduced by BigBeluga in the Quadro Volume Profile script. Full credit for the original concept and core logic goes to BigBeluga.
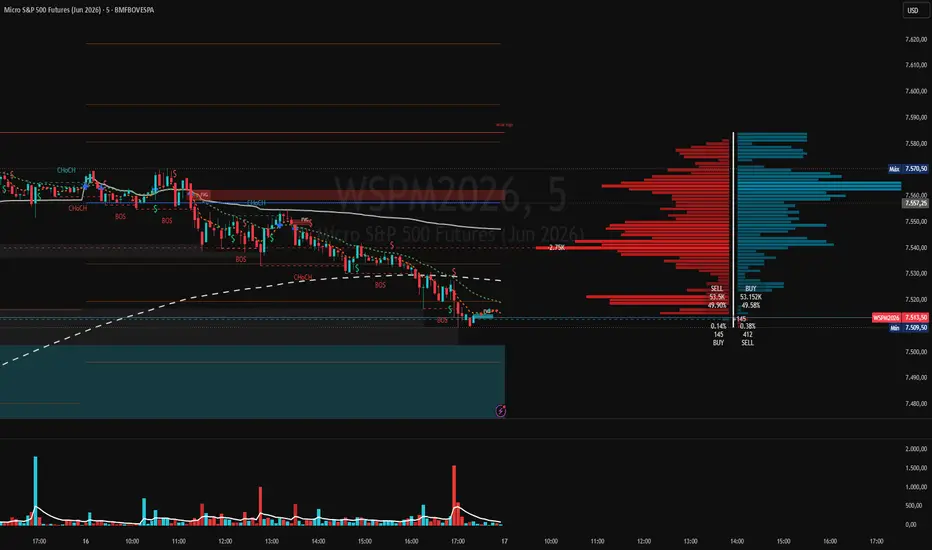
🔍 What it does
This indicator divides the visible price range into four quadrants relative to the current price and distributes volume across price bins, revealing where the most significant buying and selling activity has occurred above and below the market.
Each quadrant displays:
Upper Sell Quad — sell volume concentrated above the current price
Upper Buy Quad — buy volume concentrated above the current price
Lower Buy Quad — buy volume concentrated below the current price
Lower Sell Quad — sell volume concentrated below the current price
A Point of Control (PoC) dashed line marks the price bin with the highest volume in each quadrant.
Four percentage labels at the current price level show how total volume is distributed across all quadrants, allowing traders to quickly assess the balance between buying and selling pressure on both sides of the market.
⚙️ Original additions over BigBeluga's base
1. Proxy Volume Engine — works on any broker
Many brokers and CFD platforms do not provide usable native volume data. This indicator includes an internal map of 80+ symbols to their most liquid equivalents:
Forex pairs → (tick volume, CFD-compatible scale)
Metals (Gold, Silver, Platinum)
Crypto (BTC, ETH, etc.)
Oil, Gas →
Indices & Futures
The proxy is fetched automatically via request.security. You do not need to change any settings when switching between brokers — the indicator detects the symbol and loads the appropriate volume source.
2. Proxy-First Priority
Unlike a simple fallback system, this indicator uses the proxy as the primary volume source for all mapped symbols. This guarantees consistent, real volume data regardless of the broker you are charting on — whether EasyMarkets, FXCM, or any CFD provider. The native volume is only used if the proxy fails or if you explicitly enable "Force Native Volume" in settings.
3. Daily Session Mode
When enabled, the profile anchors to the start of the current daily session and resets automatically at each new day — useful for intraday traders who want to see only today's volume distribution.
4. Daily VWAP Anchor
An optional Volume Weighted Average Price line anchored to the daily session open, calculated using the same proxy volume logic as the profile for accuracy across all brokers.
📐 How to read the indicator
Profile bars (left and right of the vertical axis):
Left side bars = dominant directional volume per price bin
Right side bars = opposing volume per price bin
Deeper color = higher volume concentration at that price level
Longer bars = more activity at that price — key support/resistance zones
The four labels at current price:
SELL% | BUY%
SELL | BUY
──────────────────── ← current price
BUY% | BUY%
BUY | SELL
Upper left (SELL%) — percentage of total volume that was selling above current price
Upper right (BUY%) — percentage of total volume that was buying above current price
Lower left (BUY%) — percentage of total volume that was buying below current price
Lower right (SELL%) — percentage of total volume that was selling below current price
Point of Control (PoC) — dashed line:
Marks the single price level with the highest volume in each quadrant
Strong reference for support and resistance
📊 How to interpret the percentages
Example from chart — USDCAD 15M:
Upper: SELL 2.90% | BUY 3.75%
Lower: BUY 51.79% | SELL 41.57%
Reading:
51.79% of all volume below price was buying → strong buy accumulation below
41.57% of all volume below price was selling → significant sell pressure also present
Only 2.90% + 3.75% above price → very little activity above current price
Interpretation: price is near the top of the range with most activity below
General rules:
Large BUY% below + small SELL% above → bullish bias, buyers in control
Large SELL% above + small BUY% below → bearish bias, sellers in control
Balanced percentages on both sides → price in equilibrium, expect breakout
PoC line in lower quad with high BUY volume → strong support level
PoC line in upper quad with high SELL volume → strong resistance level
⚠️ Important notes
This indicator is a visual analysis tool. It does not generate buy or sell signals.
Past volume distribution does not guarantee future price behavior.
The proxy volume reflects tick volume from the mapped exchange, not actual traded notional value.
On weekends or when markets are closed, volume may be incomplete, affecting the profile.
⚙️ Settings reference
ParameterDefaultDescriptionUse Daily Session ModeOFFON: resets profile each day. OFF: fixed lookbackLookback Period200Bars used when Session Mode is OFFForce Native VolumeOFFON: uses chart's native volume instead of proxyPrice Bins60Number of horizontal price levelsProfile Offset60Distance from last bar (in bars)Upper/Lower QuadsONShow/hide each profile sectionPoCON/OFFShow/hide Point of Control per quadrantShow Daily VWAPONPlots the session VWAP lineBuy ColorGreenProfile buy side colorSell ColorRedProfile sell side colorVWAP ColorWhiteVWAP line color
🙏 Credits
Original quadrant volume profile concept and core structure:
BigBeluga — Quadro Volume Profile
www.tradingview.com
Released under Mozilla Public License 2.0
mozilla.org Indikator

Indikator

Indikator

Indikator

Indikator

Indikator

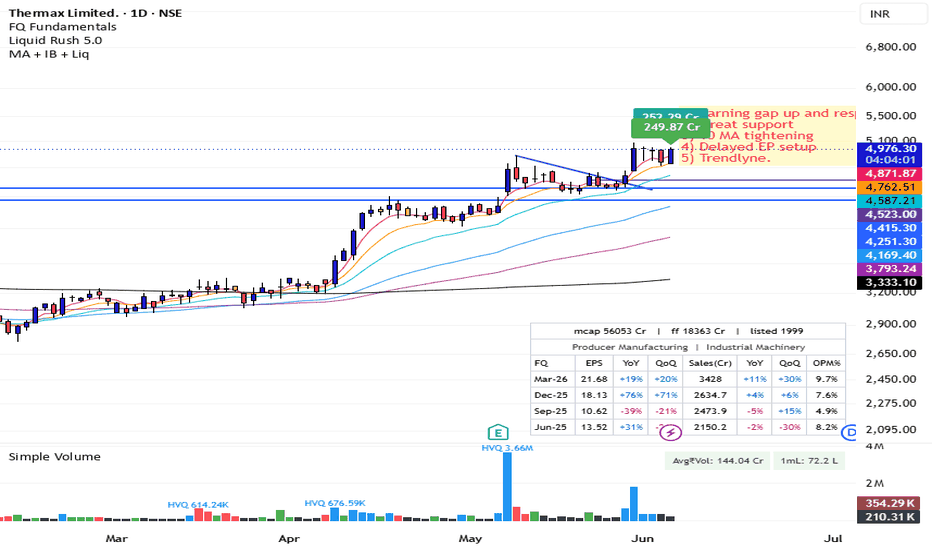
EMA/SMA + Inside Bar + Liquidity Tag BY RAVIEMA/SMA + Inside Bar + Liquidity Tag
An all-in-one overlay that combines three tools traders usually run separately: a flexible moving-average suite, automatic inside-bar detection, and a live liquidity (traded-value) tag on the latest candle. Built for Pine Script v6.
What it does
1. Moving Averages (5, 10, 20, 50, 100, 200)
Six independent moving-average lines. Each line can be set to EMA or SMA on its own, so you can mix freely (for example, a 20 EMA alongside a 50 and 200 SMA). Every line has its own on/off toggle, colour, and width control (1 = thinnest, 4 = thickest). A single Source input controls which price all the lines are calculated from.
2. Inside Bar Highlighter
Automatically detects inside bars — candles whose entire range sits within the previous candle's range — and recolours the whole candle so they are easy to spot. The highlight colour is fully customizable. A Strict/Inclusive switch lets you choose between a true inside bar (current high below the previous high and current low above the previous low) or an inclusive version that also counts candles touching the previous high or low.
3. Liquidity Tag
Places a label above (or below) the most recent candle showing the stock's liquidity, formatted in crores by default (e.g. "405.98 Cr"). Three calculation methods are available:
20-Day Avg Liquidity (default): A 20-day volume-weighted average price multiplied by the 20-day average daily volume, which equals the average daily traded value. This is the most representative single gauge of how liquid a stock is, and because it is computed on daily data it reads the same on every chart timeframe.
Turnover (accurate): The current session's running sum of price × volume, built from 1-minute data so it tracks the broker's intraday turnover closely and stays consistent across timeframes.
Price × Day Volume (simple): Current price multiplied by the day's total volume — quick but drifts from true turnover as price moves.
The tag updates live on the latest candle, and its vertical position can be nudged above or below the candle using an ATR-based offset (positive places it above, negative below).
Inputs at a glance
Moving Averages: Source · per-line enable / EMA-SMA / colour / width
Inside Bar: enable highlight · highlight colour · strict vs inclusive
Liquidity Tag: enable · calculation method · averaging period (days) · value divisor (1 crore by default; set to 1 for raw value) · suffix · decimals · vertical offset · tag and text colour
Notes
The liquidity figure depends on the symbol having volume data. Cash equities have it; some indices and continuous-futures feeds do not, where the value may read 0.
Traded value is an estimate. TradingView provides one price per bar rather than every individual tick, so the turnover and 20-day methods are close approximations of exchange turnover rather than penny-perfect figures.
The crore (Cr) formatting suits Indian markets; change the divisor and suffix for other conventions.
This script is for chart analysis and educational use, not financial advice. Always validate signals with Indikator
Smart Market Structure ProDescription:
This indicator automatically detects and marks significant swing highs and swing lows using pivot-based market structure analysis.
Features:
Identifies Swing Highs and Swing Lows.
Labels market structure as:
HH (Higher High)
HL (Higher Low)
LH (Lower High)
LL (Lower Low)
Draws structure lines connecting consecutive highs and lows.
Helps traders visualize trend direction and market structure.
Suitable for Forex, Gold, Indices, Stocks, and Cryptocurrencies.
Works on all timeframes, including 1-minute charts.
How to Use:
A sequence of HH and HL indicates an uptrend.
A sequence of LH and LL indicates a downtrend.
Use market structure breaks as potential trend reversal signals.
Combine with support/resistance, moving averages, or supply and demand zones for better trade confirmation.
Recommended Settings:
Aggressive: Left Bars = 3, Right Bars = 3
Balanced: Left Bars = 5, Right Bars = 5
Conservative: Left Bars = 8, Right Bars = 8
Disclaimer:
This indicator is for educational and analytical purposes only and should not be considered financial advice. Always use proper risk management when trading. Indikator

Indikator

Indikator

Indikator
Indikator

Indikator

Strategie

Strategie
Indikator

Indikator

Indikator
Indikator
Indikator

Strategie

Indikator