Indikator

Indikator

Indikator

Indikator

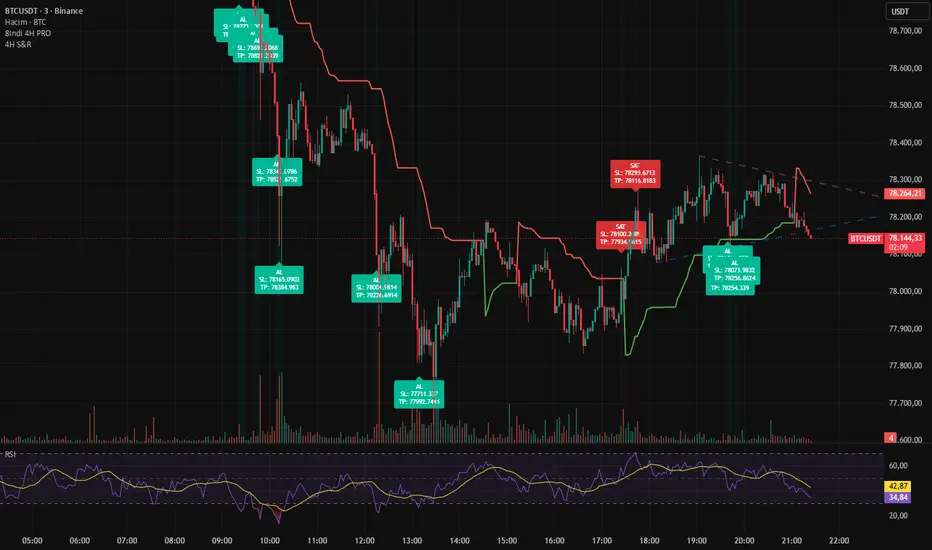
Clean MA Overlay PROClean MA Overlay PRO is a professional trend-following moving average system designed to combine clean market structure, volatility visualization, and real-time momentum strength analysis into a single lightweight overlay indicator.
Unlike traditional moving averages that only show direction, this indicator measures the true angle of the moving average using ATR-normalized slope calculations.
This creates a much more realistic representation of trend strength across all market conditions and timeframes.
The result is a highly responsive MA system optimized for fast trend recognition, momentum continuation, pullback filtering, and intraday trading — especially effective on indices like NASDAQ, US100, and high-volatility assets.
FEATURES
Adaptive Moving Average Engine
Choose between multiple MA types:
EMA
SMA
WMA
VWMA
RMA
HMA
The moving average can be applied to any source input and fully customized to match different trading styles.
True MA Angle Detection
The indicator calculates the actual MA angle using:
ATR-normalized slope
Configurable lookback distance
Real geometric angle conversion in degrees
This avoids the common problem of fake visual steepness caused by chart scaling.
The angle system classifies trend strength into:
WEAK
IDEAL LONG / SHORT
STRONG LONG / SHORT
EXTREME LONG / SHORT
This allows traders to instantly recognize:
trend acceleration
trend exhaustion
momentum shifts
weak ranging environments
Dynamic Momentum Coloring
The MA line changes color automatically depending on trend strength and direction.
Bullish Momentum
Soft Green → Ideal Long
Bright Green → Strong Long
Neon Green → Extreme Long
Bearish Momentum
Pink/Red → Ideal Short
Bright Red → Strong Short
Neon Red → Extreme Short
Neutral Conditions
Yellow → Weak or ranging market
This creates an instant visual momentum map directly on the chart.
Volatility Expansion Bands
The indicator includes dynamic standard deviation bands around the MA.
These bands help visualize:
volatility expansion
momentum compression
trend continuation zones
pullback areas
Two adaptive band layers are calculated:
Inner deviation band
Outer deviation band
The fill colors automatically adapt to market direction.
Clean Professional Design
The script was built with a minimalistic and distraction-free layout:
clean overlays
smooth fills
no unnecessary signals
lightweight performance
highly readable during fast market movement
Perfect for scalping, day trading, and momentum trading.
IDEAL USE CASES
NASDAQ / US100 scalping
Momentum trading
Trend continuation entries
Pullback filtering
Trend strength confirmation
Intraday trading
Volatility expansion analysis
HOW TO USE
Bullish Environment
MA turns green
Angle increases positively
Bands expand upward
The stronger the angle, the stronger the bullish momentum.
Bearish Environment
MA turns red
Angle becomes negative
Bands expand downward
Extreme angles often indicate strong directional momentum or possible exhaustion phases.
Weak / Sideways Market
MA turns yellow
Low angle values
Narrow volatility bands
Useful for avoiding low-quality entries during consolidation.
ANGLE SYSTEM EXPLANATION
The angle calculation is based on:
Moving average slope
ATR normalization
Mathematical arctangent conversion
This creates consistent angle readings regardless of zoom level or chart scaling.
Example:
5° → weak trend
10° → healthy trend
20°+ → aggressive momentum
25°+ → extreme trend conditions
OPTIMIZED FOR
NASDAQ M1 / M5
US Indices
Crypto
Volatile assets
Momentum environments
KEY ADVANTAGE
Most moving averages only show direction.
Clean MA Overlay PRO shows:
direction
momentum quality
trend intensity
volatility behavior
real trend angle
all in one clean overlay system. Indikator

Indikator
Indikator

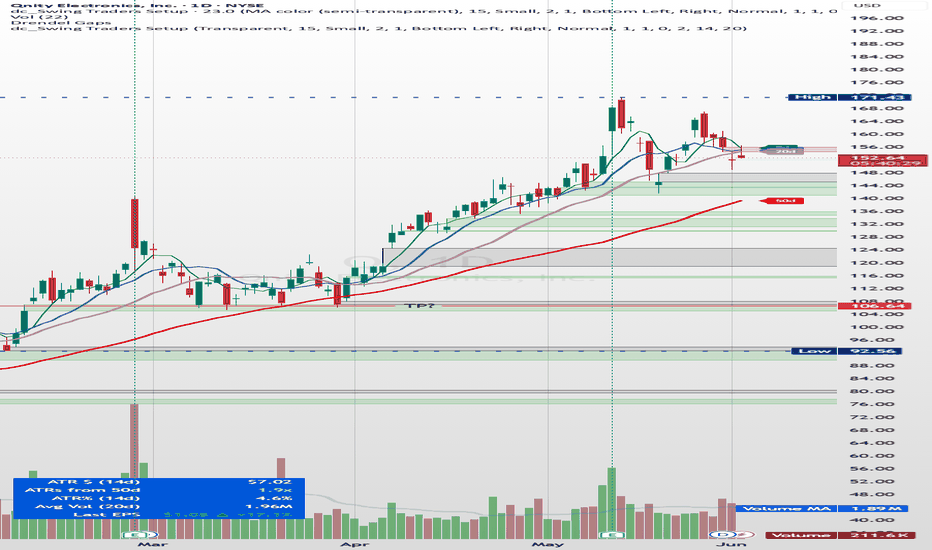
SRENG-OB + MTF Candles + SMACambodia-ICT Macro Pro v3.0 – Professional Smart Money / ICT Toolkit for serious day traders
This indicator combines the most requested ICT/SMC concepts into one clean, high-performance overlay tool – specially tuned for 1-minute to 15-minute trading.
Main features:
• 10 predefined Macro session windows (Asian Midnight, Asian, Pre-London, London Open, London Macro, NY AM, NY Lunch, NY PM, NY Close + more)
• 7 fully customizable Killzones with your own times & colors
• Beautiful session boxes that expand in real-time + show final range & name
• Liquidity dashboard showing:
- Recent swing high/low liquidity
- Daily high/low
- Weekly high/low
- ADR 50% & 100% levels
• Liquidity sweep detection + displacement confirmation labels
• Advanced 1-minute optimized Consolidation detector (6-factor scoring)
- Range contraction
- Inside bars / overlapping candles
- Body size compression
- Trapped at key levels
- No recent displacement
- Flat EMA + visual patterns
• Micro-breakout & fakeout (wick grab) detection inside consolidations
• Liquidity Heatmap – visual strength zones based on equal highs/lows, tight ranges & price clustering
• True Move / Fakeout detector after strong displacement candles
• Inducement (low body % + big wick) lines + Equal highs/lows marking
• Real-time session behavior label (current direction, range %, expected ICT narrative)
• Beautiful tables:
- Session status overview
- Consolidation checklist (shows which factors are active)
- Liquidity distance & % table
- ADR & range statistics
Best used on:
• Forex majors & indices (especially 1 min – 5 min)
• High-liquidity sessions (London & New York)
Style & performance:
→ Clean dark theme friendly colors
→ Many elements can be turned off (heatmap, tables, labels, etc.)
→ Optimized object count – should run smoothly even on lower timeframes
Perfect for traders who follow ICT concepts (Power of 3, liquidity grabs, inducement, displacement, consolidation → expansion, session profiling, ...)
Enjoy responsible trading ✦
Not financial advice – just a visualization tool. Indikator

Indikator

Indikator

Volume Financial ProVolume Financial Pro is a smart volume indicator built for traders who operate across multiple asset classes, including Forex, Crypto, Commodities, Indices, and Stocks. It combines a Proxy Volume Engine with a candle-based delta intensity system to deliver meaningful volume analysis even on platforms that do not provide real volume data.
━━━━━━━━━━━━━━━━━━━━━━━━━━━━━
THE PROBLEM THIS INDICATOR SOLVES
━━━━━━━━━━━━━━━━━━━━━━━━━━━━━
Most retail brokers and CFD platforms — particularly those offering Forex, metals, and index CFDs — do not provide real volume data. The standard volume indicator on these platforms either returns zero, returns meaningless tick counts, or simply shows nothing. This makes volume-based analysis impossible for a large portion of the trading community.
Volume Financial Pro solves this with a built-in Proxy Volume Engine.
━━━━━━━━━━━━━━━━━━━━━━━━━━━━━
HOW THE PROXY VOLUME ENGINE WORKS
━━━━━━━━━━━━━━━━━━━━━━━━━━━━━
The indicator automatically detects the current symbol and maps it to a liquid equivalent source that provides real, reliable volume data. For example:
• XAUUSD → COMEX:GC1! (Gold Futures)
• EURUSD → FX:EURUSD
• BTCUSD → BINANCE:BTCUSDT
• NDQUSD → OANDA:NAS100USD
• AAPL → NASDAQ:AAPL
Over 80 symbols are mapped across all major asset classes. If the platform provides native volume, it is used directly. If not, the proxy volume is fetched and applied transparently — no configuration needed from the user.
━━━━━━━━━━━━━━━━━━━━━━━━━━━━━
DELTA-BASED COLOR SYSTEM
━━━━━━━━━━━━━━━━━━━━━━━━━━━━━
Each volume bar is colored based on sell intensity, calculated from the relationship between the candle body size and its full high-low range. This approximates the proportion of buying versus selling pressure within each bar.
• Bullish bars → cyan
• Bearish bars with moderate selling → light red
• Bearish bars with high selling intensity (above 60%) → dark red
This gives traders an immediate visual read on conviction behind each move — not just whether price went up or down, but how aggressively it was bought or sold.
━━━━━━━━━━━━━━━━━━━━━━━━━━━━━
EMA OVERLAY
━━━━━━━━━━━━━━━━━━━━━━━━━━━━━
An optional EMA (default: 9 periods) is plotted over the volume histogram to help identify trends in volume activity and spot anomalies such as volume spikes or dry-up zones that may precede price reversals.
━━━━━━━━━━━━━━━━━━━━━━━━━━━━━
SETTINGS
━━━━━━━━━━━━━━━━━━━━━━━━━━━━━
• EMA Length — adjustable period for the volume EMA (default: 9).
• Show EMA — toggle the EMA line on or off.
━━━━━━━━━━━━━━━━━━━━━━━━━━━━━
COMPATIBLE WITH
━━━━━━━━━━━━━━━━━━━━━━━━━━━━━
Forex majors, minors and exotics · Crypto (via Binance) · Gold, Silver, Platinum, Palladium · Oil and Natural Gas · Agricultural commodities · US Dollar Index · Major global indices: DOW, NASDAQ, S&P 500, Nikkei, DAX, FTSE, CAC, MIB, ASX, Hang Seng · Top US and European stocks.
━━━━━━━━━━━━━━━━━━━━━━━━━━━━━
NOTES
━━━━━━━━━━━━━━━━━━━━━━━━━━━━━
This indicator is an original work. The Proxy Volume Engine, symbol mapping table, and delta intensity color logic were developed independently by the author and do not derive from any existing published script.
Indikator

VWAP Daily Bands StandardVWAP Daily Bands is a volume-weighted average price indicator anchored to the daily session, enhanced with adaptive standard deviation bands designed to work accurately across all asset classes — including Forex, Crypto, Commodities, Indices, and Stocks.
━━━━━━━━━━━━━━━━━━━━━━━━━━━━━
THE PROBLEM THIS INDICATOR SOLVES
━━━━━━━━━━━━━━━━━━━━━━━━━━━━━
Most VWAP band implementations calculate standard deviation using only intraday price variance. This creates a well-known flaw: at the start of each session, when very few bars have been processed, the bands collapse to near zero and are practically useless. As the session progresses, the bands gradually widen — but asymmetrically, because early price swings distort the variance calculation.
This indicator solves that with a fixed daily ATR seed.
━━━━━━━━━━━━━━━━━━━━━━━━━━━━━
HOW THE ATR SEED WORKS
━━━━━━━━━━━━━━━━━━━━━━━━━━━━━
Before the session opens, the indicator fetches the previous day's closing price and ATR from the daily timeframe. These two fixed values are used to calculate a minimum band width that holds constant throughout the entire trading day — it does not fluctuate with intraday price movement.
The standard deviation used for the bands is then taken as the larger of two values: the real-time intraday price variance, or the fixed ATR-based seed variance. This means the bands are always at least as wide as the prior day's volatility warrants, while still expanding naturally when intraday price action is more volatile than usual.
The result is symmetric, stable bands from the very first bar of the session.
━━━━━━━━━━━━━━━━━━━━━━━━━━━━━
PROXY VOLUME ENGINE
━━━━━━━━━━━━━━━━━━━━━━━━━━━━━
Many brokers and CFD platforms do not provide real volume data. Without volume, a VWAP calculation loses its core meaning.
This indicator includes a built-in Proxy Volume Engine that automatically detects the current symbol and maps it to a liquid equivalent source with real volume data. For example, XAUUSD is mapped to COMEX:GC1!, EURUSD to FX:EURUSD, BTCUSD to BINANCE:BTCUSDT, and so on — covering over 80 symbols across all major asset classes. If the platform provides native volume, it is used directly. If not, the proxy volume is applied transparently with no action required from the user.
━━━━━━━━━━━━━━━━━━━━━━━━━━━━━
WHAT IS PLOTTED
━━━━━━━━━━━━━━━━━━━━━━━━━━━━━
• VWAP (white) — daily anchor VWAP calculated from HLC3, reset at the start of each session, weighted by effective volume.
• Upper bands (cyan) — 1σ, 2σ, and 3σ above the VWAP, indicating potential resistance or overbought zones.
• Lower bands (red) — 1σ, 2σ, and 3σ below the VWAP, indicating potential support or oversold zones.
━━━━━━━━━━━━━━━━━━━━━━━━━━━━━
SETTINGS
━━━━━━━━━━━━━━━━━━━━━━━━━━━━━
• Show Daily VWAP — toggle the VWAP line on or off.
• Show Band 1σ / 2σ / 3σ — toggle each band pair individually.
• Band Width Multiplier — scales all bands up or down proportionally (default 1.0).
• Daily ATR Period — controls how many days are used to calculate the ATR seed (default 5).
━━━━━━━━━━━━━━━━━━━━━━━━━━━━━
COMPATIBLE WITH
━━━━━━━━━━━━━━━━━━━━━━━━━━━━━
Forex majors, minors and exotics · Crypto (via Binance) · Gold, Silver, Platinum, Palladium · Oil and Natural Gas · Agricultural commodities · US Dollar Index · Major global indices: DOW, NASDAQ, S&P 500, Nikkei, DAX, FTSE, CAC, MIB, ASX, Hang Seng · Top US and European stocks.
━━━━━━━━━━━━━━━━━━━━━━━━━━━━━
NOTES
━━━━━━━━━━━━━━━━━━━━━━━━━━━━━
The VWAP calculation uses Pine Script's native HLC3-based volume-weighted average price as its mathematical foundation. The ATR seed mechanism, Proxy Volume Engine, and adaptive band logic are original contributions developed specifically for this indicator to address real limitations found in standard VWAP band implementations. Indikator

Indikator
Indikator
Indikator

Indikator

Indikator
Indikator

Strategie
Indikator

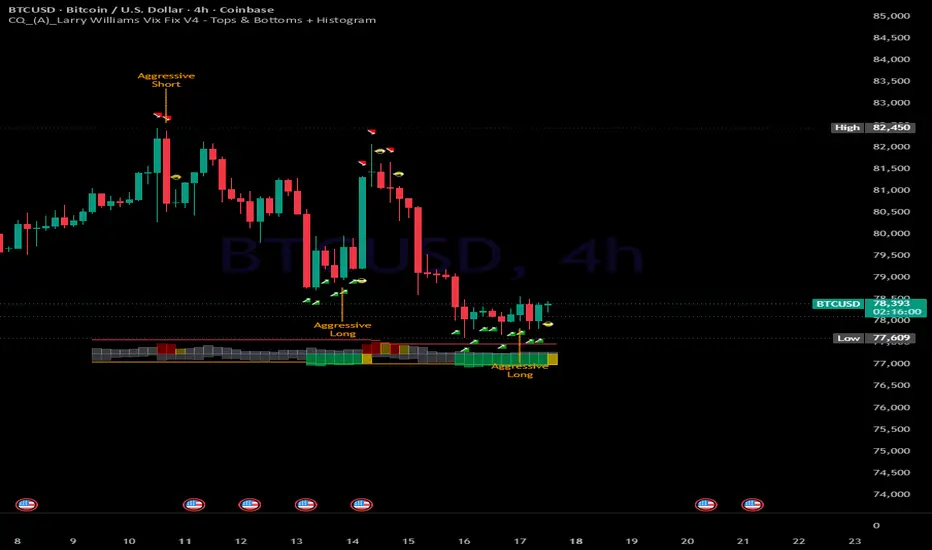
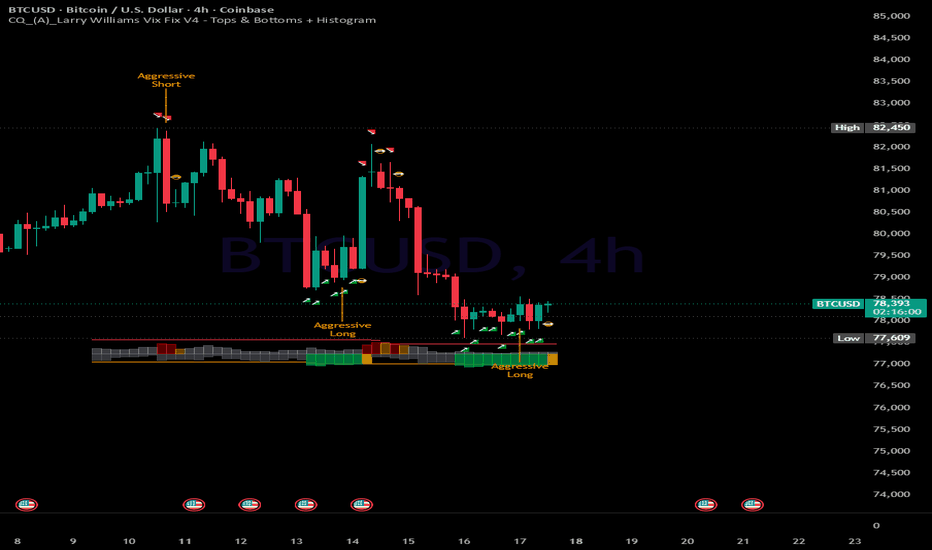
CQ_(A)_Larry Williams Vix Fix V4 - Tops & Bottoms + Histogram================================================================================
CQ_(G)_LARRY WILLIAMS VIX FIX V4 - TOPS & BOTTOMS + HISTOGRAM
Pine Script v6 | TradingView Overlay Indicator
Author: CQuevedo345
Based on open-source work by theehoganator
================================================================================
════════════════════════════════════════════════════════════════════════════════
PART I — WILLIAMS VIX FIX: THEORY & CONCEPTUAL FRAMEWORK
════════════════════════════════════════════════════════════════════════════════
────────────────────────────────────────────────────────────────────────────────
1. ORIGIN AND MOTIVATION
────────────────────────────────────────────────────────────────────────────────
The Williams VIX Fix (WVF) is a synthetic volatility indicator invented by
Larry Williams and published in a 2007 article in Technical Analysis of Stocks
and Commodities magazine. Its central goal was to replicate the informational
content of the CBOE Volatility Index (VIX) using nothing but price data,
making it applicable to any instrument and any timeframe — equities, futures,
forex, crypto, indices — without requiring access to options markets.
The VIX measures the implied volatility of S&P 500 index options, essentially
reflecting the market's collective expectation of near-term price movement.
When fear spikes — during crashes, sharp corrections, or unexpected shocks —
the VIX surges. When markets are calm and complacent, the VIX stays low. This
behavioral pattern makes VIX extremes valuable as contrarian timing signals:
peak fear often coincides with market lows, and peak complacency often precedes
market tops.
Williams's insight was that the same relationship could be approximated using
only the distance between the current price bar and recent price extremes. If a
bar's low has fallen far below recent highs, it reflects the same kind of
compression that produces VIX spikes — panic, forced selling, exhaustion. No
options data required.
────────────────────────────────────────────────────────────────────────────────
2. THE CORE FORMULAS
────────────────────────────────────────────────────────────────────────────────
STANDARD WVF (Bottoms / Fear Detection):
WVF = ( Highest Close over N bars − Current Low )
─────────────────────────────────────────── × 100
Highest Close over N bars
A large WVF value means the current low has fallen far below the highest recent
close. This mimics a VIX spike: the market has dropped sharply relative to
where it recently was, suggesting fear, capitulation, or oversold conditions.
High values are associated with potential market bottoms.
INVERSE WVF (Tops / Greed Detection):
Inverse WVF = ( Current High − Lowest Close over N bars )
─────────────────────────────────────────── × 100
Lowest Close over N bars
A large Inverse WVF value means the current high has extended far above the
lowest recent close. This is the mirror image: the market has run up sharply
relative to where it recently was, suggesting euphoria, extension, or overbought
conditions. High values are associated with potential market tops.
Both formulas are always positive. The Inverse WVF is used internally as a
negative series in the histogram engine so both can be rendered symmetrically
around a shared baseline.
────────────────────────────────────────────────────────────────────────────────
3. SIGNAL THRESHOLDS: WHEN IS A VALUE "ELEVATED"?
────────────────────────────────────────────────────────────────────────────────
A raw WVF number alone is not a signal. It must be evaluated against its own
recent statistical behavior. This indicator uses two independent thresholds,
and a value qualifies as elevated when it exceeds EITHER one:
BOLLINGER BAND UPPER BAND
The WVF series is itself treated as a data series. A Bollinger Band is
computed on the WVF values (not on price): SMA(WVF, bbl) + mult × StdDev.
When the current WVF value exceeds its own upper band, volatility is elevated
relative to its recent average behavior.
PERCENTILE RANGE HIGH
The highest WVF value over a long lookback (lb bars) is found, and a
percentile fraction (ph) is applied: RangeHigh = Highest(WVF, lb) × ph.
This ensures that signals only fire when the WVF reaches a historically
significant level relative to its own recent range. At ph = 0.85, the WVF
must reach 85% of its recent peak to qualify.
When EITHER threshold is breached, the WVF is "True" (active/elevated).
────────────────────────────────────────────────────────────────────────────────
4. THE PRIMARY SIGNAL: "WAS TRUE, NOW FALSE"
────────────────────────────────────────────────────────────────────────────────
Williams's original methodology did not recommend entering on the spike itself.
Extreme readings can persist for multiple bars, and entering during a spike
means buying into ongoing panic (for bottoms) or ongoing euphoria (for tops).
The cleanest signal comes when the elevation RESOLVES — when the WVF drops back
below BOTH thresholds on the bar immediately following an elevated reading.
This "Was True, Now False" condition represents the moment fear (or greed) has
peaked and is beginning to dissipate. Price has typically found at least a
short-term equilibrium, and the statistical anomaly is over. This is the bar
where the opportunity is most cleanly defined.
The indicator renders this as the ◓ (top resolution) and ◒ (bottom resolution)
half-circle glyphs, accompanied by a ➙ arrow — the primary actionable signals.
────────────────────────────────────────────────────────────────────────────────
5. FILTERED AND AGGRESSIVE ENTRIES
────────────────────────────────────────────────────────────────────────────────
Two additional layers of qualification improve signal timing and reduce noise:
FILTERED ENTRY (conservative, higher quality):
All of the following must be true simultaneously:
— WVF was elevated on the prior bar (Was True condition met).
— Price shows directional confirmation: for bottoms, close must be below the
long-term OR medium-term lookback close, confirming a downtrend context. For
tops, close must be above those levels, confirming an uptrend context.
— A price range confirmation: for bottoms, the low must be higher than the
prior low AND the close above the prior high (upRange). For tops, the high
must be lower than the prior high AND the close below the prior low
(downRange).
— A momentum confirmation: for bottoms, close must be greater than the close
N bars ago (str parameter). For tops, close must be less.
AGGRESSIVE ENTRY (permissive, earlier entry):
The WVF resolution requirement is relaxed — the entry fires while the WVF is
still elevated, rather than waiting for it to drop. The directional and
momentum conditions are still required, but the aggressive variant captures
potential entries before the spike has fully resolved. Higher risk, earlier
timing.
────────────────────────────────────────────────────────────────────────────────
6. PRACTICAL INTERPRETATION AND CONTEXT
────────────────────────────────────────────────────────────────────────────────
The Williams VIX Fix is fundamentally a MEAN-REVERSION volatility signal. Its
core assumption is that markets periodically overshoot driven by emotional
extremes — fear at bottoms, greed at tops — and that those extremes are
statistically identifiable and tend to resolve back toward equilibrium.
WHEN IT WORKS WELL:
— Ranging, cyclical, or oscillating markets.
— Higher timeframes (daily, weekly) where volatility spikes are meaningful.
— Instruments with clear boom-and-bust cycles (commodities, small caps, crypto
in trending cycles).
— As a filter layered on top of a directional thesis.
WHEN IT IS LESS RELIABLE:
— Strong, persistent trending markets (a bottom signal in a bear market may
just be a pause before continuation).
— Very low timeframes (1m, 5m) where noise drowns out meaningful signals.
— Instruments with structural volatility regimes that change over time.
The WVF does not predict direction — it identifies statistical extremes. The
trader's job is to determine whether that extreme is a reversal opportunity or
a continuation pause. Combining with trend filters (e.g. moving averages,
market structure) significantly improves reliability.
════════════════════════════════════════════════════════════════════════════════
PART II — INDICATOR MANUAL
════════════════════════════════════════════════════════════════════════════════
────────────────────────────────────────────────────────────────────────────────
7. OVERVIEW
────────────────────────────────────────────────────────────────────────────────
This indicator merges two separate tools into a single Pine Script v6 overlay:
COMPONENT A — TOPS & BOTTOMS LABELS (V4)
Detects potential market tops using the Inverse WVF and market bottoms using
the standard WVF. Signals are rendered as label markers directly on the price
chart — triangles, arrows, and text callouts above or below qualifying bars.
Each signal type has independent display toggles and alert line plots.
COMPONENT B — DUAL-MODE HISTOGRAM
Renders a proportional histogram of both WVF series (lows and highs) as
colored boxes anchored to the price chart. The histogram is configurable in
size, position, orientation, and color, and supports a split mode where the
two series are displayed on opposite sides of the visible price range.
Both components share a common set of core parameters and all outputs
(labels, boxes, lines, alert plots, alert conditions) are active simultaneously.
────────────────────────────────────────────────────────────────────────────────
8. ADDING THE INDICATOR
────────────────────────────────────────────────────────────────────────────────
1. Open TradingView and navigate to any chart.
2. Open the Pine Script Editor (bottom panel → Pine Editor tab).
3. Paste the full script and click Save, then Add to Chart.
4. The indicator renders directly on the price pane as an overlay.
5. Access all settings via the gear icon next to the indicator name on the
chart, or via the indicator title in the top-left of the pane.
────────────────────────────────────────────────────────────────────────────────
9. INPUT GROUPS AND PARAMETERS
────────────────────────────────────────────────────────────────────────────────
The settings panel is organized into seven groups:
┌─────────────────────────────────────────────────────────────────────────┐
│ GROUP 1: SHARED — Tops and Bottoms Variables │
└─────────────────────────────────────────────────────────────────────────┘
These parameters affect all calculations in both Component A (labels) and
Component B (histogram). Changing any of these alters every signal and every
histogram bar simultaneously.
LookBack Period Standard Deviation Default: 22
The N-bar window used in both WVF formulas. Controls the period over which
the Highest Close (for bottoms WVF) and Lowest Close (for tops WVF) are
computed. Smaller values make the indicator more reactive to recent price
action; larger values smooth out shorter-term fluctuations.
Bollinger Band Length Default: 20
The SMA and standard deviation period applied to the WVF series itself
(not to price). The upper band derived from this setting is one of the two
elevation thresholds.
Bollinger Band Standard Deviation Default: 2.0 (range: 1–5)
The multiplier applied to the standard deviation in the Bollinger Band
calculation. Higher values (e.g. 3.0) raise the threshold, reducing the
frequency of signals but increasing their statistical significance. Lower
values (e.g. 1.5) lower the threshold, producing more frequent but noisier
signals.
Look Back Period Percentile Default: 50
The lookback window used to find the highest WVF value for the percentile
threshold calculation. A 50-bar window means the indicator looks back 50
bars to find the peak WVF, then applies the Highest Percentile fraction.
Highest Percentile Default: 0.85
The fraction of the recent WVF range peak that must be reached to qualify
as elevated. At 0.85, the WVF must hit 85% of its 50-bar high to trigger.
At 0.90, 90% is required (more selective). At 0.99, only near-peak values
qualify (very selective, very rare).
Lowest Percentile Default: 1.01
The inverse multiplier used for the histogram's highs (inverse WVF) series.
Applied to the lowest WVF value in the lookback window. Used internally for
the histogram's upper threshold boundary for the tops series. Values above
1.00 raise the bar; 1.01 requires the highs WVF to reach 101% of its
recent trough (near-exact match to the extreme).
Long-Term LookBack (Filtered) Default: 40 (range: 25–99)
Used in filtered entry criteria. For bottoms, the close must be BELOW the
close 40 bars ago OR below the medium-term lookback to confirm that price
is in a downtrend context. For tops, close must be ABOVE it. Acts as a
trend context filter.
Medium-Term LookBack (Filtered) Default: 14 (range: 10–20)
The shorter of the two lookback comparisons for filtered entries. The OR
condition between this and the Long-Term LookBack means only one needs to
be satisfied — providing some flexibility in trend context detection.
Entry Price Action Strength Default: 3 (range: 1–9)
The momentum lookback. For bottoms, the close must exceed the close N bars
ago. For tops, the close must be below the close N bars ago. Larger values
require more sustained momentum to qualify.
Markers Label Size Default: Large
Size of the primary signal markers (◥ ↘ ◓ ➙ ◢ ↗ ◒). Options: Tiny,
Small, Normal, Large, Huge. Controls only the compact glyph labels.
Notes Label Size Default: Normal
Size of the extended text callouts (Filtered Short/Long, Aggressive
Short/Long with the vertical │ pointer lines). Kept separate from Markers
to allow the text to scale independently.
┌─────────────────────────────────────────────────────────────────────────┐
│ GROUP 2: TOPS — Text Plots Above │
└─────────────────────────────────────────────────────────────────────────┘
Controls which of the four top-signal label types are rendered above bars.
Show Plot: Inverse WVF IS True Default: true
Displays ◥ and ↘ labels above bars where the Inverse WVF is currently
elevated (above either threshold). This is the "active spike" state —
the market is in a statistically elevated top-side reading right now.
Two labels appear per qualifying bar (one triangle glyph, one arrow).
Show Plot: Inverse WVF WAS True, Now False Default: true
Displays ◓ and ➙ labels on the bar immediately after the Inverse WVF
drops back below both thresholds. This is the primary short signal — the
top-side spike has resolved.
Both of these toggles are in the TOPS — Text Plots Above group. The
Filtered and Aggressive toggles are in the TOPS — Filtered Criteria group
(see below).
┌─────────────────────────────────────────────────────────────────────────┐
│ GROUP 3: TOPS — Filtered Criteria │
└─────────────────────────────────────────────────────────────────────────┘
Show Plot: Filtered Short Entry Default: true
Renders the "Filtered Short │││" text callout above bars meeting the full
filtered criteria (WVF resolved + downRange + strength + trend context).
Show Plot: Aggressive Filtered Short Entry Default: true
Renders the "Aggressive Short │││" text callout when aggressive criteria
are met (WVF still elevated + strength + trend context, without waiting
for full resolution).
Long-Term LookBack — Close ABOVE this OR Medium-Term Default: 40
Tops-specific version of the shared long-term lookback. Close must be
above close or close to confirm an uptrend context for the
filtered short signal.
Medium-Term LookBack — Close ABOVE this OR Long-Term Default: 14
Tops-specific medium-term lookback, paired with the long-term above.
Strength — Close < X Bars Back Default: 3
Tops-specific momentum check. Close must be less than close (default),
confirming downward momentum is present on the signal bar.
┌─────────────────────────────────────────────────────────────────────────┐
│ GROUP 4: TOPS — Alerts │
└─────────────────────────────────────────────────────────────────────────┘
Four boolean toggles that control whether numeric alert line plots are
rendered for tops. When enabled, a plot outputs 1 on qualifying bars and 0
otherwise. These plots are used to create TradingView Alerts (see Section 12).
Alert: Inverse WVF = True Default: false
Plot goes to 1 when the Inverse WVF is currently elevated.
Alert: Inverse WVF Was True, Now False Default: false
Plot goes to 1 on the resolution bar (the primary short signal bar).
Alert: Inverse WVF Filtered Default: false
Plot goes to 1 when the full filtered short criteria are satisfied.
Alert: Inverse WVF Aggressive Filter Default: false
Plot goes to 1 when the aggressive filtered criteria are satisfied.
┌─────────────────────────────────────────────────────────────────────────┐
│ GROUP 5: BOTTOMS — Text Plots Below / Filtered Criteria / Alerts │
└─────────────────────────────────────────────────────────────────────────┘
Mirror image of Groups 2–4 for the standard WVF (bottoms detection).
All logic is identical but applied to the lows series. Labels appear below
bars. Summary of the parameters:
Show Plot: WVF IS True Default: true
◢ and ↗ labels below bars where WVF is currently elevated.
Show Plot: WVF WAS True, Now False Default: true
◒ and ➙ labels on the resolution bar. Primary long signal.
Show Plot: Filtered Long Entry Default: true
"Filtered Long │││" text callout when full criteria are met.
Show Plot: Aggressive Filtered Long Default: true
"Aggressive Long │││" text callout for aggressive criteria.
Long-Term LookBack — Close BELOW this OR Medium-Term Default: 40
For filtered longs, close must be below close or close .
Medium-Term LookBack — Close BELOW this OR Long-Term Default: 14
Paired with the long-term lookback above.
Strength — Close > X Bars Back Default: 3
Close must exceed close (upward momentum) to qualify.
Four alert toggles matching the tops group, for long-side signals.
┌─────────────────────────────────────────────────────────────────────────┐
│ GROUP 6: HISTOGRAM — Display Options │
└─────────────────────────────────────────────────────────────────────────┘
Flip Histogram Upside Down Default: true
When true, the histogram grows downward from the baseline (lows bars hang
below, highs bars hang above in the combined/flipped orientation). When
false, the orientation is inverted. Useful for visual preference or when
using Split mode.
Number of Bars to Show Default: 50 (range: 5–100)
How many of the most recent bars display histogram boxes. Older bars beyond
this count have no boxes drawn. Reducing this value improves performance
and reduces visual clutter on zoomed-out views.
Histogram Height (price units) Default: 300 (range: 200–600, step 25)
The total vertical span of the histogram, expressed in the chart's own
price units. The tallest bar within the visible window always fills this
full height; all other bars are scaled proportionally. Adjust this to match
the price scale of the instrument being analyzed — a stock at $500 needs a
much larger value than a forex pair at 1.08.
Split Histogram: Above highest/Below lowest Price Default: false
When false (combined mode): Both the lows (green) and highs (red) series
share a single baseline, placed below the lowest low of the visible window
at 120% of the barHeight offset. Lows grow upward, highs grow downward from
this shared baseline.
When true (split mode): The two series separate to opposite edges of the
visible price range. The lows series anchors 20% of barHeight below the
lowest low and grows outward from there. The highs series anchors 20% above
the highest high and grows outward. This gives an unobstructed view of both
series without overlap and relates them spatially to price action.
The Flip toggle swaps which series sits above vs. below.
Plot High/Low Range Lines Default: true
When enabled, a thin horizontal line is drawn at the percentile threshold
level for each bar. Orange lines for the lows series (Highest Percentile),
red lines for the highs series (Lowest Percentile). These lines show where
the threshold sits relative to each bar's actual WVF value.
Plot Standard Deviation Band Default: false
When enabled, a thicker line is drawn at the Bollinger Band upper/lower
band level for each bar. Aqua for lows, maroon for highs. Shows the moving
Bollinger threshold relative to the histogram bars.
Green Bars Needed to Trigger Alert Default: 1 (minimum: 1)
Controls the alertcondition() green bar logic. At 1 (default), a green bar
alert fires on the first bar the WVF reaches extreme territory. At 2, two
consecutive extreme bars are required before the alert fires. Useful for
filtering brief, noise-level spikes.
┌─────────────────────────────────────────────────────────────────────────┐
│ GROUP 7: HISTOGRAM — Colors │
└─────────────────────────────────────────────────────────────────────────┘
Eight color pickers controlling the visual appearance of the histogram boxes,
plus two line color pickers for the range and SD band lines.
WVF Lows — Extreme Default: semi-transparent green
Color of lows bars when the WVF is currently elevated (above threshold).
WVF Lows — Normal Default: semi-transparent dark gray
Color of lows bars during non-elevated periods.
WVF Highs — Extreme Default: opaque red
Color of highs bars when the Inverse WVF is currently elevated.
WVF Highs — Normal Default: semi-transparent gray
Color of highs bars during non-elevated periods.
WVF Lows — Reverted Default: semi-transparent gold
Color used for the lows bar on the single bar immediately after the WVF
drops from elevated to normal (the "Was True, Now False" moment). Visually
highlights the resolution event.
WVF Highs — Reverted Default: semi-transparent gold
Same as above, for the highs (Inverse WVF) reversion bar.
Show Reversion (Yellow) Histogram Bars Default: true
Toggle to enable/disable the reversion color. When disabled, reverted bars
display in their normal (non-elevated) color.
Range Line — Lows Default: semi-transparent orange
Color of the percentile threshold line drawn alongside each lows bar.
Range Line — Highs Default: semi-transparent red
Color of the percentile threshold line for the highs series.
SD Band — Lows Default: semi-transparent aqua
Color of the Bollinger Band level line for the lows series.
SD Band — Highs Default: semi-transparent maroon
Color of the Bollinger Band level line for the highs series.
────────────────────────────────────────────────────────────────────────────────
10. SIGNAL REFERENCE TABLE
────────────────────────────────────────────────────────────────────────────────
Signal Location Color Meaning
─────────────────────────────────────────────────────────────────────────
◥ Triangle Above bar Red text Inverse WVF IS True. Tops-side
volatility currently elevated.
↘ Arrow Above bar White on red Inverse WVF IS True. Directional
bias indicator (downward).
◓ Half-circle Above bar Gold on green Inverse WVF WAS True, Now False.
Primary short signal. Spike
resolved, sell-side opportunity.
➙ Arrow Above bar White on green Accompanies ◓. Resolution
confirmed.
Aggressive Above bar Orange text Aggressive Short. Inverse WVF
Short │││ still elevated; early short entry
with momentum/trend confirmation.
Filtered Above bar White text Filtered Short. Full criteria met:
Short │││ resolution + range + momentum +
trend context.
◢ Triangle Below bar Green text WVF IS True. Bottoms-side
volatility currently elevated.
↗ Arrow Below bar White on green WVF IS True. Directional bias
indicator (upward).
◒ Half-circle Below bar Gold on red WVF WAS True, Now False. Primary
long signal. Spike resolved,
buy-side opportunity.
➙ Arrow Below bar White on red Accompanies ◒. Resolution
confirmed.
│││ Below bar Orange text Aggressive Long. Early long entry
Aggressive while WVF still elevated.
Long
│││ Below bar White text Filtered Long. Full criteria met
Filtered for conservative long entry.
Long
────────────────────────────────────────────────────────────────────────────────
11. HISTOGRAM VISUAL GUIDE
────────────────────────────────────────────────────────────────────────────────
COMBINED MODE (bSplit = false, bFlip = true — defaults):
A single horizontal baseline is anchored below the lowest low of the
visible window. Green (lows) bars grow downward from this baseline, and
red (highs) bars grow upward from the same baseline. The tallest bar in
either series fills the full barHeight; all others are proportionally
scaled.
SPLIT MODE (bSplit = true):
The lows (green) series separates below price action, anchored 20% of
barHeight below the lowest low. The highs (red) series separates above
price action, anchored 20% of barHeight above the highest high. Each
series grows away from the price center — lows downward, highs upward
(or swapped if bFlip is true). This mode is ideal when you want the
histogram to frame the price action symmetrically.
BAR STATES:
Gray (low opacity): WVF value is within normal statistical range.
Green (extreme): WVF has exceeded the elevation threshold — lows spike.
Red (extreme): Inverse WVF has exceeded its threshold — highs spike.
Gold/Yellow: The bar immediately after an elevated reading drops back to
normal — the reversion bar, visually identical to the primary signal.
RANGE LINES:
Thin horizontal lines at the percentile threshold level (orange = lows,
red = highs). When a histogram bar exceeds its range line, it will be
colored in the extreme color.
SD BAND LINES:
Thicker lines at the Bollinger Band level (aqua = lows, maroon = highs).
When a bar exceeds this line, it also qualifies as elevated.
────────────────────────────────────────────────────────────────────────────────
12. SETTING UP ALERTS
────────────────────────────────────────────────────────────────────────────────
This indicator supports two types of alerts:
TYPE A — LABEL ALERT PLOTS (Tops & Bottoms, 8 plots):
These output 1 on qualifying bars and 0 otherwise. To use them:
1. Enable one or more Alert toggles in the TOPS — Alerts or BOTTOMS —
Alerts groups (e.g. "Alert: Inverse WVF Was True, Now False").
2. Open TradingView's Alerts panel (the clock icon or Alt+A).
3. Click Create Alert and select this indicator.
4. Choose the relevant plot (e.g. "Alert: Top Now False").
5. Set condition to "Crossing" or "Greater Than 0".
6. Configure notification method (email, push, webhook) and click Create.
Note: These plots are invisible on the chart by default. They output at
the price scale and are not intended as visual elements.
TYPE B — HISTOGRAM ALERTCONDITION (Green Bar Logic, 2 conditions):
These fire based on the histogram's bColorBars state (extreme readings).
They appear in the Alerts panel automatically without any toggle needed.
1. Open Alerts panel → Create Alert → select this indicator.
2. Choose "Williams Green Bar (LOWS)" or "Williams Green Bar (HIGHS)".
3. The alert fires when N consecutive extreme bars appear (where N is
set by "Green Bars Needed to Trigger Alert" in the Histogram group).
INVISIBLE HISTOGRAM ALERT PLOTS (8 additional plots):
Eight invisible plots (Hist Alert 1–4 Lows and 1–4 Highs) are also
available in the Alerts panel for more granular histogram-based alert
conditions. These correspond to the four filtered/aggressive stages for
each direction.
────────────────────────────────────────────────────────────────────────────────
13. RECOMMENDED SETTINGS BY USE CASE
────────────────────────────────────────────────────────────────────────────────
SWING TRADING (Daily / Weekly Charts)
Core parameters: pd=22, bbl=20, mult=2.0, lb=50, ph=0.85
Label signals: Enable WAS True, Now False only; disable IS True.
Histogram: Split mode on; 30–50 bars; height adjusted to chart.
Entry filter: Enable Filtered signals; disable Aggressive.
Alert: Alert: WVF Was True, Now False (both directions).
Note: On daily charts, one confirmed resolution bar per week or month is
a rich signal. Be patient and wait for the full resolution.
INTRADAY (15m / 1H Charts)
Core parameters: pd=14, bbl=14, mult=2.0, lb=30, ph=0.90
Label signals: Enable both IS True and WAS True, Now False.
Histogram: Combined mode; 20–30 bars; reduce height.
Entry filter: Enable Aggressive for faster reaction.
Alert: Green Bar alert at threshold 1 for instant reaction.
Note: Signal frequency increases sharply. Apply a trend filter separately
(e.g. compare to a 200 EMA on the same chart) to avoid counter-trend trades.
MEAN REVERSION / RANGE TRADING
Core parameters: pd=22, bbl=20, mult=1.5, lb=50, ph=0.80
Label signals: All four signal types enabled.
Histogram: Split mode for clear visual separation.
Entry filter: Enable both Filtered and Aggressive.
Note: Lower mult and ph makes signals more frequent. Suitable for range-
bound instruments where any WVF spike is likely to revert.
TREND FOLLOWING (using WVF as a pullback entry tool)
Core parameters: pd=22, bbl=20, mult=2.5, lb=50, ph=0.90
Label signals: Only WAS True, Now False; only Filtered entries.
Direction bias: Only trade Bottoms signals in an established
uptrend; only Tops signals in a downtrend.
Histogram: Use as a visual confirmation tool.
Note: In a strong uptrend, WVF Bottoms signals (fear spikes on pullbacks)
are often the best entries. Ignore all Tops signals in an uptrend.
────────────────────────────────────────────────────────────────────────────────
14. TECHNICAL ARCHITECTURE NOTES
────────────────────────────────────────────────────────────────────────────────
DUAL CALCULATION TRACKS:
The indicator maintains two separate calculation tracks for the WVF:
— inv_wvf / wvf: the label-driving track, used for all 12 label signals
and 8 alert line plots. These use ph as the sole percentile parameter.
— wvf_lows / wvf_highs: the histogram-driving track, identical in formula
to the above but using both ph and pl for separate high/low thresholds.
wvf_highs is a negative series (inverted sign convention) enabling
symmetric rendering around a shared baseline.
This separation ensures the label signals remain independent of the
histogram's additional pl parameter.
ARRAY-BASED DRAW ENGINE:
The histogram does not draw on every bar. Instead, 13 rolling arrays collect
values on every bar and are trimmed to nBars entries. On barstate.islast
(the final bar), a single loop draws all boxes and lines at once. This
approach ensures: (a) no ghost history bars, (b) a flat, stable baseline,
and (c) normalization against only the visible window's max value.
PINE SCRIPT LIMITS:
max_boxes_count = 500: at nBars=50 with 2 boxes per bar, 100 boxes are
used at any time. Well within the limit.
max_lines_count = 500: with hp=true and sd=false, 2 lines per bar = 100
lines. With sd=true, 4 lines per bar = 200 lines. Still within limits.
Labels are not bounded by a max_labels_count declaration, but TradingView
limits labels to 500 per indicator. With many signals enabled, this limit
may be reached on charts with long histories.
NON-REPAINTING:
All historical WVF calculations use ta.highest() and ta.lowest() on closed
bar data. These do not repaint. The "IS True" label condition is based on
the current bar's WVF value, which is provisional until bar close — treat
IS True labels on the real-time bar as unconfirmed until the bar closes.
────────────────────────────────────────────────────────────────────────────────
15. KNOWN LIMITATIONS
────────────────────────────────────────────────────────────────────────────────
— No built-in stop loss or target: the indicator identifies volatility
extremes and potential reversal zones. It does not compute or display price
targets, stop levels, or position sizing. These must be determined by the
trader independently.
— Histogram height is instrument-dependent: barHeight is expressed in price
units. A value of 300 works well for a $300 stock but is far too small for
Bitcoin at $60,000 or far too large for a forex pair. Adjust barHeight to
roughly 5–15% of the instrument's current price level as a starting point.
— Label accumulation on long-history charts: if all label types are enabled
and the chart spans many years on a high-frequency timeframe, TradingView's
500-label limit may be reached and older labels will be silently dropped.
Disable unused label types to conserve the label budget.
— Split mode positioning: in split mode, the baseline is computed from the
highest high and lowest low within the visible nBars window. Panning or
zooming the chart does not automatically recompute until a new real-time
tick arrives. The histogram will update on the next price movement.
— Histogram on instruments with very low prices (below $5): barHeight has a
minimum of 200, which may cause the histogram to extend far beyond the
visible chart area for very low-priced instruments. In this case, reduce
barHeight by editing the input constraints directly in the script.
================================================================================
© CQuevedo345 — Pine Script v6 — TradingView
Based on original work by theehoganator and Larry Williams
================================================================================ Indikator
Indikator

Indikator