Indikator
Breitenindikatoren

Percent Pivot DailyIndicatore che aiuta a individuare punti percentuali sul grafico. Nella fatti specie i quarti di punto percentuale
Indikator

Indikator

CHG% watchlist 10+ stocks (within .5%)Im a 15 year old coder/trader and i use CHG% to determine the stocks i trade so i made this indicator to show the Change % whilst in replay mode so i can backtest (:
Indikator

gold longer bulishThe US Dollar (USD) softens after reports that Iran’s Foreign Minister Abbas Araghchi is expected in Islamabad on Friday night, according to Al Arabiya. Iran’s state news agency IRNA said the visit is for talks with Pakistani officials, not with the US for now. Still, the news has slightly improved hopes for future talks, offering some support to Gold.
On the data front, the University of Michigan’s Consumer Sentiment Index fell to 49.8 in April from 53.3 in March. The Consumer Expectations Ind
Indikator

Indikator

Power Trend [Webster]Implements Mike Webster's Power Trend criteria:
Low has to be above 21 EMA for 10 consecutive days
The 21 EMA is above the 50 SMA for at least 5 days
the 50 SMA is in an uptrend
The final criteria:
Power Trend starts on an up day
Is intentionally not included based on commentary in WRO 68.
Rules:
initiation a Power Trend -
When one of the 3 criteria are met, a yellow dot appears.
When two of the 3 criteria are met, an orange dot appears.
When all 3 criteria are met, a green dot appears
whe
Indikator

umbul98-Doji RSI with Divergence🔹 1. Basic Logic
This indicator combines two things:
🕯 Doji candlestick pattern → Indecision/reversal signal
📈 RSI (Relative Strength Index) → Overbought/oversold condition
👉 So instead of a Doji alone:
It produces a more filtered signal with “Doji + RSI position”.
🔹 2. How is a Doji Detected?
The indicator defines a classic Doji as follows:
The candle body is very small.
The upper and lower wicks are close together (balance exists).
In the code:
Body = less than 5% of the total range
Indikator

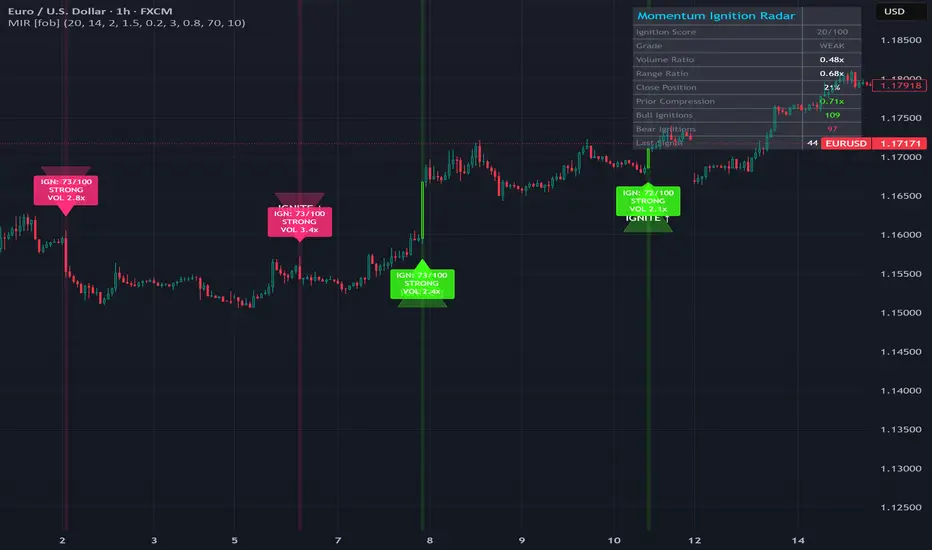
Momentum Ignition Radar [forexobroker]Momentum Ignition Radar detects "ignition events" -- bars where four independent conditions line up simultaneously to produce an explosive directional move. A volume spike, a range expansion, a close at the very edge of the bar, and a compressed prior window all combine into a single 0-100 Ignition Score. When the score breaches the threshold, the bar is classified as BUILDING, STRONG, EXPLOSIVE, or NUCLEAR, and a directional signal fires.
This indicator is designed for momentum traders who wan
Indikator
gold predactionGold (XAU/USD) price recovers some ground on Friday, extending its gains above $4,700 as market sentiment remains upbeat amid headlines from Iran and the US pointing to a resumption of second-round talks aimed at ending the conflict. At the time of writing XAU/USD trades at $4,726, up 0.47%
Middle East headlines kept investors optimistic about a diplomatic end to the war. However, traders must be aware that uncertainty remains high after scheduled talks at the beginning of the week failed as the
Indikator

gold anlysisGold trades modestly higher on the day above $4,700 after having touched a fresh 10-day low below $4,660 earlier in the day, but looks to end the week in negative territory. Intensifying US-Iran tensions over the Strait of Hormuz and the lack of progress in peace talks keep investors on edge. Moreover, reviving inflationary fears temper expectations for a more dovish US Federal Reserve and underpin the US Dollar, which is seen weighing on the yellow metal.
Indikator

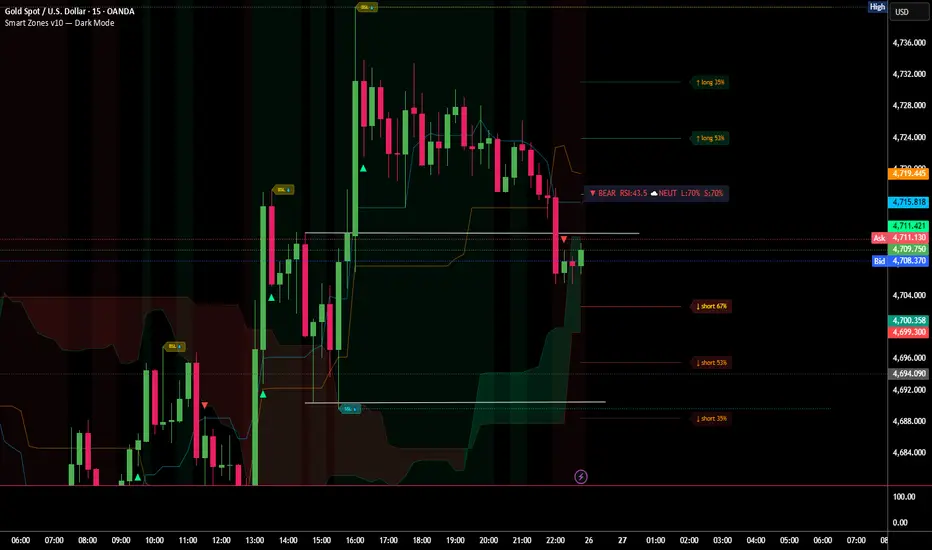
MU indicator ict The indicator plots 4 ICT concepts directly on your chart:
1. Fair Value Gaps (FVG)
Colored boxes that appear when there's an imbalance between 3 candles — price tends to come back and fill these. Green = bullish gap, Red = bearish gap.
2. Order Blocks (OB)
Boxes that mark the last candle before a big move — these are areas where institutions placed orders. Blue = bullish OB, Orange = bearish OB.
3. Liquidity Sweeps
Dotted lines at swing highs and lows (where stop losses cluster). When price wic
Indikator

RalisLine SpreadRalisLine Spread is a companion histogram for the RalisLine overlay. It measures the percentage gap between the fastest and slowest smoothed moving averages in a 4-SMMA ribbon, rendering that spread as a color-coded histogram below the chart. Gold bars above zero mean the ribbon is fanned out bullish — all four SMAs aligned with the fast line leading upward. Blue bars below zero mean bearish alignment. Gray bars appear when the ribbon is tangled — the inner lines disagree with the outer lines, i
Indikator

Market State Distribution Engine v2 [Breadth Model]Market State Distribution
Market State Distribution is a breadth-based market internals indicator designed to visualize the balance between demand and supply using underlying participation, structural strength, and leadership behavior.
Rather than relying on price alone, the model aggregates multiple internal components into a normalized framework to help evaluate whether conditions are improving, weakening, or transitioning.
This script is intended for educational and informational purposes
Indikator

RSI+EMA+WMA📊 RSI Custom EMA 9 & WMA 45 + Extreme Zones
RSI Custom EMA 9 & WMA 45 + Extreme Zones là một chỉ báo động lượng nâng cao, kết hợp giữa RSI truyền thống, đường trung bình động trên RSI (EMA & WMA) và vùng cực trị (Extreme Zones) để giúp trader xác định:
Xu hướng động lượng
Điểm đảo chiều tiềm năng
Phân kỳ (Divergence)
Vùng quá mua / quá bán mở rộng
⚙️ Thành phần chính
1. RSI (Relative Strength Index)
Sử dụng công thức chuẩn của Wilder (RMA-based)
Phản ánh sức mạnh và tốc độ của biến động giá
Cá
Indikator

Steph CAMARA Template + EMA100Template nom + EMA 100 intégrée. permet d'affiche un slogan et ton nom sur le graphique avec la moyenne mobile exponentielle 100
Indikator

ETH VWAP ATR Scalper Linesthis is the full ETH VWAP ATR Scalper Lines script, and it includes:
VWAP line.
Entry line.
Stop line.
TP1 line.
TP2 line.
BUY/SELL triangle signals.
Alert conditions.
Info label with ATR, VWAP, entry, stop, and targets.
Small note
This version does not include the stats table or box-style labels. It is the simpler line-and-triangle version you had before. If you want the one you liked best, that was the version with:
box-style BUY/SELL labels,
stats table,
and the same entry/stop/TP
Indikator

JRI SMC v22THE 7 CONDITIONS YOUR INDICATOR CHECKS
1. Bias — Is the market structure bullish (HH+HL) or bearish (LH+LL)?
2. In Zone — Is price inside a confirmed supply or demand zone?
3. BOS — Did price break a recent structure level in your direction?
4. Retest — Did price come back and test that broken level?
5. vs VWAP — Is price above VWAP for buys, below for sells?
6. EMA Stack — Is EMA 20 above EMA 50 for buys, below for sells?
7. RSI — Is RSI above 50 for buys, below 50 for sells?
All 7 point
Indikator

JRI SMC v17THE 7 CONDITIONS YOUR INDICATOR CHECKS
1. Bias — Is the market structure bullish (HH+HL) or bearish (LH+LL)?
2. In Zone — Is price inside a confirmed supply or demand zone?
3. BOS — Did price break a recent structure level in your direction?
4. Retest — Did price come back and test that broken level?
5. vs VWAP — Is price above VWAP for buys, below for sells?
6. EMA Stack — Is EMA 20 above EMA 50 for buys, below for sells?
7. RSI — Is RSI above 50 for buys, below 50 for sells?
All 7 point
Indikator
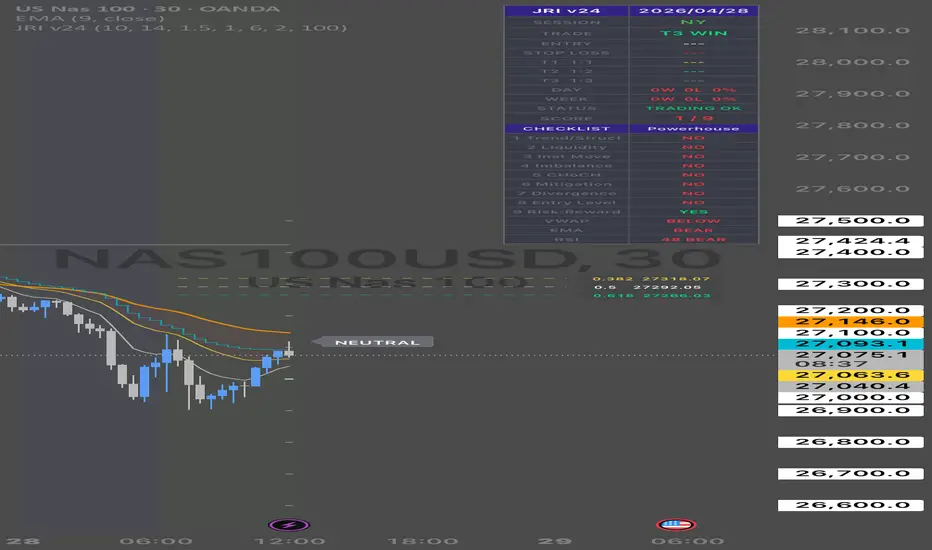
JRI SMC v15New update YOUR SESSION SCHEDULE
Your primary window is the NY Open — 6:30am PST. This is when the highest volume hits and the cleanest moves happen. Gold (MGC/GC) and NQ are your instruments. Run your top-down analysis the night before or early morning before the open. Have your levels marked, your bias set, your zones identified. When the open hits you’re ready to execute, not still analyzing.
Indikator

JRI SMC v12THE JRI SMART MONEY STRATEGY
Philosophy
You trade with institutions, not against them. Every decision flows from the higher timeframe down to the lower timeframe. You never enter on a lower timeframe without confirmation from above.
STEP 1 — WEEKLY (Big Picture)
Start here every week before you trade anything.
Find the ATH and ATL on the chart. These are your absolute boundaries — price respects these levels hard. Note whether the weekly candle is bullish or bearish. Is price making Higher High
Indikator

Indikator

Indikator
Gold Pro Strategy: EMA Cross (TP 1000, SL 500)1. จุดเข้า (Entry Point):
• Buy (Long): เข้าเมื่อ EMA เส้นเร็ว (9) ตัดขึ้นเหนือ EMA เส้นช้า (21) สะท้อนถึงโมเมนตัมขาขึ้นในระยะสั้น.
• Sell (Short): เข้าเมื่อ EMA เส้นเร็ว (9) ตัดลงใต้ EMA เส้นช้า (21) สะท้อนถึงโมเมนตัมขาลง.
2. การทำกำไรและตัดขาดทุน (TP/SL):
• TP (Take Profit): ตั้งไว้ที่ 1000 จุด (หรือ 10.00 USD สำหรับทองคำ) เพื่อเก็บกำไรในระยะกลาง.
• SL (Stop Loss): ตั้งไว้ที่ 500 จุด (หรือ 5.00 USD) เพื่อรักษาความเสี่ยงในอัตราส่วน Risk:Reward ที่ 1:2 ซึ่งถือว่าเป็นสัดส่วนที่ยอดเยี่ยมสำหรับนักเ
Strategie
