3 Types of Doji StarDoji types: 1. Standard Doji 2. Dragonfly Doji 3. Gravestone Doji Input: 1. EMA 2. Proportion (%) of Dragonfly & Gravestone Doji Indikatorvon JasonKurniawan79
Join data and union of 2 hystorical markets How to create a union from two contiguous Tradingview tickers (series) Francesco Marzolo March 18, 2021 Go to the older ticker of the two, for example CME: SP1! and open it on Tradingview. On the graph thus created, add this script. In the indicator settings select the same ticker as the chart in Symbol1 while in Symbol2 the ticker from which to retrieve the most recent data, for example: SPX500 The operation this script does is examine each bar of the two tickers, where there is a valuIndikatorvon franzb011
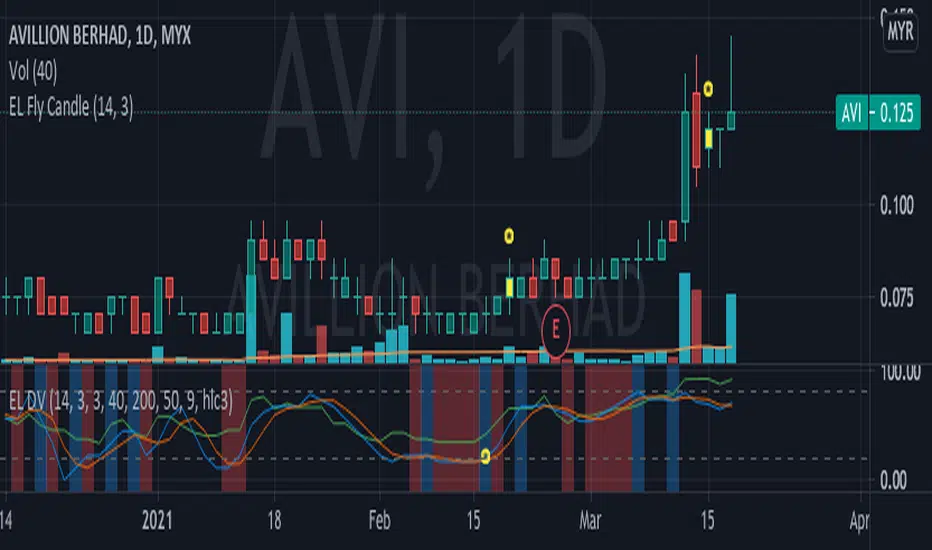
EL Fly Candle (spinning top) by Epullemanhighlight spinning top candle with alerted volume > vol sma 20 and stoch above 50Indikatorvon syaifulhs844135
Visual Candlestick Blender (Analysis Tool), by @BlueJayBird- This is a analysis tool. Brief Description - It generates candlestick containers for current timeframe, using OPEN/HIGH/CLOSE/LOW data from higher time frames. - Current version supports up to 4 CVB at the same time. Usually using only 2 is enough. - Vertical extended divisions for 1h, 4h, 1D and 1W using background lines are included too. * Report any bugs or feedback you have. NOTE. At current unclosed candlestick , some weird line painting it is expected. It is not a bug, it is a TradiIndikatorvon BlueJayBird8184
Wait for Signal ReminderThis script helps me to not enter trade in a rush 😅Indikatorvon UnknownUnicorn168027135148
Renko + CandlesThis indicator has been designed to show you both candle chart and Renko chart in one place. I think most of you are familiar with candle chart which is working with the time and price movements but Renko chart is based on price differences and is not related to the "time" parameter. so if you see a Renko brick is appear up(or down) to the previous brick it means that a certain and fixed price movement has been occurred (which mostly calculate by ATR). and also this indicator works in any time Indikatorvon salarkamjoo15 1.2 K
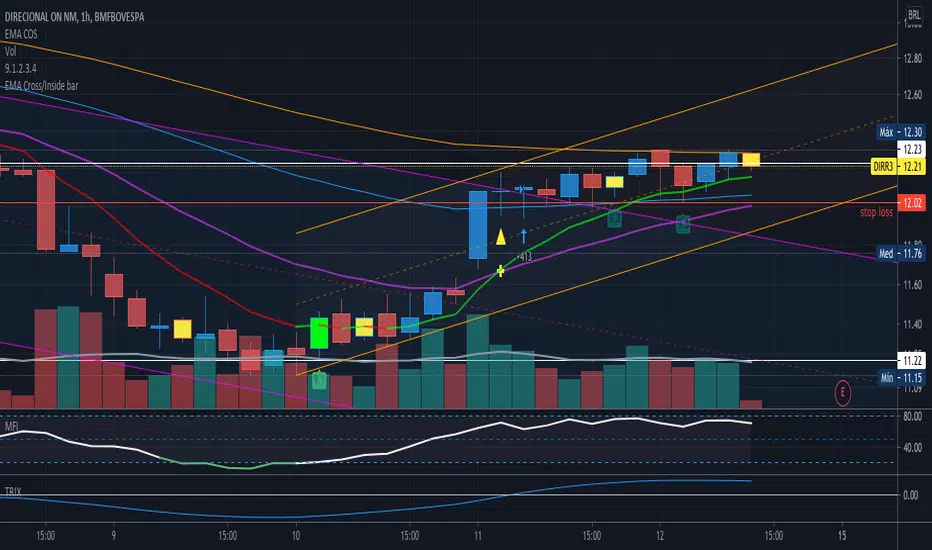
EMA Cross 9,21,50,80,200 + Inside barEste script faz o seguinte: 1. Plota 5 EMAs (9,21,50,80,200) 2. Faz crossover da 9x21 e 21x50 3. Colore inside bar em amarelo (é possível ainda colorir diferentemente bullish e bearish inside bar) Indikatorvon lavmagno1332
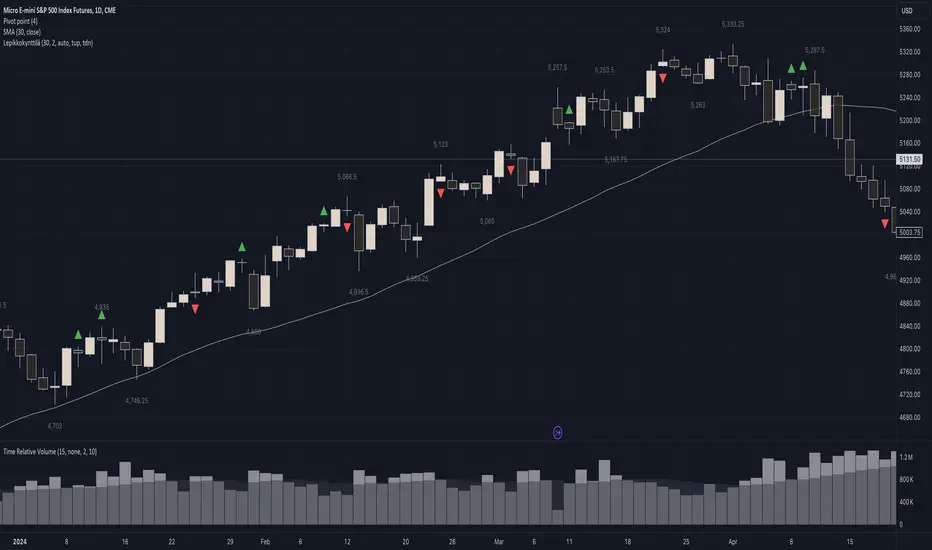
LepikkokynttiläSimple indicator highlighting Lepikkokynttilä. You can tweak wick sizes, body size relative to candle size and colors.Indikatorvon stormisAktualisiert 106
Digit Sum - NumerologyThis script calculates the digit sum of a chosen source. Only possible thanks to MichelT String to Number Script.Indikatorvon fireriderAktualisiert 390
Pinescript - Common String Functions Library by RRBCommon String Functions Library by RagingRocketBull 2021 Version 1.0 Pinescript now has strong support for arrays with many powerful functions, but still lacks built-in string functions. Luckily you can easily process and manipulate strings using arrays. This script provides a library of common string functions for everyday use, such as: indexOf, substr, replace, ascii_code, str_to_int etc. There are 100+ unique functions (130 including all implementations) It should serve as building blocks toIndikatorvon RagingRocketBullAktualisiert 17145
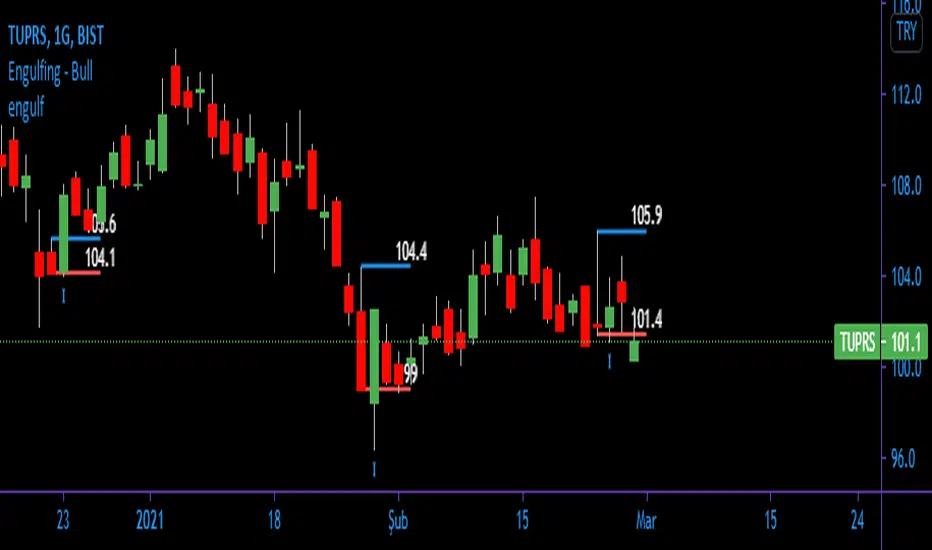
engulfing bullishengulfin bullish The support and resistance lines of the previous candle are drawn. You can choose the lines in any length you wantIndikatorvon GokhanGoksin2220
B3_HH_LL_Break Bar PainterThis is a simple Highest High or Lowest Low Breakout Painter. Defaults in the order that they may color bars - checks top color first: where n = your input length BLACK = Outside Bar HHLL(n) RED = Lower Low LL(n) GREEN = Higher High HH(n) BLUE = Inside Bar HHLL(n) You may customize the colors in the indicator's settings-cogwheel on the chart. Enjoy! d^.^bIndikatorvon HammondB3136
Open Close Percentage ChangeSimple indicator to the plot percentage change of the candleIndikatorvon UnknownUnicorn157247482154
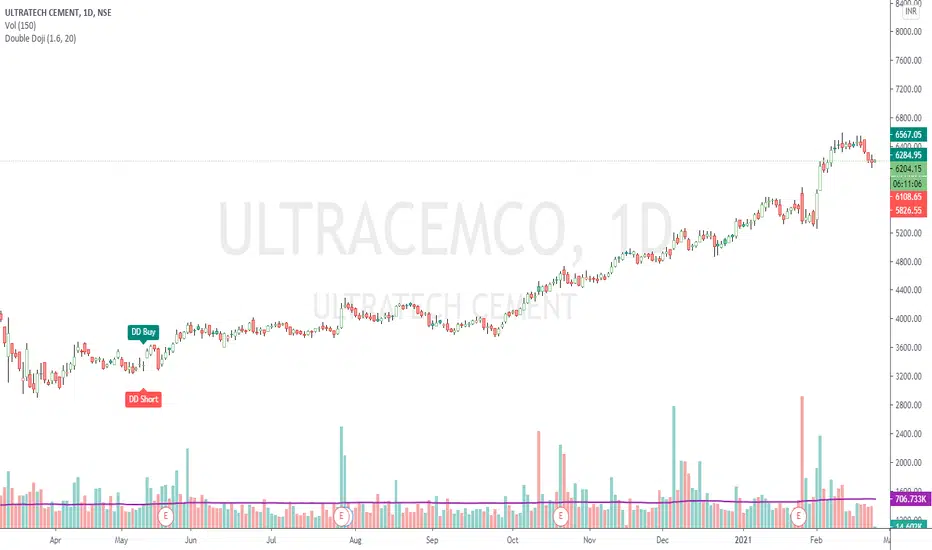
Double DojiStrategy Kiss = 'Keep It Simple, Stupid' or 'Keep It Simple, Smart' The script simply identifies 2 consecutive Doji candles, and calculates Target on both the sides for given Reward : Risk factor. The High-Low to Open-Close ratio is set to default value 20. The Reward : Risk ratio is of default value 2. Both can be set to values of your choice. Accuracy best on Daily chart. Can be tried on any timeframe though. Trading Rules: Buy at higher / Short at lower of the 2 candles, with other as Stop Indikatorvon SushilKothawade2229
ICMCBased on basic Nimblr TA, Momentum Candles combined with Breakout/Breakdown can detect a change in trend direction. Nimblr mainly categorizes candlesticks into Momentum (Body > 50%) and Indecision (Body < 50%) candlesticks. ⁕ shows Momentum Candles, others are Indecision Candles ↑ shows Breakout ↓ shows Breakdown Yellow lines show the current Indecision candle and white lines the past Indecision candle. Indikatorvon emohil6272
Bulkowski Top 10 Chart PatternsFrom Tom Bulkowski's ThePatternSite dot ComIndikatorvon traderofoptions5370
Random Synthetic Asset GenerationThis script generates pseudo-random asset data . Due to the nature of the random generator, it is impossible to use this indicator as input for other indicators because the instance of the script that the indicator is applied to will automatically be different from the instance that is plotted on the chart. Therefore, the idea is to use this script in other scripts (to make it possible to backtest on random data, for example). The script has four main input parameters. Random Number GenerIndikatorvon lejmerAktualisiert 13263
Open/High/Low/Close (OHLC) Lines with Configurable TimeframeThis script draws open/high/low/close (OHLC) lines for the previous bar from the configured timeframe. This enables you to use higher timeframes, like a daily chart and OHLC lines of the previous week.Indikatorvon Me_On_VacationAktualisiert 7509
Configurable Settlement/FixingThis script draws a horizontal line starting at the open price of each configured settlement/fixing bar.Indikatorvon Me_On_VacationAktualisiert 3156
Past and Upcoming Forex and NYSE Start/End Bar HighlighterThis script highlights the start and end of past sessions and also for upcoming sessions of the current day. Additionally, the start/end bars of the current day can be marked with a text label. Time zone parameters are available for all time parameters, so that local exchange times can be configured, without the need for manual time zone or daylight saving time (DST) adjustments. Tradingview’s internal time calculations take care of the conversion. For ease of use, the script comes preconfigurIndikatorvon Me_On_Vacation100
All Candlestick Patterns StrategyThis strategy uses the tradingview built in candlestick recognition.Strategievon Traaaderz4404
Trading Session Candles [NeoButane]█ OVERVIEW Display candlesticks for the selected session, regular or extended. █ CONFIGURATION Options to change include displaying the regular or extended session, timezone, session hours, and session days. █ CONCEPTS Meant for charts with longer trading sessions or to view only extended hours trading action on US stocks that have afterhours available. █ Notes For trading days, '23456' refers to Monday to Friday. Indikatorvon NeoButane2178
Ether (Ethereum) CME Gaps [NeoButane]Detects gaps in trading for CME's "Ether" cash-settled futures. This will show gaps as they happen on the 24/7 charts that crypto exchanges use. It is not usable on CME's tickers themselves, as gaps in trading are not displayed. This indicator will only display if viewing an ETH chart. More information on the CME ETH futures here: www.cmegroup.com Based on: What's different: CME's BTC and ETH markets trade the same hours, but one may hit a limit breaker while there may be a case where thIndikatorvon NeoButane5262
Vishwajit Nerkar [ stock genie ]this script points swing high, swing low and confuse candles on the chart.Indikatorvon sunnyt0225Aktualisiert 380