AG Pro HTF Bias Dashboard [AGPro Series]AG Pro HTF Bias Dashboard
Overview / What it does
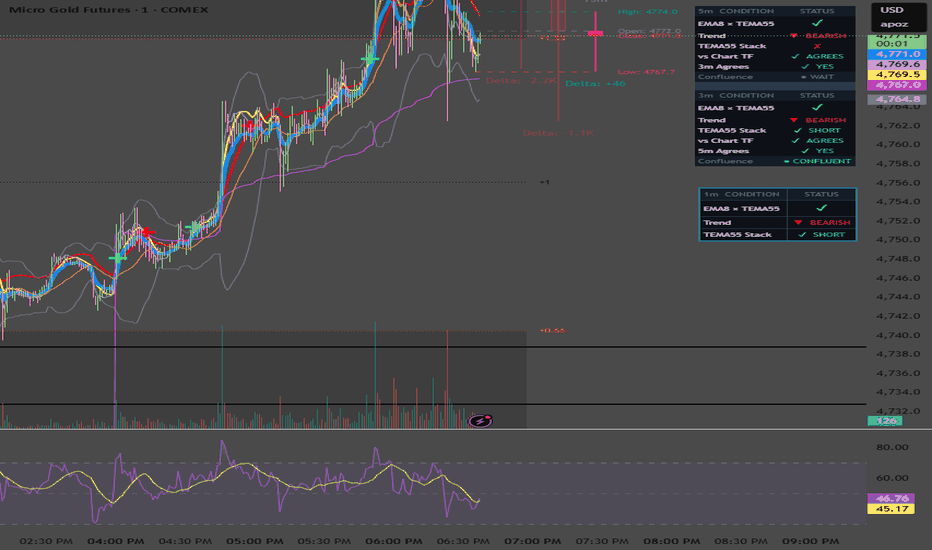
AG Pro HTF Bias Dashboard is a higher-timeframe context tool built for traders who want a fast, structured view of directional conditions across multiple larger timeframes without crowding the chart with extra signals, zones, or decision noise.
The script summarizes higher-timeframe bias in a compact dashboard and presents each selected row as Bull, Bear, or Neutral, together with a mode-specific status readout. The goal is not to predict the next candle or replace a full trade plan. The goal is to make larger-timeframe context easier to read at a glance.
This indicator is designed to answer a simple but important workflow question: "What is the broader directional environment across the higher timeframes I care about right now?" Instead of forcing the user to manually flip through multiple charts and compare structure or trend conditions one by one, the dashboard keeps that information visible in a single panel.
The script supports multiple bias engines so the same dashboard can be adapted to different styles of chart reading. Users can evaluate higher-timeframe context through EMA Stack alignment, confirmed Swing Structure, SuperTrend direction, or MACD Momentum agreement. This makes the tool flexible enough for trend-following traders, structure-based traders, and users who prefer momentum-style confirmation.
Unlike many overlays that try to combine entries, exits, alerts, pattern detection, and signal generation inside one study, this script stays focused on one task: higher-timeframe directional context. That single-purpose design is intentional. It keeps the output clean, readable, and easier to integrate into an existing process.
Unique Edge
The main strength of this script is not signal generation. Its edge is structured context compression.
Instead of plotting a large number of higher-timeframe elements directly on the chart, AG Pro HTF Bias Dashboard converts higher-timeframe conditions into a compact visual matrix. This makes it possible to assess multi-timeframe agreement quickly while keeping the chart itself relatively clean.
A second differentiator is the ability to switch the bias engine. The dashboard is not locked to one interpretation framework. Users can work with:
- EMA Stack, for ribbon-style alignment
- Swing Structure, for confirmed HH/HL and LH/LL progression
- SuperTrend, for ATR-based directional trend state
- MACD Momentum, for momentum agreement between line, signal, and histogram
Another important detail is the higher-timeframe validity filter. Rows that are not actually higher than the current chart timeframe are marked as Lower/EQ instead of being treated as valid higher-timeframe context. This helps keep the dashboard aligned with its intended purpose.
The script also includes confluence logic, so the user can see not only the state of each row, but also the dominant higher-timeframe bias and how many valid rows support that direction. In practice, this helps users distinguish between broad directional agreement and mixed conditions.
Methodology
The dashboard can display three to five higher-timeframe rows, depending on user settings. Each row evaluates one selected timeframe and classifies it into Bull, Bear, or Neutral.
Bias Mode options:
1) EMA Stack
This mode evaluates directional alignment using a three-EMA structure. A bullish state requires price and the EMA ribbon to be aligned in bullish order. A bearish state requires the opposite alignment. When the full sequence is not aligned, the row can remain neutral and display a partial status such as 2/3 or 1/3 rather than forcing a directional label.
2) Swing Structure
This mode uses confirmed pivot logic to read higher-timeframe structure. It looks for confirmed higher highs / higher lows or lower highs / lower lows, and then evaluates position relative to the active swing range. Because this logic depends on confirmed pivots, structure changes are naturally more selective and may appear later than faster trend models.
3) SuperTrend
This mode reads directional state using an ATR-based trend framework. It is intended for users who prefer a cleaner directional state model rather than ribbon alignment.
4) MACD Momentum
This mode classifies bias through agreement between the MACD line, signal line, and histogram. It is useful for traders who prefer momentum confirmation over structure or moving-average ordering.
The dashboard then calculates:
- the number of valid bullish rows
- the number of valid bearish rows
- the dominant higher-timeframe state
- the confluence count across valid rows
Optional chart context features are also included. Depending on settings, the script can color candles according to the active chart bias, plot the active EMA ribbon or SuperTrend on the chart, apply a subtle background tint when confluence is strong enough, and show a compact mini context tag on the chart.
States / Context Output
This indicator is a context dashboard, not an alert engine.
It does not generate buy or sell alerts, does not mark trade entries, and does not claim to identify optimal execution points. Its outputs are state-based and contextual:
- Bull
- Bear
- Neutral
- Confluence summary
- Mode-specific status text
The mini chart tag, when enabled, is only a compact summary of dominant higher-timeframe direction and current confluence. It should be read as context, not as a trade instruction.
Key Inputs
Higher Timeframes
Users can select three to five rows and define the exact higher timeframes to monitor.
Bias Mode
Choose between EMA Stack, Swing Structure, SuperTrend, and MACD Momentum.
Engine Parameters
The script exposes relevant inputs for each engine, including EMA lengths, Swing Strength, SuperTrend ATR settings, and MACD settings.
HUD Controls
The panel position and panel scale can be customized so the dashboard can fit different layouts and chart styles.
Style Controls
Users can adjust theme and directional colors for bullish, bearish, and neutral states.
Chart Context Controls
Optional features include candle coloring, active indicator plotting for EMA / SuperTrend, strong-confluence background tinting, mini context tag visibility, tag anchor, tag offset, and tag font size.
Limitations & Transparency
This script is not a prediction model. It summarizes directional context from user-selected higher-timeframe logic.
Higher-timeframe tools can update only when data from those larger intervals updates. Because of that, the dashboard should be understood as a context layer rather than a real-time trigger engine.
Swing Structure mode uses confirmed pivots. That means structure changes may appear later than faster directional methods, because confirmation requires completed pivot information.
Neutral states do not necessarily mean the market is untradeable. They simply indicate that the selected bias engine does not currently show clear directional alignment under the chosen rules.
The confluence count is a summary statistic, not a quality score. A larger number of aligned rows does not automatically mean a better trade. It only means more selected higher-timeframe rows currently point in the same direction.
Rows marked Lower/EQ are excluded from valid higher-timeframe confluence because they are not above the active chart timeframe.
This script is intended to support discretionary analysis and chart organization. It should be combined with the user’s own execution framework, risk model, and market understanding.
Risk Disclosure
This indicator is provided for analysis and educational use. It does not provide financial advice, investment advice, or guaranteed outcomes.
Market conditions can change quickly, and no single indicator or dashboard can remove uncertainty from trading or investing. Users should evaluate higher-timeframe context together with price action, liquidity, volatility, risk management, and their own decision process.
Past behavior, historical alignment, or current confluence does not guarantee future performance.
Indikator

Indikator

Indikator

Indikator

AG Pro Trend Continuation Quality [AGPro Series]AG Pro Trend Continuation Quality
Overview / What it does
AG Pro Trend Continuation Quality is an overlay built to evaluate whether a pullback is behaving like a healthy retracement inside an active trend, or whether the move is losing structural quality before continuation can develop.
Instead of treating every dip in an uptrend or every pop in a downtrend as equally important, the script isolates pullback sequences and scores them through a continuation-quality framework. The goal is not to predict every next candle. The goal is to help traders judge whether the market is showing disciplined retracement behavior that often precedes trend continuation.
The model combines trend alignment, pullback depth, pullback duration, relative volume behavior during the retracement, and the strength of the bounce candle that attempts to resume the trend. These conditions are translated into a compact quality score so the user can quickly separate cleaner continuation structures from weaker ones.
On the chart, the script highlights pullback zones, tracks the retracement box, displays a continuation-quality label, and maintains an information panel that summarizes trend state, recent quality readings, best quality, average quality, and internal distribution data. The result is a workflow-oriented continuation map rather than a simple trend-following overlay.
Unique Edge
The distinctive part of this script is that it does not label trend continuation from trend direction alone. A bullish EMA stack or bearish EMA stack is not enough by itself. The script specifically evaluates the quality of the retracement before the continuation attempt is scored.
That makes it meaningfully different from basic EMA trend tools, pullback highlighters, or single-condition continuation signals. Many tools can say that price is above or below an average. Fewer tools attempt to measure whether the internal anatomy of the pullback remains constructive for continuation.
The scoring engine focuses on five practical questions:
1. Is the broader trend aligned?
2. Is the pullback still structurally controlled rather than excessively deep?
3. Did the retracement last a reasonable number of bars?
4. Did volume contract during the pullback instead of expanding aggressively against trend?
5. Did the bounce show enough intent to suggest renewed directional participation?
This creates a cleaner framework for evaluating continuation setups in a way that is visual, systematic, and easier to compare across multiple pullbacks on the same chart.
Methodology
The script first determines directional context using EMA alignment and, when needed, swing-structure logic. This creates a working trend state that frames whether the script should be looking for bullish or bearish pullback behavior.
Once a directional leg is active, the script begins tracking a pullback when price retraces against that trend. During the retracement, it measures:
- how far the pullback travels relative to the prior trend leg,
- how many bars the pullback lasts,
- how pullback volume compares with the prior expansion leg,
- and whether the bounce candle shows convincing re-engagement.
These components are translated into a 0 to 10 quality score. Higher scores represent more orderly and structurally coherent pullbacks. Lower scores represent weaker or more suspect retracements.
The visual output is designed to make those evaluations easier to read in real time:
- pullback boxes frame the retracement zone,
- optional fib-depth line shows the deepest retracement point tracked inside the pullback,
- labels display score, quality grade, depth, duration, and relative volume,
- panel metrics summarize the current continuation environment.
Signals & Alerts
The script is designed as a quality-mapping tool, not as an automatic trade system.
Its event logic revolves around the completion of a pullback and the appearance of a bounce candle that attempts to resume the trend. When that bounce qualifies, the script calculates the final continuation-quality score and can display the setup if it meets the user-defined minimum score threshold.
Available workflow signals include:
- active bullish or bearish trend state,
- pullback in progress,
- completed pullback with scored continuation attempt,
- high-quality continuation events when the score reaches stronger thresholds.
Optional alerts can be used for:
- high-quality continuation conditions,
- or any scored pullback event, depending on user preference.
Because alerts are tied to the script’s scoring and confirmation logic, they are intended to support chart review and decision-making rather than act as guaranteed execution instructions.
Key Inputs
EMA Fast Length / EMA Mid Length / EMA Slow Length
These define the trend stack used to frame directional bias.
Swing Pivot Length
Controls the swing-structure sensitivity used in secondary trend detection.
Max Pullback Depth (%)
Defines how strict the script is when assessing whether a retracement remains healthy relative to the prior trend leg.
Min Pullback Bars / Max Pullback Bars
Controls the acceptable pullback duration window.
Volume Decline Ratio
Helps determine whether the retracement is occurring on lighter activity relative to the prior directional leg.
Minimum Score to Display
Filters weaker continuation events from the chart.
Label Size / Label Offset / Reduce Label Overlap
Lets the user adapt chart readability to their own zoom level and instrument volatility.
Panel Position / Panel Font Size / Panel Theme
Allows the continuation dashboard to be integrated into different chart layouts without dominating screen space.
Limitations & Transparency
This script does not know future market intent. It evaluates observable price and volume behavior after conditions form on the chart.
A high score does not guarantee continuation. It only indicates that the completed pullback meets the script’s internal definition of stronger continuation quality relative to other pullbacks.
The model is also sensitive to market regime. Trend continuation behavior tends to be clearer in directional markets and less reliable in highly compressed, erratic, or news-driven conditions.
Volume behavior can vary across instruments and data feeds. On some assets, especially where volume data is synthetic, limited, or structurally uneven, the volume component should be interpreted with caution.
Like other structure-based tools, this script can produce different practical usefulness depending on timeframe, instrument, volatility regime, and chart cleanliness. Users should calibrate inputs based on the market they are studying rather than treating defaults as universal settings.
This script should not be viewed as:
- a prediction engine,
- a standalone trade system,
- a replacement for risk management,
- or a guarantee that a bounce will develop into a full continuation leg.
Risk Disclosure
This script is for chart analysis and educational use. It is designed to help users study pullback quality inside established trends, not to provide financial, investment, or trading advice.
All trading and investing involve risk. Market conditions can change quickly, and even high-quality continuation structures can fail. Users should apply their own confirmation process, position sizing rules, and risk controls before acting on any market observation.
Use the script as a structured continuation framework, not as certainty.
Indikator

Strategie

Carrier Volatility [Pumori]Carrier Volatility
This is the foundational Pulse component of the ET Massif Framework research suite.
Description
Pumori is a high-resolution volatility and impulse response tool built around an ultra-short fractional length (0.1 EMA). It is a high-frequency carrier framework that exposes the formation of volatility through controlled instability rather than smoothing. Unlike traditional indicators that smooth or lag volatility, Pumori captures high-frequency energy, allowing volatility to be observed in near real-time as it forms.
Construct
At its core, Pumori uses:
Dual 0.1-length EMA
A sub-unit length (N < 1) is intentionally used to produce an anti-smoothing response, where the recursive term overreacts to incoming data and amplifies micro-movements. The EMA is applied twice recursively, producing a controlled oscillatory response. This interaction forms the carrier layer, where continuous oscillation exposes high-frequency volatility directly.
Flexible source input (RSI, RSI SMA, close, custom)
Three default source modes are available, allowing Pumori to operate across different domains. RSI is set as the default carrier as it represents normalized momentum in a bounded range, providing a stable domain for the transform. The chosen source defines how the carrier behaves and directly influences stability, noise profile, and interpretability.
Volatility Envelope
The recursive overshoot–correction cycle forces continuous oscillation around the source, forming a dynamic envelope that expands and contracts with volatility. Pumori does not measure volatility, it reveals volatility formation.
Think of Pumori like an AM radio carrier wave. The point is not signal transmission — it is that the carrier must operate at a high enough frequency for changes to become visible immediately. Most traditional volatility measures operate over a fixed lookback window, which makes them inherently lagging. Pumori Instead, it allows volatility to express immediately. The 0.1 EMA acts as a high-frequency baseline upon which expansion and contraction are directly observed.
Modes
Default
RSI is the default baseline configuration. because it provides a bounded and naturally oscillatory structure (0–100), allowing the carrier to behave in a stable and interpretable manner. Unlike price, which can expand unpredictably, RSI compresses extremes and standardizes movement, making volatility expansion and contraction easier to observe. The result is a clean carrier waveform that offers the best balance between responsiveness and readability.
Diagnostic
RSI (SMA) , the simple moving average of RSI is applied to the carrier transform. This reduces internal jitter while preserving underlying structure. It is used to assess movement quality, separating clean, controlled trends from noisy or chaotic trends.
Price
Applying it on price produces a highly reactive output where volatility expansion and contraction are expressed in a zig-zag band around price. The oscillations reflect immediate changes in movement and make volatility clustering visible within trend.
How to Use
Volatility Gauge
Band expansion indicates an active volatility state.
Band contraction indicates a suppressed environment
No volatility = no opportunity.
Market Progression
A low-volatility environment facilitates smooth, steady price progression. In contrast, high-volatility states produce a chaotic path characterized by erratic movement and uneven progression, signaling potential structural instability and reduced directional efficiency.
Future Development
Fractional EMA on price is further planned to be used as input component for adaptive filtering systems (e.g., Kalman filter integration). Specifically, the high-frequency oscillations of the volatility band provides a direct proxy for noise measurement, allowing dynamic adjustment of model responsiveness without introducing lag.
Default Settings
EMA Lengths: 0.1, 0.1
Default Mode: RSI (stable carrier behavior)
Diagnostic Mode: RSI SMA (reduced noise, structural clarity)
Price Mode: Close (Volatility clustering & envelop)
RSI Length: 14
RSI SMA Length: 14
日本語概要 (Japanese Summary)
Pumoriは、0.1という極短期間のEMA(指数平滑移動平均)を用いた高解像度なボラティリティ指標です。従来のATR(アベレージ・トゥルー・レンジ)のような遅行性の高い「平均型」ではなく、相場における瞬間的なボラティリティの拡張と収縮をリアルタイムに捉えることを目的としています。
主な特徴:
高精度なバンド形成: 価格データまたはRSIをベースに、ジグザグ状のボラティリティバンドを形成します。
ボラティリティの「発生」を直感的に把握: 従来の指標では見逃されがちな、微細な価格変化の初動(ボラティリティの発生)を直接観測可能です。
市場の質を識別: 相場が「滑らかなトレンド」にあるのか、あるいは「ノイズの多い不安定な状態」にあるのか、その動きの質を瞬時に判別できます。
中文概要(Chinese Summary)
Pumori 是一個基於 0.1 極短期 EMA 的高解析度波動率工具,旨在即時捕捉市場波動的擴張與收縮。不同於傳統 ATR 等滯後性的「平均型」指標,Pumori 能在第一時間反應波動的動態變化。
核心特點:
動態鋸齒型波動帶: 可靈活作用於價格、RSI 或平滑後的 RSI,形成緊隨走勢的動態帶狀區域。
捕捉「波動生成」: 直接觀測波動的初動與爆發,而非事後進行數值平均
高靈敏度動能偵測: 對市場動能變化極為敏感,能有效區分趨勢的平滑程度與市場雜訊(Noise)。
主要用途:
市場環境判斷: 辨識當前是否具備交易條件(穩定趨勢 vs. 混亂無序)。
波動品質分析: 評估市場走勢的品質,區分健康的波動與無效的雜訊。
進階算法基礎: 作為未來卡爾曼濾波器(Kalman Filter)進行波動調節的核心基礎。
Disclaimer:
This script is a research tool for market structure analysis and educational purposes only. It does not constitute financial advice. Trading involves risk. Indikator

Indikator

Pulse Heatmap [LB]
Pulse Reaction Heatmap
Overview
The Pulse Reaction Heatmap is a high-precision contextual price-reading indicator. It fuses an adaptive liquidity pulse with a dynamic volume density heatmap . Its core goal: reveal the "Market Footprint" —visually pinpointing price levels of institutional activity, liquidity absorption, and trend re-accumulation.
It delivers no mechanical signals; it spotlights zones primed for market reactions, defenses, or transitions .
Core Mechanism: The Pulse Line
Anchored by the Pulse , a hybrid trend-tracking line:
Adaptive Logic: Blends a Fast EMA ( 18 ) and Anchor EMA ( 34 ) to capture market equilibrium.
"Stickiness" Factor: ATR-based filter keeps it "glued" to price in consolidation, fluidly adapting during breakouts—eliminating the "lagging float" of standard MAs.
Dynamic Window: Pulse-centered workspace via multi-ATR , keeping the heatmap volatility-relevant.
Heatmap Construction & Scoring
Weighted scoring algorithm per bar in the lookback:
Conviction Weighting: Volume filtered by Body-to-Range ratio —large-body candles (low wicks) add max "conviction" density.
Positional Distribution: Weights across Full Range , Close (Acceptance) , and Wick Extremes (Test Levels) .
Temporal Decay: Older data fades mathematically (factor 0.978 ), prioritizing recent "hot" interest.
Visual Interpretation (Color Logic)
Gradient shows Market Interest Intensity :
Cold Zones (Blues/Greys): "Thin" liquidity; price slices through fast.
Intermediate Zones (Yellows/Oranges): Market Rotation —active order book equilibrium.
Hot Zones (Bright Red/Orange): Peak density; highly probable "accepted" prices for reactions/defenses.
Practical Trading Application
Confluence for AMT: Dynamic high-volume nodes and value areas as trends evolve.
Filtering Pullbacks: Target retraces into "Hot" zones for institutional defense confirmation.
Breakout Validation: Break + heatmap "re-densification" above = New Price Acceptance .
Important: The Pulse Reaction Heatmap is a Contextual Analysis Tool , not automated signals. Pair with Market Structure and Price Action to target true zones. Indikator

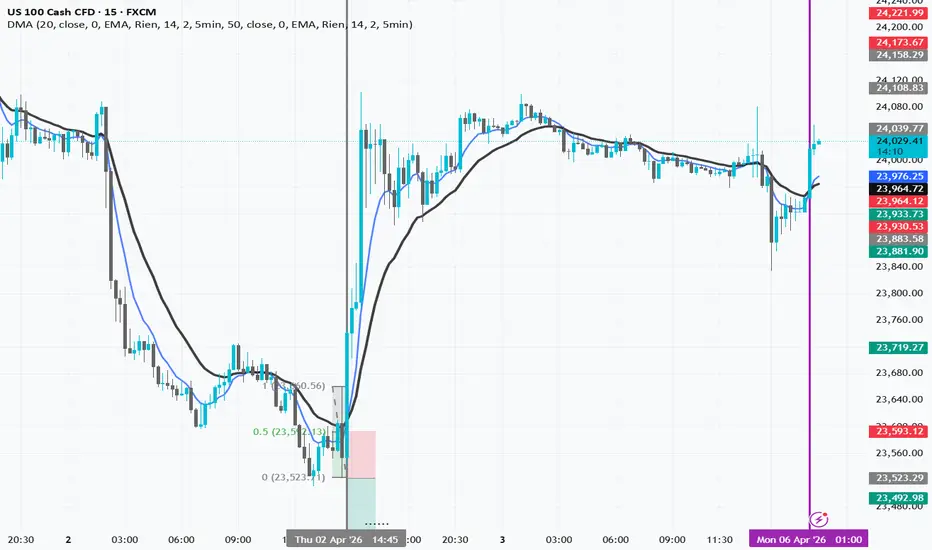
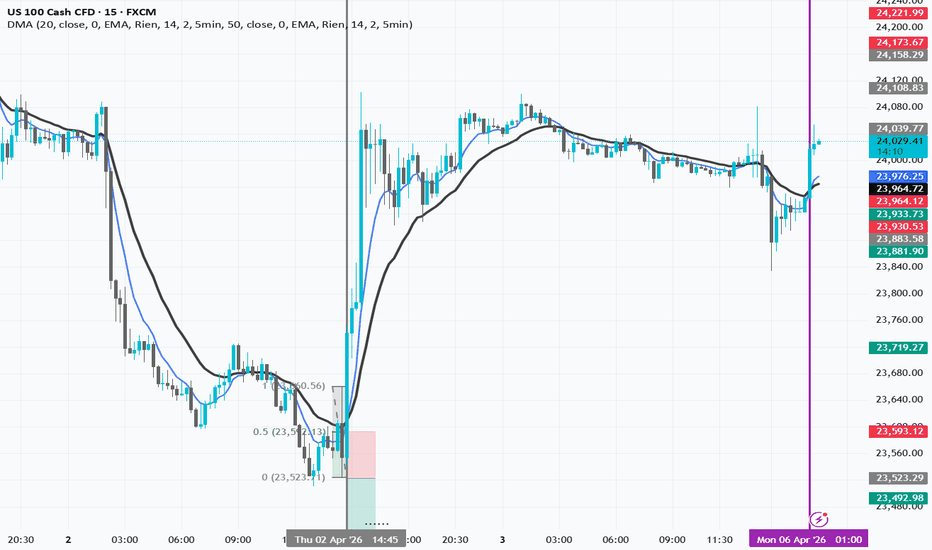
Double Moving Average## 📊 Double Moving Average (DMA)
**General Description:**
An indicator composed of two completely independent Moving Averages (MAs), each configured with its own parameters. Unlike a standard MA, each MA #1 and MA #2 can use a different timeframe, even if the chart displays another timeframe.
---
### **MA #1 - Parameters**
| Parameter | Default | Range | Description |
|-----------|---------|-------|-------------|
| **Enable MA #1** | ✓ | Yes/No | Activate/deactivate the first MA |
| **Length** | 50 | 1-500 | Calculation period of the MA |
| **Source** | Close | Open/High/Low/Close | Price source |
| **Offset** | 0 | 0-100 | Shift the curve to the right |
| **Type** | EMA | SMA/EMA/WMA | Type of moving average |
### **MA #2 - Parameters**
Identical to MA #1 but with default **Length: 200**
---
### **Smoothing - Per MA**
Each MA can have its own smoothing:
| Parameter | Options |
|-----------|---------|
| **Enable Smoothing** | Yes/No |
| **Type** | None / SMA / EMA / WMA |
| **Length** | 1-100 |
| **BB StdDev** | 0.1-10 (Bollinger Bands) |
---
### **Timeframe (Period) - Per MA**
Each MA calculates on an independent timeframe:
**Options:** 1min, 2min, 5min, 10min, 15min, 30min, 1hr, 2hr, 4hr, 1day
**"Wait for Close":** Waits for the timeframe candle to close before confirmation
---
### **Main Functions**
1. **`f_convert_timeframe()`** - Converts timeframe formats for Pine Script
2. **`f_calculate_ma()`** - Calculates SMA, EMA, or WMA
3. **`f_apply_smoothing()`** - Applies smoothing if enabled
---
### **Use Cases**
- Display short-term MA (5min) for scalping
- Display long-term MA (1day) for overall trend
- All on the same chart, independent of the displayed timeframe
- Compare two different trend periods simultaneously Indikator
Indikator

Indikator

Key Level SuiteKey Level Suite is a comprehensive label indicator that displays the most important price levels directly on your chart — always anchored to the right edge so they stay out of your price action and are easy to read at a glance.
Instead of drawing horizontal lines across the entire chart, Key Levels renders clean, minimal text labels at each price level. When multiple levels converge within a configurable threshold, they are automatically merged into a single label showing all contributing names (e.g. wVWAP | mH | pdVAH), making confluences immediately visible without any manual work.
📌 Levels Included
🔹 VWAP & Value Area (VAH / VAL)
Session VWAP with one standard-deviation bands for Daily, Weekly, Monthly, Quarterly, and Yearly periods.
🔹 Previous VWAP & Value Area
The final VWAP, VAH, and VAL from the completed prior session — Daily through Yearly.
🔹 Rolling VWAP & Value Area
Volume-weighted average price over rolling windows of 1, 7, 30, 90, and 365 days, each with its own VAH/VAL band.
🔹 Highs & Lows
Current and previous session high/low for all five periods.
🔹 Opens
Session open price for Daily, Weekly, Monthly, Quarterly, and Yearly.
🔹 EMA (10 slots)
Up to 10 exponential moving averages with independently configurable length and timeframe per slot. Leave the timeframe blank to use the chart timeframe.
⚙️ Settings
Style
Choose label text size: Tiny, Small, Normal, or Large.
Colors
Individual color pickers for each timeframe group — Daily, Weekly, Monthly, Quarterly, Yearly — plus separate colors for High/Low, Open, and EMA labels. All current, previous, and rolling levels of the same timeframe share one color, making it immediately clear which timeframe a level belongs to.
Merge
Enable or disable automatic label merging and set the proximity threshold as a percentage. Levels within this distance of each other are combined into a single label listing all contributing names — no more overlapping text at confluence zones.
VWAP / Previous VWAP / Rolling VWAP / Statics / EMA
Every individual level and group can be toggled on or off independently, so you only see what is relevant to your trading style. Indikator

AG Pro Moving Average Ribbon Stress Meter [AGPro Series]AG Pro Moving Average Ribbon Stress Meter
Overview / What It Does
This indicator is designed to read the internal condition of a moving-average ribbon rather than treating the ribbon as a simple trend overlay. Instead of asking only whether the ribbon is bullish or bearish, it asks a different question: is the ribbon structurally calm, starting to load, becoming strained, or losing internal order.
The script builds a six-line moving-average ribbon, measures how those averages interact with each other, and converts that interaction into a stress framework. The result is a visual map that helps show whether the ribbon is organized, stretched, unstable, or resetting after stress.
In practical terms, the script is built to help users evaluate ribbon quality, internal synchronization, and the degree of structural pressure inside the moving-average stack. It is not intended to forecast future prices, call tops or bottoms, or replace broader market analysis. Its purpose is to organize what the ribbon is doing now and how stable or unstable that structure appears to be.
The chart output combines multiple layers: the ribbon itself, a central stress spine, edge bands, optional stress aura, event labels, and a compact status panel. Together, these elements aim to make the ribbon easier to interpret without requiring the user to manually inspect every moving average line on every bar.
Unique Edge
Many ribbon-style tools focus on directional bias, crossovers, or broad expansion and contraction. This script focuses on internal ribbon stress.
Its main distinction is that it does not treat all ribbon trends as equal. A ribbon can be rising while still carrying internal disagreement. A ribbon can also look compressed or visually clean while underlying alignment, slope behavior, width dynamics, or price stretch are beginning to deteriorate. This script is built to surface those conditions.
The goal is not to reduce the market to a single signal. The goal is to provide a structured visual read on whether the moving-average stack is operating in a calm state, a loaded state, a strained state, or a more unstable condition. That makes it more useful as a workflow tool than as a simple trend-colour overlay.
Another point of differentiation is presentation. The script uses a ribbon-focused visual design so that the user can read internal condition directly from the chart. Focus modes, theme presets, stress spine layering, and a compact panel are included to keep the display informative without turning the chart into a dense dashboard.
Methodology
The script evaluates ribbon condition through five stress components.
1) Order Stress
This measures whether the moving averages are stacked cleanly or whether their order is becoming mixed. Lower stress suggests cleaner structural order. Higher stress suggests more internal disorder.
2) Slope Dispersion Stress
This evaluates how consistently the moving averages are sloping together. When the ribbon lines are moving with similar directional agreement, synchronization is stronger. When their slopes diverge, internal stress rises.
3) Width Instability Stress
This tracks whether the ribbon width is behaving in a stable or unstable way. A ribbon can widen in an orderly way or in a more erratic way. This component attempts to distinguish between those conditions.
4) Curvature Stress
This evaluates bending in the ribbon core. Strong changes in ribbon curvature may indicate increasing internal pressure or transition.
5) Price Stretch Stress
This measures how far price is moving from the ribbon core relative to ribbon width and ATR-based normalization. This is not a directional claim. It is a structure-based distance measure.
These components are weighted and blended into a smoothed Stress Score. That score then feeds the state engine.
Primary states include Calm, Loaded, Strained, Critical, Fractured, and Recovery. The panel and visual styling use those states to summarize the ribbon condition at the current bar.
Signals & Alerts
This script is built around state transitions and structural events rather than buy/sell promises.
Depending on settings, users may see event labels and alerts such as:
Stress Build
Shows that stress has crossed into an early loading phase.
Strained
Shows that the ribbon has moved into a more stressed internal state.
Critical Load
Highlights a higher-pressure condition where instability has become more meaningful.
Ribbon Fracture
Marks a stronger structural failure condition when stress and ribbon order deterioration align.
Stress Reset
Shows that a previously elevated stress condition has cooled enough to register recovery.
Order Restored
Highlights improvement in ribbon order after disorder had been present.
These events are not trade instructions. They are context markers intended to help users track shifts in ribbon condition. Alerts should be interpreted together with market structure, timeframe context, volatility, and personal risk management.
Key Inputs
Source and MA Type
The ribbon can be built from different moving-average types and data sources.
Ribbon Lengths
Users can define the six ribbon lengths to fit their preferred structure and timeframe.
Stress Engine Inputs
ATR length, slope lookback, width lookback, curvature lookback, smoothing, and component references allow users to calibrate how sensitive the stress model should be.
Weights
The script includes separate weights for order stress, slope dispersion, width instability, curvature stress, and price stretch stress.
Thresholds
Loaded, Strained, Critical, and Fracture thresholds can be adjusted for tighter or looser state transitions.
Theme Presets and Focus Mode
Theme presets and focus modes allow the ribbon to be displayed in different visual styles while preserving the same logic.
Events and Panel
Users can control label density, label spacing, marker visibility, and panel position.
Limitations & Transparency
This script is an interpretation framework built around moving-average relationships. It does not know future price movement, and it does not claim certainty. Like any model built on smoothed market data, it will react more slowly in some environments and may produce fewer useful transitions in others.
Different assets and timeframes can produce different ribbon personalities. A threshold or weight set that feels balanced on one market may feel too sensitive or too quiet on another. Users should expect to adapt settings if they move between instruments with very different volatility or trend behavior.
The stress model is also deliberately selective. It does not try to label every fluctuation or classify every candle. Its purpose is to organize ribbon condition, not to describe every possible market state.
This indicator should also not be confused with a complete trading plan. It does not define entries, exits, position sizing, or account risk. It is best used as a structural context tool inside a broader workflow.
Risk Disclosure
This script is for chart analysis and educational use. It is not financial advice, investment advice, or a promise of outcome.
No indicator can guarantee performance, remove risk, or eliminate false readings. Market conditions change, correlations shift, and trend behavior can weaken or reverse without warning. Any decision taken from this script should be made within a broader framework that includes price structure, liquidity, volatility, timeframe alignment, and risk control.
Users are responsible for testing settings, understanding the limitations of moving-average tools, and deciding whether the information produced by the script fits their own process.
Indikator

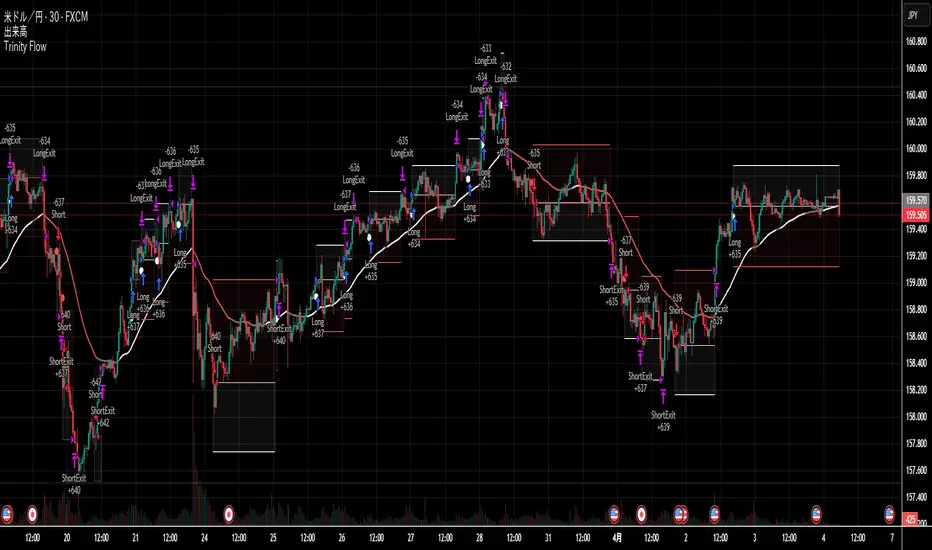
Trinity FlowOverview
This strategy is based on the trading method I used when I first entered the world of investing at age 20. While the original entry conditions and exit rules were quite rough, I've revived this approach with a sense of nostalgia, refining it into a modern form after years of experience.
Strategy Features
Trend Filter: Trend determination using three EMAs (8, 14, 50)
EMA alignment 8 > 14 > 50: Long condition (EMA line: White)
EMA alignment 50 > 14 > 8: Short condition (EMA line: Red)
Other alignments: Range/neutral (EMA line: Gray)
Entry Timing: Stochastic RSI (3, 3, 14, 14) crossover
Long entry on the bar following a confirmed golden cross
Short entry on the bar following a confirmed death cross
Risk Management: ATR (14) based fixed ratios
Stop Loss: ATR × 3
Take Profit: ATR × 2
Visual Design
White EMA line: Long opportunity zone
Red EMA line: Short opportunity zone
Gray EMA line: No clear trading opportunity
Light white box: Profit zone
Light red box: Loss zone
Parameters
All parameters (EMA periods, Stoch RSI settings, ATR period, SL/TP multipliers) are fully adjustable in the settings.
Disclaimer
Frequent false signals may occur in ranging markets
Works best in strong trending markets
Past performance does not guarantee future results
概要
このストラテジーは、私が20歳の頃、初めて投資の世界に入った時に使っていた手法を基にしています。当時は粗削りなエントリー条件と決済ルールでしたが、長年の経験を経て、懐かしさを感じながら現代的な形に復活させました。
手法の特徴
トレンドフィルター:3本のEMA(8, 14, 50)の並び順でトレンドを判定
EMAが8 > 14 > 50の順:ロング条件(EMAライン:白)
EMAが50 > 14 > 8の順:ショート条件(EMAライン:赤)
それ以外:レンジ状態(EMAライン:灰色)
エントリータイミング:Stochastic RSI(3, 3, 14, 14)のクロス
ゴールデンクロス確定後の次足でロングエントリー
デッドクロス確定後の次足でショートエントリー
リスク管理:ATR(14)ベースの固定比率
損切:ATR × 3倍
利確:ATR × 2倍
ビジュアルデザイン
白いEMAライン:ロング狙える状態
赤いEMAライン:ショート狙える状態
灰色のEMAライン:エントリーチャンスなし
薄い白ボックス:利益ゾーン
薄い赤ボックス:損失ゾーン
パラメータ
すべてのパラメータ(EMA期間、Stoch RSI設定、ATR期間、損切・利確倍率)は設定から調整可能です。
注意事項
レンジ相場では頻繁にダマシが発生する可能性があります
強いトレンド相場で最も効果を発揮します
バックテストの結果は過去のパフォーマンスであり、将来の結果を保証するものではありません Strategie

Strategie

SMC EMA CROSS ZIG ZAG# Mega Trend Suite – SMC + EMA (Lightweight Edition)
**A professional Smart Money Concepts (SMC) toolkit combined with classic EMA crossovers and VWAP.**
No Heikin Ashi, no MA Cross EMA – just clean price action, order flow, and trend confirmation.
---
## 🔍 Overview
This indicator bundles the most essential tools for **institutional-style analysis**:
- ✅ **SMC Structure** (internal & swing BOS/CHoCH)
- ✅ **Order Blocks** (bullish/bearish, with box or candle highlight)
- ✅ **Fair Value Gaps (FVG)** with auto threshold & multi‑timeframe support
- ✅ **Premium / Discount Zones** + Equilibrium line
- ✅ **Multi‑Timeframe High/Low levels** (Daily / Weekly / Monthly)
- ✅ **ZigZag** (main & internal) with HH/HL/LH/LL labels
- ✅ **VWAP** – anchored to the session
- ✅ **Two EMA sets** (9/21 & 20/50) with cross signals
- ✅ **Compact Dashboard** (SMC bias & current timeframe)
- ✅ **Full alert system** for all SMC events and EMA crosses
---
## 🧠 Key Features Explained
### 1. Smart Money Concepts (SMC)
| Component | What it does |
|-----------|---------------|
| **Swing Structure** | Detects Break of Structure (BOS) and Change of Character (CHoCH) on a higher‑length pivot (default 50). Shows labels “BOS” or “CHoCH” when price crosses a swing high/low. |
| **Internal Structure** | Same as swing, but uses a shorter length (default 10) to catch micro‑structure changes. Optional confluence filter (body vs. wick). |
| **Order Blocks (OB)** | Stores the extreme bar (parsed by volatility filter) after a valid BOS/CHoCH. Displays as zone boxes or candle highlights. Mitigation detection (close / high/low). |
| **Fair Value Gaps (FVG)** | Detects 3‑bar imbalances on a chosen timeframe (or current). Uses auto‑threshold based on historical bar delta. Extendable boxes. |
| **Premium / Discount Zones** | Calculates the range between the highest swing high and lowest swing low. Shades the upper 50% (premium) and lower 50% (discount) with an equilibrium line in the middle. |
| **MTF High/Low Levels** | Plots previous period’s high/low for Daily, Weekly, Monthly. Line style (solid/dashed/dotted) and color customizable. |
| **ZigZag** | Classic pivot‑based ZigZag with HH/HL/LH/LL labels. Separate internal ZigZag available for finer swings. |
### 2. VWAP
- Standard Volume Weighted Average Price.
- Useful for intraday bias – price above VWAP = bullish tilt.
### 3. EMA Sets
Two independent EMA pairs:
- **Set 1:** 9 & 21 (fast)
- **Set 2:** 20 & 50 (slower)
Each set plots its own lines and generates up/down triangles on crossover / crossunder. Colours, widths, and signal colours are fully adjustable.
---
## ⚙️ Input Parameters (Grouped)
### 🔧 Master Controls
- `Enable SMC Module` – turn all SMC features on/off.
### 📊 SMC – General
- `Mode` – Historical (keeps all drawings) / Present (refreshes each bar).
- `Style` – Colored / Monochrome.
### 📊 SMC – Structure & Order Blocks
- Internal / Swing lengths, label sizes, BOS/CHoCH filter (All / BOS only / CHoCH only).
- OB display mode (Both / Zone Box / Candle Highlight).
- OB mitigation source (Close / High/Low).
- OB filter (ATR / Cumulative Mean Range).
### 📊 SMC – Fair Value Gaps
- Auto threshold on/off, custom timeframe, extend bars.
### 📊 SMC – MTF High/Low Levels
- Show Daily / Weekly / Monthly – each with independent line style & colour.
### 📊 SMC – Premium / Discount Zones
- Toggle zones, custom colours for premium, equilibrium, discount.
### 📊 ZigZag Swing Lines
- Main ZigZag depth/deviation/backstep, colours, width, style, labels.
- Optional internal ZigZag with separate settings.
### 📈 VWAP & EMA Sets
- VWAP on/off, colour, width.
- Two EMA sets: each with fast/slow lengths, colours, line width, cross signal colours.
### 📊 Dashboard
- Position (Top‑Left/Right, Bottom‑Left/Right), font size.
### 🎨 Colors
- Global bull / bear / neutral colours (used in dashboard).
---
## 🖥️ Dashboard
A small table shows at a glance:
- **SMC Bias** – Bullish / Bearish / Neutral (based on swing trend).
- **Current Timeframe** – e.g., “60” for 1h, “D” for daily.
The dashboard adapts to dark/light chart background.
---
## 🚨 Alerts (30+ conditions)
All alerts are available from the TradingView alert dialog:
| Category | Alerts |
|----------|--------|
| **Internal Structure** | Bull/Bear BOS, Bull/Bear CHoCH |
| **Swing Structure** | Bull/Bear BOS, Bull/Bear CHoCH |
| **Order Blocks** | Bull/Bear Internal OB mitigated, Bull/Bear Swing OB mitigated |
| **Fair Value Gaps** | Bull FVG formed, Bear FVG formed |
| **EMA Crosses** | EMA Set 1/2 Bull Cross, Bear Cross |
---
## 🧩 How to Use
1. **Add the indicator** to any chart (any symbol, any timeframe).
2. **Keep default settings** for a clean SMC + EMA experience.
3. **For scalping / intraday:**
- Enable Internal Structure (length 5–10).
- Use VWAP as bias filter.
- Watch for FVGs on 1m–15m.
4. **For swing trading:**
- Focus on Swing Structure (length 50+).
- Use Premium/Discount zones for entries (buy in discount, sell in premium).
- Confirm with EMA Set 2 (20/50) cross.
5. **Order Blocks:**
- When price returns to a bullish OB zone, look for buying opportunities.
- When a bearish OB gets mitigated, expect continuation down.
---
## 💡 Tips
- **Monochrome style** is perfect for grayscale / minimalistic setups.
- **Present mode** keeps drawings only on the current visible bars – useful for low‑resource usage.
- **FVG auto‑threshold** works best on higher timeframes (1h+). For lower timeframes, you may turn it off and use manual threshold via the `barDelta` calculation (already built‑in).
- The **ZigZag** does not repaint – it uses confirmed pivots.
---
## 📜 Credits & Version
- **Original concept:** Mega Trend Suite (SMC + HAMA + MA Cross EMA)
- **This edition:** Removed HAMA, MA Cross EMA, and Heikin Ashi Smoothed – keeping only SMC, VWAP, and EMA sets.
- **Version:** 1.0 (Pine Script v6)
---
## ❗ Notes
- This indicator is **not a financial advice** – always use proper risk management.
- Maximum drawings (labels, lines, boxes) are set to 500 each – enough for several months of data.
- Multi‑timeframe levels (Daily/Weekly/Monthly) work correctly only if the chart has enough historical data.
---
**Happy trading!**
*Mega Trend Suite – SMC + EMA* Indikator

AG Pro EMA Ribbon Compression Map [AGPro Series]AG Pro EMA Ribbon Compression Map
Overview / What it does
AG Pro EMA Ribbon Compression Map is a ribbon-structure indicator built to read the internal condition of a multi-EMA cluster rather than the behavior of price around a single moving average. Instead of asking whether price reclaimed one reference EMA, this script evaluates how tightly the ribbon is compressed, how cleanly the EMAs are aligned, whether width is beginning to expand, and whether a developing move still looks organized or is starting to cool.
The default ribbon uses six EMAs and transforms their relative spacing into a visual structure that can be monitored directly on the chart. When the ribbon contracts, the script highlights coil conditions. When alignment and width expansion start to work together, it can mark bullish or bearish release conditions. When the ribbon is already wide and the expansion begins to lose energy, the script can flag fan-stretch / exhaustion behavior.
This makes the tool suitable for traders who want to study transition phases between compression, release, expansion, and late-stage cooling without reducing the chart to a single crossover event. It is designed as a structural read of ribbon behavior.
Unique Edge
The main objective of this script is not to provide another generic EMA ribbon display. Its edge comes from turning ribbon behavior into a state map.
First, it measures compression through normalized ribbon width rather than relying only on visual judgment. This helps distinguish between a ribbon that merely looks narrow and a ribbon that is statistically tight relative to its own recent behavior.
Second, it combines two layers of organization into one alignment read:
1) order agreement between the EMAs
2) slope agreement across the ribbon
This is important because a ribbon can appear stacked correctly while already losing directional integrity. By combining order and slope, the script attempts to separate cleaner directional structure from weaker, mixed, or transitional structure.
Third, the script focuses on release quality as a context event. A release is not treated as a simple EMA cross. It requires compression context, directional alignment, price location relative to the ribbon, and width expansion behavior. In practice, this helps frame release events as structural transitions rather than isolated triggers.
This also differentiates the script from single-EMA reclaim tools. AG Pro EMA Ribbon Compression Map is not built to analyze reactions around one anchor average. Its purpose is to interpret the internal geometry of the ribbon itself.
Methodology
The default ribbon is built from six EMAs:
8, 13, 21, 34, 55, and 89.
The script calculates the highest and lowest EMA in the group, derives ribbon width, and normalizes that width using ATR. It then compares the normalized width to its own historical range over the selected compression lookback. From this process, a Compression Score and an Expansion Score are derived.
Alignment is built from two components:
- EMA order agreement
- EMA slope agreement
If the ribbon is fully stacked in one direction and most slopes support that direction, alignment improves. If order and slope start to disagree, alignment weakens and the state can shift toward mixed / disorder behavior.
The state logic is designed around the following structural phases:
- Bullish Coil
- Bearish Coil
- Tight Compression
- Bullish Release
- Bearish Release
- Bullish Expansion
- Bearish Expansion
- Mixed / Disorder
- Fan Stretch / Exhaustion
- Transition
The visual model is intended to keep the chart readable while still making the ribbon feel alive. Compression and release are not presented as forecasting claims. They are chart states derived from ribbon width, order, slope, and price position relative to the ribbon.
Signals & Alerts
This script can display event labels for key structural transitions and can generate alerts for the most important state changes.
Available alert conditions include:
- Bullish Ribbon Release
- Bearish Ribbon Release
- Ribbon Compression Start
- Ribbon Compression Exit
- Ribbon Exhaustion
In practical use, traders may choose to treat these alerts as workflow signals rather than standalone decisions. For example, a compression start can identify a tightening structure worth monitoring. A bullish or bearish release can indicate that the ribbon is transitioning out of compression with directional alignment. An exhaustion event can indicate that a previously expanding ribbon may no longer be accelerating.
The script also includes an on-chart panel that summarizes:
- current state
- compression score
- alignment score
- directional bias
- width condition
Key Inputs
Ribbon Settings
- Six EMA lengths
- price source
Compression Engine
- ATR length
- compression lookback
- compression threshold
- minimum width expansion
- slope lookback
- exhaustion threshold
Visual Settings
- ribbon fill visibility
- event label visibility
- panel visibility
- optional bar tinting
- label size
- panel position
- label density and cooldown controls
These settings allow the script to be adapted to different instruments and timeframes. Users can keep the default ribbon structure or study how different EMA sets behave across their own workflow.
Limitations & Transparency
This script is not a prediction engine. It does not know whether a compression will resolve into continuation, reversal, or failed expansion. It reads ribbon structure; it does not guarantee outcome.
Compression is a contextual condition, not a trade confirmation by itself. A tightly compressed ribbon can remain compressed longer than expected. Likewise, a release event can still fail if the move does not continue.
Alignment is based on moving averages and slope behavior, which means the script is responsive to structure but still derived from lagging calculations. That tradeoff is intentional: the goal is to improve structural clarity, not to eliminate lag altogether.
The indicator is also not a substitute for market context, support / resistance work, volatility analysis, or risk management. It is best used as a chart-structure tool inside a broader decision process.
Risk Disclosure
This indicator is for chart analysis and workflow support only. It does not provide financial advice, investment advice, or guaranteed trade outcomes. All trading decisions involve risk, and users should evaluate any signal, state change, or alert within their own methodology, market conditions, and risk framework. Indikator

Indikator
EMA Slope - RSI Oscillator Strategy**EMA Slope Strategy** combines normalized EMA slope momentum with centered RSI to build a multi-entry system for both continuation and reversal setups. It uses a global No Trade Zone (NTZ) to block weak signals, optional divergence modules, RSI-Slope oscillator entries, and entry-type-specific trailing management.
**Core Concept - Arctan Slope Normalization:** The strategy measures the change in a long moving average and normalizes it with an arctan model to a centered range that asymptotically approaches +/-50. This keeps slope and centered RSI on comparable scales without hard clipping, making momentum relationships more realistic across different volatility regimes.
**Global NTZ Filter:** The NTZ acts as a full entry blocker when enabled. No new entries are allowed while normalized slope is inside the zone, including reversals. This keeps the strategy focused on stronger momentum conditions while still allowing exits inside the NTZ.
**Entry Engine:** The script supports NTZ Cross, Acceleration, RSI Divergence, Slope-RSI Divergence, and RSI-Slope Oscillator entries. The oscillator now checks NTZ only on the initial cross, then waits for RSI and slope to keep moving in the same direction within a timeout window.
**Trade Management Enhancements:** Same-direction stacking is blocked, but opposite-direction entries can still reverse positions cleanly. Old trailing-stop state is cleared on reversal so only the new side remains active. Standard entries can optionally exit on NTZ re-entry, while divergence and oscillator entries use their own ATR-based trailing logic and grace periods.
Default values were tested in BTCUSDT 15min market.
### 🎯 Key Features
✅ **Global No Trade Zone (NTZ)** - Blocks all new entries while slope is inside the neutral zone
✅ **Momentum-Based Entries** - Requires minimum delta to filter weak signals
✅ **Stretch Filter** - Prevents entries when MAs are overextended
✅ **Trend Confirmation** - Optional filter ensures trades align with trend
✅ **Acceleration Entry** - Alternative entry on sudden slope acceleration
✅ **RSI Divergence Entries** - Detect reversals with multi-peak divergence analysis
✅ **Slope-RSI Exhaustion** - Visual warnings and optional filter using normalized momentum comparison
✅ **RSI-Slope Oscillator Entries** - Arms on a valid cross outside NTZ, then confirms with same-direction RSI and slope movement
✅ **Side-Aware Reversals** - Blocks same-direction add-ons while still allowing opposite-side reversals
✅ **RSI-Slope Cross Exit** - Optional close/reverse for any position when RSI and slope cross with same-direction momentum
✅ **Exit Confirmation** - Requires consecutive bars to filter false exit signals
✅ **Entry-Type Trailing Stops** - Separate ATR trails and grace periods for standard, divergence, and oscillator trades
✅ **Immediate Trail Reset On Flip** - Disables the old side's stop state as soon as a reversal is triggered
✅ **Individual Entry Type Controls** - Enable/disable each entry method independently
✅ **Dynamic RSI Coloring** - Visual RSI coloring based on overbought/oversold levels
✅ **Flexible Position Sizing** - Percent of Equity, Fixed Quantity, or Percent of Cash
✅ **Built-in Alerts** - Entry/exit alerts with trade details
### 📊 Technical Calculations
**Slope Normalization Formula:** `maDF = longMA - longMA `, then `normalizedSlope = (100 / pi) * atan(maDF / stdev(maDF, lookback))`. This produces a centered oscillator that asymptotically approaches +/-50 and stays comparable with centered RSI.
**Acceleration Detection:** Calculates the absolute change in slope between bars, multiplied by smoothing factor and scaled to 0-50 range. Values above threshold (default 38) indicate sudden momentum shifts, visualized as colored dots.
**RSI Divergence:** Uses pivot high/low detection on smoothed RSI with configurable sensitivity (lookback = 16 - sensitivity). Compares price pivots against RSI pivots to identify divergences: bullish when price makes lower lows while RSI makes higher lows, bearish when price makes higher highs while RSI makes lower highs.
**Slope-RSI Exhaustion:** Compares normalized EMA slope momentum against centered RSI (RSI - 50) on the same scale. When slope is accelerating in one direction but RSI is moving opposite over multiple lookback periods, it indicates trend exhaustion. The gap between slope and RSI must exceed threshold (default 10.0 points) to filter noise.
**RSI-Slope Oscillator:** Detects when centered RSI crosses normalized slope outside the NTZ, then waits for both RSI and slope to continue moving in the same direction within a timeout window. This allows reversal-style entries without requiring the slope to stay outside the NTZ after the cross.
**Trailing Stop (Blackflag FTS Swingarm):** Uses Wilder's moving average of true range (modified or standard) multiplied by ATR factor. Separate trailing stops for different entry types: Standard entries (NTZ Cross, Acceleration) use standard ATR factor with grace period (default 3 bars). Divergence entries use wider ATR factor (default 6.0) with grace period (default 5 bars). RSI-Slope Oscillator entries use wider ATR factor (default 6.0) with grace period (default 3 bars). Grace periods prevent immediate exits after entry.
**Visual Indicators:** Green/Red = trend direction, Gray = NTZ zone, Colored dots = acceleration, Centered RSI line (RSI-50) with dynamic coloring (Red when overbought >20, Green when oversold <-20, Neutral when between -20 and 20), Purple/Lime diamonds = price-RSI divergence, Orange/Yellow triangles = slope-RSI exhaustion warnings, Information table showing Slope, cRSI, Gap, and P/L%
### ⚙️ Quick Setup
**Defaults:** MA: 40/160 EMA, NTZ: 8, Delta: 3.2, Stretch: 0.38%, Position: 90% Equity, Exit Confirm: 1 bar, Trail Stop: ATR 15/Factor 5.1, Entry ATR: Period 10/Factor 4.4, RSI: Length 12/Smooth 3/Sensitivity 6, Div ATR: 6.0/Grace 5, Slope-RSI: Lookback 4/Gap 10.0 pts, Osc ATR: 6.0/Grace 3, Standard Grace: 3 bars, Max Crossing Back Period: 5 bars
### 🚀 Entry Methods and Logic
**Long Entry Conditions (5 Methods):**
1. **NTZ Cross Entry:** Triggers when normalized slope crosses above +8 threshold. Requires positive delta ≥ minimum threshold (default 3.2), stretch filter allows entry (MAs not overextended), and optional trend confirmation (short MA > long MA) if enabled. This is the primary trend-following method.
2. **Acceleration Entry:** Triggers when acceleration value ≥ threshold (default 34) AND slope is already above NTZ AND delta is sufficient. This captures sudden momentum bursts during strong trends, visualized as colored dots on the indicator.
3. **RSI Divergence Entry:** Triggers when bullish divergence detected - price makes a lower low while RSI makes a higher low over the sensitivity lookback period. Optional Slope-RSI confirmation can be required. This targets reversal opportunities at potential bottoms.
4. **Slope-RSI Divergence Entry:** Triggers when slope is accelerating downward (negative delta, slope below -8) but RSI is rising over lookback periods, with gap between slope and RSI exceeding threshold. This detects bullish exhaustion reversals during downtrends.
5. **RSI-Slope Oscillator Entry:** Triggers when centered RSI crosses normalized slope outside the NTZ, then confirms when both RSI and slope keep moving in the same direction within the allowed timeout window. This targets reversal-style entries while the global NTZ filter still blocks final entries inside the zone.
**Short Entry Conditions:** Mirror of long conditions with opposite directional requirements.
**Exit Logic by Entry Type:**
- **NTZ/Acceleration Entries:** Exit when slope re-enters NTZ, if that option is enabled, or when the standard trailing stop triggers after its grace period.
- **Divergence Entries (RSI or Slope-RSI):** Exit only via divergence-specific trailing stop which uses wider ATR factor (default 6.0, adjustable 4-8) and grace period (default 5 bars) before activation. This allows reversal trades time to develop without premature exits.
- **RSI-Slope Oscillator Entries:** Exit when the opposite oscillator condition triggers or when the oscillator-specific trailing stop is hit after its grace period.
- **RSI-Slope Cross Exit (All Entry Types):** Optional exit/reverse condition that applies to ALL positions. When enabled, exits or reverses position when RSI crosses Slope with both indicators moving in the same direction. Bearish: RSI crosses below Slope AND both heading DOWN (exits/reverses longs). Bullish: RSI crosses above Slope AND both heading UP (exits/reverses shorts). Can be set to reverse position or close only.
### 📖 How-To Guide
**Add to Chart:** Indicators → Search "EMA Slope Strategy" → Select
**Parameter Configuration Guide:**
- **MA Settings**: Two moving averages required. Short MA (default 40) used for stretch filter calculation. Long MA (default 160) used for slope calculation. Ratios: 20/80 (fast, more signals), 40/160 (standard, balanced), 50/200 (slow, fewer but stronger signals). EMA recommended for responsiveness.
- **NTZ Threshold**: Controls minimum momentum required for entries. Lower values (5-6) generate more trades but may include weaker signals. Higher values (10-12) generate fewer but stronger momentum signals. Default 8 balances frequency with quality.
- **Stretch Filter**: Percentage difference threshold between MAs (default 0.38%). For longs: blocks when long MA > short MA by threshold amount. For shorts: blocks when long MA < short MA by threshold amount. Lower (0.2-0.3%) = more conservative, higher (0.5-1.0%) = more permissive. Set to 0 to disable.
- **Delta Threshold**: Minimum change in normalized slope between bars required for entry (default 3.2). Higher values (5-10) require stronger momentum, lower (1-3) are more sensitive. This filters out minor slope fluctuations.
- **Exit Confirmation Bars**: Number of consecutive bars exit conditions must persist before closing (default 1). 0 = immediate exit, 1-3 = filters false exit signals during temporary pullbacks, higher = more tolerant. Only applies to NTZ re-entry exits, not trailing stops or RSI-Slope cross exits.
- **Trailing Stop**: Blackflag FTS Swingarm method using ATR-based calculation. Trailing Stop ATR Period (default 15) and Factor (default 5.1) control stop distance. Entry ATR Period (default 10) and Factor (default 4.4) control initial stop loss. Separate ATR factors and grace periods for standard entries (default grace 3 bars), divergence entries (default ATR factor 6.0, grace 5 bars), and oscillator entries (default ATR factor 6.0, grace 3 bars). Grace periods prevent immediate exits after entry.
- **RSI Divergence Settings**: Sensitivity (6-10, default 6) controls pivot lookback (inverse relationship - higher = more sensitive). Max Peaks to Compare (2-15, default 8) controls how many previous peaks to check. Grace bars (2-5, default 5) delay trailing stop activation. Divergence ATR Factor (4-8, default 6.0) sets stop width for reversal trades. Optional Slope-RSI confirmation can be required for higher quality signals.
- **Slope-RSI Settings**: Lookback bars (2-10, default 4) determines how many periods to compare RSI direction against slope. Gap threshold (10.0 pts default) filters weak divergences - minimum distance between EMA Slope and Centered RSI. Set gap to 0 to disable threshold. Can be used as entry method (counter-trend reversals) or as confirmation filter for RSI divergence entries.
- **RSI-Slope Oscillator Settings**: ATR Factor (4-8, default 6.0) for trailing stop width. Grace bars (2-5, default 3) before stop activates. Max Crossing Back Period (1-50, default 5) controls timeout window for entry after cross. Allows position reversal when opposite signal triggers.
- **RSI-Slope Cross Exit**: Optional exit/reverse condition. When enabled, exits or reverses position when RSI crosses Slope with both moving in same direction. Can be set to reverse position or close only. Applies to all entry types.
- **Entry Type Controls**: Individual checkboxes to enable/disable each entry method: NTZ Cross Entries, Acceleration Entry, RSI Divergence Entries, Slope-RSI Divergence Entries, RSI-Slope Oscillator Entries. Allows fine-tuning which entry methods are active.
- **RSI Display**: Dynamic RSI coloring option (enabled by default). RSI line changes color based on overbought/oversold levels: Red when cRSI > 20, Green when cRSI < -20, Neutral when between -20 and 20. Customizable colors and line width.
**Alerts:** Right-click chart → Add Alert → Select "EMA Slope Strategy" → Choose condition → Configure notifications
**Backtest:** Strategy Tester tab → Select strategy → Set date range & capital → Review results
**Panel Interpretation:** Green/Red = trend, Gray = NTZ, Dots = acceleration, Blue = Centered RSI, Purple/Lime = price-RSI divergence, Orange/Yellow = slope-RSI exhaustion
**Multi-Timeframe:** Higher timeframe for trend, lower for entries. **Market Adjustments:** Crypto: 20/80 MA, NTZ 6-7 | Forex: 40/160, NTZ 8 | Stocks: 50/200, NTZ 10-12
### 💡 Usage Guidelines
**Timeframe Recommendations:** Day Trading: 5m-15m charts work well with faster MA settings (20/80). Swing Trading: 1h-4h charts with standard settings (40/160). Position Trading: 4h-Daily charts with slower settings (50/200).
**Entry Method Selection:** Use individual entry type controls to enable/disable methods based on market conditions. NTZ Cross and Acceleration work best in trending markets. RSI Divergence and Slope-RSI Divergence work best at potential reversal points. RSI-Slope Oscillator works best for trend reversals when momentum indicators align. You can enable multiple methods simultaneously or use them individually.
**Risk Management:** Always validate signals with price action and support/resistance levels. Use position sizing to limit risk to 1-2% of capital per trade. Exit Confirmation bars (default 6) help filter false exits during normal market volatility. Divergence and oscillator entries use wider stops (ATR factor 6.0) with grace periods (3 bars) because reversals need room to develop. Standard entries use tighter stops (ATR factor 4.7) with shorter grace period (2 bars). RSI-Slope Cross Exit provides additional exit mechanism that can reverse positions when momentum shifts.
**Market-Specific Adjustments:** Crypto markets: Use faster MAs (20/80), lower NTZ (6-7), higher delta (4-5). Forex: Standard settings (40/160 MA, NTZ 8, Delta 3.2). Stocks: Slower MAs (50/200), higher NTZ (10-12), lower delta (2-3). Always backtest parameter combinations for your specific market and timeframe before live trading.
### 🔔 Alert System
The strategy includes built-in alert conditions for all entry and exit events. Entry alerts include: entry method type (NTZ Cross, Acceleration, RSI Divergence, Slope-RSI Divergence, or RSI-Slope Oscillator), entry price, calculated position size, current normalized slope value, delta value, acceleration value, RSI value, trend confirmation status, Slope-RSI confirmation status (if enabled), and timestamp. Exit alerts include: exit price, original entry price, position size, profit/loss amount and percentage, exit reason (trailing stop, NTZ re-entry, RSI-Slope Cross, or position reverse), current slope and RSI values, confirmation bars count (for NTZ exits), and timestamp. Set up alerts by right-clicking the chart, selecting "Add Alert", choosing the strategy, and selecting which conditions to monitor.
### 📈 Use Cases
Day Trading (5m-15m), Swing Trading (1h-4h), Position Trading (4h-Daily), Trend Following, Momentum Trading, Reversal Trading, Range Trading
### ⚠️ Important Disclaimer
**THIS IS NOT FINANCIAL ADVICE**
This strategy is for educational purposes only. Trading involves substantial risk of loss and is not suitable for all investors. Past performance does not guarantee future results.
**Key Points:** No guarantee of profits - you may lose capital. Not professional financial advice - consult a qualified advisor. Trade only with capital you can afford to lose. Backtest results don't guarantee future performance. You are solely responsible for trading decisions and risk management.
**By using this strategy, you acknowledge understanding the risks and that you use it at your own risk. Never invest more than you can afford to lose.**
**Works on all markets**: Crypto, Forex, Stocks, Commodities, Futures
## Short Description (for Script Header - 200-300 chars)
Multi-entry strategy combining arctan-normalized EMA slope with centered RSI. Includes a global NTZ entry filter, NTZ/acceleration/divergence/oscillator signals, side-aware reversals, optional NTZ re-entry exits, and separate trailing stops with grace periods for each entry type.
## Tags (for Publishing)
EMA, Moving Average, Slope, Trend Following, Momentum, No Trade Zone, NTZ, Strategy, Trading Strategy, Technical Analysis, Trailing Stop, Position Sizing, Acceleration, Delta, Stretch Filter, Trend Confirmation, RSI, Divergence, Slope-RSI, Exhaustion, RSI-Slope Oscillator, Normalized Comparison, Exit Confirmation, Alerts, Backtesting, Crypto, Forex, Stocks, Futures, Swing Trading, Day Trading, Reversal Trading, Range Trading
## Category
**Strategies** → **Trend Following**
Strategie

Indikator

AG Pro EMA 200 Reclaim Map [AGPro Series]AG Pro EMA 200 Reclaim Map
Overview / What it does
AG Pro EMA 200 Reclaim Map is a chart overlay built to organize price behavior around the 200 EMA into a clearer workflow. Instead of treating the 200 EMA as a simple above/below filter, this script tracks how price interacts with that reference during reclaim attempts, acceptance phases, retests, and loss-of-level events. The goal is not to predict future price movement. The goal is to make the structure around a widely used long-horizon moving average easier to read on the chart.
The script highlights when price reclaims the 200 EMA, whether that reclaim is holding with acceptance, whether a retest develops after the move, and whether the reclaim later fails. A compact panel summarizes the current state so the chart can be read more quickly without reducing everything to a single binary signal.
This is designed as a decision-support overlay for traders who already use the 200 EMA as a contextual reference and want a more structured view of how price behaves around that level. It can be used on crypto, stocks, indices, forex, and other liquid markets, but outputs should always be interpreted in the context of the instrument, timeframe, volatility profile, and overall market structure.
Unique Edge
The main objective here is not to create another generic moving-average cross script. The distinctive part of this tool is that it treats the 200 EMA as a behavioral map rather than a yes/no trigger.
In many scripts, the 200 EMA is used only as a directional filter: price above equals bullish context, price below equals bearish context. That can be useful, but it does not say much about the quality of the interaction itself. A reclaim that is accepted cleanly after a controlled retest is different from a reclaim that briefly crosses the line and immediately loses it. Both may appear similar in a simple cross-based tool, but they do not carry the same structural meaning.
This script is built to separate those cases. It tracks whether a reclaim occurred, whether price is holding on the reclaimed side, whether a retest happened, how strong that retest appears relative to the script’s scoring rules, and whether the move later failed. In that sense, the script focuses on reclaim lifecycle mapping rather than raw cross detection.
Methodology
The core reference is the 200-period exponential moving average. From there, the script evaluates several conditions around that line.
1) Reclaim detection
A bullish reclaim occurs when price moves from below the 200 EMA to above it. A bearish reclaim occurs when price moves from above the 200 EMA to below it. These events define the initial transition point, but they are not treated as sufficient on their own.
2) Acceptance / hold logic
After a reclaim, the script tracks whether price remains on the reclaimed side for a defined window. This is used to separate fresh reclaim attempts from accepted holds and weaker continuation states. The panel reflects this with state language rather than presenting the move as an unconditional signal.
3) Retest tracking
After a reclaim, price may revisit the EMA zone. The script evaluates these retest behaviors and can classify them through an internal quality framework. This is intended to distinguish cleaner, more orderly interactions from weaker or less stable ones.
4) Stretch context
The script also measures how extended price is relative to the 200 EMA using an ATR-based context layer. This does not declare a reversal by itself. It simply adds information about whether price is relatively balanced or stretched around the reclaim structure.
5) Failure mapping
If a reclaim is later lost, the script can mark that condition as a failed reclaim. This helps separate accepted transitions from ones that could not maintain structure around the 200 EMA.
The map band around the EMA is only a visual aid. It is there to make the interaction corridor easier to recognize on the chart. It should not be interpreted as an independent support/resistance zone outside the script’s own framework.
States / Signals
This script is best read as a state-mapping overlay, not as a standalone trade engine.
Typical outputs include:
- Bias context relative to the 200 EMA
- Reclaim status
- Acceptance or weak-hold state
- Retest direction and latest retest quality
- Stretch condition relative to the 200 EMA
- Failed reclaim markers when the structure is lost
Depending on settings and chart history, you may see labels such as Bull Reclaim, Bear Reclaim, and retest quality annotations. These labels are visual markers for structural events detected by the script. They are not guarantees of continuation, reversal, or trade outcome.
Alerts
The script includes deterministic alert conditions tied to its event logic. These are designed to support workflow automation for users who want notification when a reclaim or failure condition is detected.
Because alerts are based on chart data and script logic, their usefulness will depend on the selected timeframe, the instrument traded, and the user’s own confirmation process. Alerts should be used as prompts for review, not as standalone execution instructions.
Key Inputs
The exact input list may evolve with future updates, but the script is centered around the following configuration areas:
- EMA length and source settings
- Acceptance / hold window controls
- Retest logic and retest label filtering
- Stretch context based on ATR
- Label visibility, spacing, and display density
- Map / zone display controls
- Panel visibility and panel styling options
These settings allow the script to be adapted for cleaner presentation or more event visibility depending on chart preference. A lower-noise layout may be more suitable for publishing or higher-timeframe review, while a denser layout may be more useful for inspection and testing.
Limitations & Transparency
This script does not forecast price. It does not know future direction, and it does not identify all valid trend continuations or reversals. It is a context tool built around a widely observed moving-average reference.
A reclaim above the 200 EMA does not always lead to continuation. A reclaim below the 200 EMA does not always lead to downside expansion. Retests can succeed or fail. Accepted states can break. Stretch conditions can persist longer than expected. False transitions can occur, especially in choppy or news-driven environments.
Like any moving-average-based framework, this script is also sensitive to timeframe selection. A chart that appears constructive on one timeframe may remain weak on a higher timeframe, or vice versa. Users should interpret the output within their own multi-timeframe and risk-management process.
Label placement, retest visibility, and apparent event density can also vary by volatility regime, zoom level, and chart compression. For that reason, the visual output should be treated as a structured reading aid rather than a complete market model.
This tool should not be viewed as a substitute for market structure analysis, liquidity awareness, execution discipline, or position management.
Risk Disclosure
This script is for chart analysis and educational use. It does not provide investment advice, financial advice, trading advice, or portfolio advice.
Trading and investing involve risk. Markets can move quickly, and losses can occur. No indicator, overlay, or alert system can eliminate that risk. Always use independent judgment, confirm conditions with your own process, and apply risk management appropriate to your market and strategy.
If you use this script in live markets, it is your responsibility to evaluate whether the instrument, timeframe, liquidity, volatility, and execution environment are suitable for your own decisions.
Indikator

Indikator