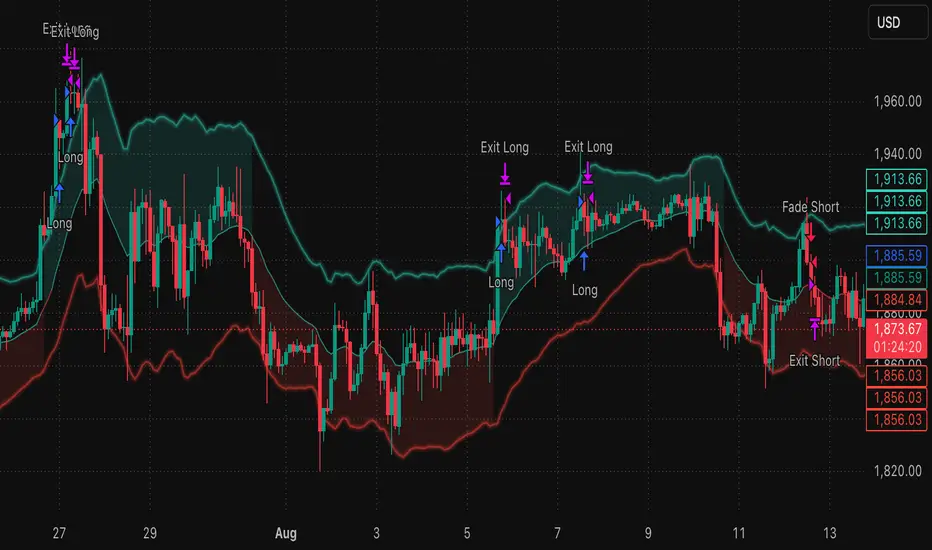
Gradient Ribbon | EMA Ribbon Slope-Acceleration SystemMost EMA ribbon strategies only check if the moving averages are stacked in order — but a ribbon can stay stacked long after the actual trend has run out of steam. Gradient Ribbon looks past the stacking and measures the slope of each EMA directly, only signaling when the ribbon is actively accelerating apart. It catches trend ignition early and flags deceleration before the EMAs ever cross.
Features
5-EMA ribbon (8/13/21/34/55) with per-line slope calculated as % change over a configurable lookback
Fan-open detection: all slopes must be same-direction and increasing in magnitude from slowest to fastest EMA — true acceleration, not just alignment
Long and short logic, fully symmetrical
RSI confirmation filter tuned to each direction, avoiding both weak momentum and overbought/oversold extremes
Volume filter requiring above-average participation, so fans opening on thin volume get filtered out
ATR-based stop loss with equity-percentage position sizing — size automatically adapts to current volatility
Fixed R-multiple take profit
Compression-based exit: closes the trade when the fan starts flattening back toward parallel, ahead of an actual EMA cross
Gradient-intensity fill between the fastest and slowest EMA — barely tinted when flat, vivid teal (bullish) or fuchsia (bearish) when fanning hard, so acceleration is visible at a glance
Entry/exit background highlights for quick visual confirmation on the chart
Explanation
The core idea is that trend strength isn't binary — it has an angle. A ribbon that's flat-stacked from an old move looks the same as one that just started accelerating, if all you check is order. By measuring each EMA's slope and requiring the spread between fastest and slowest slope to be expanding, the script isolates the moments where a trend is genuinely gaining momentum, not just persisting. Exits work the same way in reverse — instead of waiting for a lagging crossover, the script reads the fan closing back up as an early deceleration signal.
Tips
The fanEnterThresh value is highly instrument- and timeframe-dependent. Start with the default and walk it up/down while backtesting rather than trusting it blindly.
Shorter slopeLookback reacts faster to fresh acceleration but is noisier on choppy instruments; lengthen it for smoother, higher-timeframe use.
On low-liquidity instruments, consider loosening or disabling the volume filter — thin markets can have naturally erratic volume that isn't meaningful.
Watch the gradient fill even without a signal — a fan that's steadily brightening (even pre-threshold) is often a useful early heads-up.
Pair with a higher-timeframe trend filter if you want to trade only in the direction of the larger structure; this script is direction-agnostic by design.
Strategie

Coil Breaker | RSI Range CompressionMost RSI strategies fire off static 30/70 thresholds. Coil Breaker does something different: it treats RSI itself as a volatility asset and watches for its own trading range to contract to a multi-month low — a "coil" — before trading the breakout when it releases.
How it works:
Measures RSI's high-minus-low range over the last N bars and ranks it against its own history using a percentile score
When that range compresses into the bottom percentile (default 20%), RSI is flagged as "coiled" — oscillating tightly around 50, momentum dormant
A dynamic Bollinger-style channel is plotted directly around RSI so you can visually watch the coil tighten before it fires
Once a squeeze has been active recently, a breakout above/below the established coil band (not the still-forming one) triggers an entry
Direction is set by an EMA slope filter — the coil tells you something's coming, the EMA tells you which way
Optional ADX filter keeps you out of truly dead, directionless chop
ATR-based stop, fixed R-multiple target, and equity-percent risk sizing so every trade risks a constant dollar amount
Important — read before trading:
This is a breakout/momentum system, not a mean-reversion one, and it behaves accordingly: expect a low win rate (often 30–40%) alongside a high average win/loss ratio. Most coil breakouts fail or chop — you're paying for early entry with more false signals. The edge comes from asymmetric payoff (2R+ winners vs. 1R losers), not from being right often. Judge this strategy on profit factor and expectancy, not win rate. If a 60%+ win rate is what you're looking for, this isn't that system.
Tips:
Backtest coilLen, pctLen, and the percentile threshold across your specific instrument/timeframe — coil dynamics vary a lot between assets
Watch the equity curve shape, not just the total return — make sure gains aren't carried by one or two outlier trades
Works best on instruments/timeframes with genuine volatility cycles (expansion/contraction), not ultra-choppy or illiquid markets
Pair with higher-timeframe context if you want to filter out counter-trend coil breaks
Strategie

Indikator

The Ultimate 50 EMA @JustinPerezTradesUltimate Day Trader — NQ/MNQ Multi-Timeframe 50 EMA Stack
A precision pullback/breakout indicator for NQ and MNQ that only signals when five timeframes of 50 EMAs are stacked in trend order.
Overview
This indicator looks for a specific structural setup on NQ and MNQ futures: a short-term pullback (or push) away from the 1-minute 50 EMA that occurs while the 50 EMA is climbing or falling in a clean, ordered stack across five timeframes (1m, 5m, 10m, 15m, 30m). The idea is to only trade pullbacks that are happening inside a confirmed multi-timeframe trend, rather than reacting to the 1-minute chart in isolation.
It's a signal/alert tool — it plots the EMA stack, marks entries and the exit target on the chart, and can fire alerts. It does not place trades for you.
How it works
Long setup — all of the following must be true at once:
Price is 50–100 points below the 1-minute 50 EMA (a pullback into value, not a full trend break)
5-minute 50 EMA is above the 1-minute 50 EMA
10-minute 50 EMA is above the 5-minute 50 EMA
15-minute 50 EMA is above the 10-minute 50 EMA
30-minute 50 EMA is above the 15-minute 50 EMA
When all five conditions align, the script marks a long entry. The exit target is the 30-minute 50 EMA — the trade is considered closed once price trades up to reach it.
Short setup is the mirror image: price 50–100 points above the 1-minute 50 EMA, with each higher timeframe's 50 EMA stacked below the one before it (5m < 1m, 10m < 5m, 15m < 10m, 30m < 15m). Exit target is the same 30-minute 50 EMA, reached from above.
Entries are edge-triggered — you get one signal per fresh setup, not a repeated marker on every bar the condition happens to remain true.
How to use it
Apply the indicator to a 1-minute chart on NQ or MNQ (front-month continuous contract or a dated expiry). The script checks both conditions and shows a warning label if either isn't met.
Watch the on-chart status table for a live read of: chart/symbol validity, current position state (flat / in long / in short), whether the MTF stack is bullish, bearish, or unaligned, the price's distance from the 1m EMA, and the current exit target level.
Green up-triangles mark long entries, red down-triangles mark short entries; a background tint confirms when the broader EMA stack is aligned even before price reaches the entry zone.
Right-click the chart → Add Alert to get notified on Long Entry, Short Entry, Long Exit, or Short Exit independently.
Inputs
EMA Length — default 50, applies to all five timeframes
Min / Max entry distance from the 1m EMA (points) — default 50 / 100, tuned for NQ/MNQ's typical point range
Restrict signals to NQ/MNQ only — on by default; disable to experiment with the same logic on other instruments
Higher timeframe overrides — 5m/10m/15m/30m are adjustable if you want to test alternate spacing
Display toggles for the EMA plots, stack-aligned background highlight, and the status table
Notes
This script is built BY @JustinPerezTrades specifically around NQ and MNQ's point behavior — the 50–100 point entry zone will not translate directly to instruments with different average ranges. It is a rules-based signal tool, not a guaranteed-profit system, and past alignment of these conditions does not predict future results. Backtest and paper-trade before using it with real capital, and use it alongside your own risk management. Indikator

EMA Ribbon + Smoothed RSI Trend StrategyEMA Ribbon Trend Filter + Smoothed RSI Entry Strategy
BEST IS 1/1RR
Overview
This strategy combines a moving-average trend filter with a smoothed RSI trigger to time entries in the direction of an established trend, with stop-loss levels placed at real market structure rather than a fixed distance.
How it works
1. Trend Filter (Ribbon)
An EMA(10) and EMA(20) are plotted on the chart. The strategy only considers trades when EMA(10) is above EMA(20) — treated here as confirmation of underlying bullish structure. Two additional SMAs (20/50) are plotted alongside for visual context but aren't part of the trade logic.
2. Entry Trigger — Smoothed RSI
Rather than using raw RSI, this script smooths RSI(21) with a 50-period SMA. That smoothed line is the actual decision value:
Crosses above 51 → long signal
Crosses below 49 → short signal
Smoothing the RSI this way filters out a lot of the noise a raw RSI produces, at the cost of some lag.
3. Structure-Based Stop Loss
Instead of a fixed pip/point stop, SL is placed at the nearest swing low (for longs) or swing high (for shorts) over a configurable lookback window, plus a small buffer. Take-profit is set as a configurable risk:reward multiple of that stop distance.
4. Trade Visualization
Every trade taken draws two boxes on the chart: a green "profit zone" from entry to TP, and a red "risk zone" from entry to SL. These extend in real time while the trade is open, so you can see the live risk/reward geometry of each position at a glance.
5. Non-Repainting
Signals only evaluate on confirmed, closed bars (barstate.isconfirmed), so what you see in the backtest is what would have fired in real time — no mid-bar flip-flopping.
Inputs
EMA/SMA ribbon lengths (default 10/20/20/50)
RSI length and smoothing length (default 21 / 50)
Buy/sell trigger levels (default 51 / 49)
Cross-only trigger toggle
Swing lookback, SL buffer, minimum SL distance
Risk:reward ratio 1/1 IS BEST
Box colors and visibility toggle
Optional date range filter for backtesting
Alerts
Built-in alertcondition() calls for both long and short signals, ready to connect to a webhook or notification service if you want to act on signals outside of TradingView.
⚠️ Disclaimer: This script is provided for educational and informational purposes only. Past performance shown in backtests does not guarantee future results. Backtest results can be affected by commission/slippage assumptions and do not account for real-world execution factors such as liquidity and order rejection. This is not financial advice — use proper risk management and test thoroughly before trading with real capital. Strategie

Moving Average Liquidity Sweeps - Candle Iron CoreMoving Average Liquidity Sweeps - Candle Iron Core
OVERVIEW
Moving Average Liquidity Sweeps is a rule-based indicator designed to identify wick-based sweeps around a dynamically calculated moving average.
Unlike a fixed horizontal liquidity level, a moving average continuously changes with price. This indicator uses the selected EMA or SMA as a dynamic reference and evaluates how individual candles interact with it.
A candle is not classified as a sweep simply because its wick touches or crosses the moving average.
To qualify, the interaction must satisfy independent conditions involving:
The position of the candle body relative to the moving average.
The total length of the wick.
The actual depth of penetration beyond the moving average.
The purpose is to provide a configurable and repeatable method for distinguishing qualifying wick-based interactions from ordinary touches or shallow retests of a moving average.
CORE CONCEPT
The selected moving average acts as the dynamic reference level.
Users can choose:
EMA - Exponential Moving Average
SMA - Simple Moving Average
Moving Average Length
Moving Average Source
For example, the indicator can evaluate interactions with a 21 EMA, 89 SMA, 200 EMA, or any other user-defined combination.
The moving average itself does not determine whether an interaction qualifies as a sweep.
The candle must independently satisfy the sweep conditions described below.
MOVING AVERAGE CALCULATION
When EMA is selected, the script calculates an Exponential Moving Average using the selected source and length.
When SMA is selected, the script calculates a Simple Moving Average using the selected source and length.
The resulting value becomes the Liquidity Moving Average used as the reference for each candle.
Because the moving average is recalculated over time, the reference level evaluated by the script changes from bar to bar.
TWO INDEPENDENT PERCENTAGE FILTERS
The indicator separates two measurements:
Minimum Wick Length (%)
Minimum Sweep Depth Beyond MA (%)
These measurements serve different purposes.
A candle can have a large wick while only slightly crossing the moving average.
Conversely, crossing the moving average does not necessarily mean that the wick itself is significant.
Requiring both conditions provides additional control over what the user chooses to classify as a qualifying sweep.
1. MINIMUM WICK LENGTH
This parameter evaluates the complete wick responsible for the interaction.
For a sweep below the moving average:
Lower edge of candle body → Candle Low
For a sweep above the moving average:
Upper edge of candle body → Candle High
The lower edge of the candle body is defined as the lower value between Open and Close.
The upper edge of the candle body is defined as the higher value between Open and Close.
Therefore, the calculation works consistently for both bullish and bearish candles.
The percentage calculation used by the indicator is:
Lower Wick % = (Body Low - Low) / Body Low × 100
Upper Wick % = (High - Body High) / Body High × 100
The complete wick must meet or exceed the Minimum Wick Length selected by the user.
2. MINIMUM SWEEP DEPTH BEYOND MA
Sweep Depth measures a different distance.
Instead of measuring the complete wick, it measures only how far price extends beyond the moving average.
For a sweep below:
Moving Average → Candle Low
For a sweep above:
Moving Average → Candle High
The percentage calculation is:
Sweep Depth Below % = (Moving Average - Low) / Moving Average × 100
Sweep Depth Above % = (High - Moving Average) / Moving Average × 100
This condition helps distinguish a qualifying penetration from a candle that merely touches or moves slightly beyond the moving average.
SWEEP ABOVE MOVING AVERAGE
A candle qualifies as a Sweep Above when all of the following conditions are satisfied:
The entire candle body remains at or below the moving average.
The upper wick crosses above the moving average.
The complete upper wick meets or exceeds the selected Minimum Wick Length.
The distance from the moving average to the candle High meets or exceeds the Minimum Sweep Depth Beyond MA.
The selected direction settings allow sweeps above the moving average.
When all conditions are satisfied, a downward triangle is plotted above the candle.
SWEEP BELOW MOVING AVERAGE
A candle qualifies as a Sweep Below when all of the following conditions are satisfied:
The entire candle body remains at or above the moving average.
The lower wick crosses below the moving average.
The complete lower wick meets or exceeds the selected Minimum Wick Length.
The distance from the moving average to the candle Low meets or exceeds the Minimum Sweep Depth Beyond MA.
The selected direction settings allow sweeps below the moving average.
When all conditions are satisfied, an upward triangle is plotted below the candle.
WHY BODY POSITION MATTERS
The candle body is intentionally required to remain on the original side of the moving average.
A candle whose body crosses through the moving average represents a different type of interaction from a candle that penetrates the level only with its wick.
For this reason:
Sweep Above → Body remains below the MA.
Sweep Below → Body remains above the MA.
This allows the indicator to focus specifically on wick-based interactions rather than classifying every candle that crosses a moving average as a sweep.
WHY WICK LENGTH AND SWEEP DEPTH ARE SEPARATE
Consider a candle with a large lower wick.
The candle may satisfy the Minimum Wick Length requirement while extending only slightly below the moving average.
Without an additional depth requirement, a shallow interaction could qualify solely because the candle happened to have a long wick.
The Minimum Sweep Depth Beyond MA solves this by requiring price to travel a separately defined minimum distance beyond the moving average.
Therefore:
Wick Length measures the wick itself.
Sweep Depth measures the penetration beyond the moving average.
A qualifying signal must satisfy both.
SWEEP DIRECTION
The indicator allows users to select:
Both - Detect interactions above and below the moving average.
Above MA - Detect only sweeps above the moving average.
Below MA - Detect only sweeps below the moving average.
CANDLE CLOSE CONFIRMATION
The Confirm only after candle close option determines whether the script waits for the current candle to close before confirming a signal.
When enabled, a sweep is marked only after the bar is confirmed.
This is particularly relevant because the High, Low and Close of an active candle can continue changing before the candle closes.
VISUAL SETTINGS
Users can customize:
Whether the moving average is displayed.
Moving Average color.
Moving Average width.
Sweep marker color.
The plotted moving average corresponds directly to the dynamic reference used by the sweep calculations.
HOW TO USE
A basic workflow is:
Select EMA or SMA.
Choose the Moving Average Length.
Select the Moving Average Source.
Define the Minimum Wick Length.
Define the Minimum Sweep Depth Beyond MA.
Choose whether to detect sweeps above, below, or in both directions.
Optionally require candle-close confirmation.
Evaluate qualifying interactions within the context of the user's own trading methodology.
EXAMPLE
Suppose a trader selects a 200 EMA.
A candle trades below the EMA and its upper wick extends through it.
Crossing the EMA alone does not produce a signal.
For the candle to qualify as a Sweep Above:
Its complete body must remain at or below the EMA.
Its upper wick must cross the EMA.
Its complete upper wick must satisfy the Minimum Wick Length.
The portion extending beyond the EMA must satisfy the Minimum Sweep Depth Beyond MA.
Only when all conditions are satisfied does the indicator plot the sweep marker.
ORIGINALITY AND PURPOSE
This indicator is not intended to introduce another moving-average crossover system.
The moving average serves only as a dynamically changing reference level.
The script's primary functionality is the classification of candle interactions around that reference using three independent structural conditions:
Candle-body position relative to the moving average.
Minimum total wick length.
Minimum penetration depth beyond the moving average.
Separating total wick length from actual penetration depth is particularly important because the two measurements describe different characteristics of the candle.
This combination allows users to define a consistent threshold for wick-based interactions with dynamic EMA or SMA levels rather than treating every touch, crossover, or wick penetration as equivalent.
ALERTS
Alert conditions are included for:
Liquidity Sweep Above MA
Liquidity Sweep Below MA
The alerts use the same conditions as the corresponding visual markers.
IMPORTANT NOTES AND LIMITATIONS
The term "Liquidity Sweep" in this indicator describes a candle interaction that satisfies the quantitative rules defined above.
The indicator does not observe the exchange order book and therefore does not confirm the presence of resting orders, stop-loss concentrations, institutional orders, or actual available liquidity at the moving average.
Likewise, an EMA or SMA is not inherently a liquidity level.
The moving average is used by this script as a dynamic reference selected by the user for evaluating wick behavior.
A qualifying sweep does not predict that price will reverse, continue, or produce a profitable trading opportunity.
Moving averages, volatility and candle characteristics can behave differently across assets and timeframes. Parameters should therefore be evaluated specifically for the market, timeframe and methodology in which they are intended to be used.
This indicator does not provide Buy or Sell signals and does not guarantee future market behavior. Indikator

Smart Money Structure & Dynamic Equilibrium Suite [ICT Pro]Smart Money Structure & Dynamic Equilibrium Suite
Overview & Purpose
Smart Money Structure & Dynamic Equilibrium Suite is an advanced, high-precision technical analysis visual tool engineered for Pine Script v6. Designed specifically for modern Price Action, Smart Money Concepts (SMC), and Inner Circle Trader (ICT) analysts, this script provides clean visual overlays for key liquidity boundaries, trend momentum, and range midpoints without cluttering chart aesthetics.
Instead of displaying unnecessary lines or repainting historical indicators, this suite focuses purely on real-time structural clarity, dynamic range evaluation, and institutional volume tracking.
Key Features & Technical Components
1. Auto-Swept Previous Day High & Low (PDH / PDL)
- Institutional Liquidity Levels: Automatically tracks and plots the Previous Day High (PDH) and Previous Day Low (PDL) as horizontal daily boundaries.
- Dynamic Disappear / Swept Logic: Once price crosses or sweeps a daily liquidity level during an active trading session, the swept level automatically vanishes from the chart. This ensures your view remains clean and focused only on active, unmitigated daily liquidity targets.
- Full Visual Customization: Adjust line colors, text colors, line thickness, and stroke style (Solid, Dashed, or Dotted) directly from the inputs menu.
2. Connected Dynamic Equilibrium Range
- 50% Midpoint Calculation: Continuously calculates the real-time 50% Equilibrium price zone based on customizable local swing lookback periods.
- Connected Line Extension: Features an extended horizontal line that connects seamlessly to the "EQUILIBRIUM" text label on the right margin, eliminating visual gaps or confusion about range boundaries.
3. Smart Volume Spike & Trend Candle Glow Engine
- Directional Candle Glow: Color-codes chart candles based on dual Moving Average alignments—Neon Green during bullish momentum and Neon Red during bearish momentum.
- Golden Volume Spike Highlighting: Dynamically overlays high-volume institutional candles in a distinct Glowing Gold color whenever current bar volume exceeds customizable moving average multipliers. This makes it effortless to spot institutional expansion bars.
4. Major Intermediate Term Swing Badges (ITH / ITL)
- Structural Pivot Badges: Automatically flags confirmed major high and low points using clear ITH (Intermediate Term High) and ITL (Intermediate Term Low) badges.
- Customizable Sensitivity: Adjust the pivot lookback sensitivity to tailor the detector for scalp, intraday, or higher-timeframe swing trading.
Full Inputs & Parameter Configuration Guide
1. Moving Average & Ribbon Controls
- Show MAs: Enables or disables the visibility of the two core Moving Averages on the chart.
- MA Type: Choose between EMA (Exponential), SMA (Simple), or WMA (Weighted) calculation methods.
- Fast MA Length: Defines the lookback period for the fast directional moving average (Default: 9).
- Slow MA Length: Defines the lookback period for the baseline moving average (Default: 21).
- MA Line Thickness: Adjusts stroke width for both moving averages (1 to 4 pixels).
- Show MA Ribbon Glow: Toggles the background color fill between the Fast and Slow MAs on or off.
2. Smart Candle Glow Settings
- Enable Trend Candle Coloring: Toggles custom candle coloring based on MA trend direction.
- Highlight Volume Spikes: Turns on or off the special Golden Candle overlay for high-volume bars.
- Volume Spike Threshold: Set the volume multiplier relative to the 20-period volume average (Default: 1.8x).
3. Equilibrium Settings
- Show Equilibrium Level: Turns the 50% range midpoint line on or off.
- Equilibrium Lookback Period: Sets the number of historical bars evaluated to compute the local range midpoint.
- Line Style & Thickness: Customize whether the line appears Solid, Dashed, or Dotted, as well as its thickness and color.
4. Daily Liquidity Settings (PDH / PDL)
- Show PDH & PDL: Toggles display of Previous Day High and Low levels.
- PDH/PDL Line Style & Thickness: Select custom visual preferences for daily boundaries.
- Color Pickers: Separate line and text color options for both High and Low daily levels.
Step-by-Step Guide: How to Use This Tool Effectively
Step 1: Determine Structural Bias
Use the Trend Ribbon Cloud and candle coloring to establish current market bias. Green candles and ribbons indicate bullish control, while Red candles signify bearish dominance.
Step 2: Monitor Daily Liquidity Targets
Observe active PDH and PDL lines as primary liquidity pools. When a line disappears from your chart, it confirms that liquidity at that level has been swept by price.
Step 3: Evaluate Value Zones
Refer to the Equilibrium step-line to determine whether current price trades above 50% (Premium territory) or below 50% (Discount territory) relative to recent market swings.
Step 4: Identify Institutional Volume Expansion
Pay close attention to Glowing Gold candles. Volume spikes often coincide with smart money entries, order block mitigations, or explosive range breakouts.
Trading Disclaimer & Risk Warning (House Rules Compliance)
Educational Disclaimer:
This script is strictly a visual analysis and charting utility designed for technical educational purposes. It does NOT offer financial advice, trade signals, investment recommendations, or automated buy/sell algorithms.
Risk Acknowledgment:
Financial trading carries inherent risk, and historical market behavior depicted by visual indicators does not guarantee future results. Users are fully responsible for their own trading decisions and risk management strategies. Indikator

EMA Reversal Squeeze K8EEMA Reversal Squeeze K8E
The EMA Reversal Squeeze K8E is designed to identify potential momentum reversals by detecting a specific sequence of EMA compression and directional flipping.
Works on lower time frames only
The indicator monitors the 9 EMA, 20 EMA, and 50 EMA internally and looks for situations where the three averages come tightly together before reversing their order.
How LONG signals work
A LONG setup begins when:
EMA 9 < EMA 20 < EMA 50
All three EMAs are within 1 point of each other
The EMAs compress further to within 0.5 points
The EMA structure then flips to EMA 9 > EMA 20 > EMA 50
The final flip occurs while the EMAs remain within 1 point
The indicator then prints a LONG signal on the first qualifying candle.
How SHORT signals work
A SHORT setup is the exact opposite:
EMA 9 > EMA 20 > EMA 50
All three EMAs are within 1 point
The EMAs compress to within 0.5 points
The EMA structure flips to EMA 9 < EMA 20 < EMA 50
The final flip occurs while the EMAs remain within 1 point
The indicator then prints a SHORT signal on the first qualifying candle.
Why the squeeze matters
The idea behind the setup is that when the 9, 20, and 50 EMAs become extremely compressed, the market is showing a period of reduced separation between short-, medium-, and longer-term momentum.
When that compression is followed by a complete EMA order reversal, it can indicate that momentum is transitioning to the opposite direction.
The EMA lines are intentionally hidden from the chart so the indicator provides clean LONG and SHORT signals without clutter.
Note: This indicator is a technical analysis tool and should not be considered financial advice. Signals should be evaluated alongside price action, market structure, volatility, session levels, and your own risk-management rules. Indikator

THE 4TH DESKWatermark + ATR + 4 EMA
A three-in-one overlay indicator combining a chart watermark, an ATR-based stop-loss reference, and a four-line EMA ribbon — each independently configurable and toggleable.
Watermark
Displays the current symbol, exchange prefix, timeframe, and (optionally) percentage change in a customizable table anchored to any corner or edge of the chart. Includes an editable signature/branding field, adjustable text sizes, and a custom color with transparency support.
ATR Value Table
Calculates Average True Range (length and smoothing method both configurable — RMA, SMA, EMA, or WMA) multiplied by a user-defined multiplier, useful for setting stop-loss distances. Shown in its own bordered table, positioned and styled independently from the watermark.
4 EMA Ribbon
Plots four exponential moving averages (default periods: 13, 34, 55, 200) on the price chart, each with its own configurable length and color — useful for trend identification and dynamic support/resistance.
All three components have their own input group in the settings panel (Watermark / ATR / 4 EMA), so you can enable, disable, or restyle each piece independently without affecting the others.
Indikator

Momentum Bands | BreakoutThis strategy hunts for N-bar breakouts confirmed by volume expansion — but instead of trading every breakout blindly (like a standard Opening Range or Donchian breakout), it runs price through a trend filter and an RSI momentum check first. Breakouts that align with the EMA trend and show accelerating RSI get traded as genuine continuation moves. Breakouts that fire against the prevailing trend, with RSI already rolling over, get treated as exhaustion — and faded instead of chased. Built-in ATR-based position sizing and a trailing stop round it out into a complete, risk-managed system rather than just a signal generator.
Key Features
Trend-gated entries — EMA fast/slow cross defines regime; longs only trade with the trend, fades only trade against it
Volume-confirmed breakouts — requires expansion above the rolling volume average, not just a price poke
RSI momentum-exhaustion filter — distinguishes accelerating momentum (real breakout) from divergence (fakeout)
ATR-based risk sizing — position size auto-scales to a fixed % of equity risked, using ATR-derived stop distance
ATR trailing stop — lets winners run instead of capping them at a fixed target
Glowing ATR bands — layered, fading visual bands around trend basis for at-a-glance regime read
Breakout candle highlighting — candles color-shift on signal and while a position is open
Live + archived trailing-stop path — see the stop while a trade is open, and its full trail once closed
How It Works
Price breaks above the highest high of the last N bars with volume above its rolling average — that's the breakout trigger.
EMA fast vs. slow defines trend direction.
RSI and its rate of change are checked at the breakout bar: still climbing and near its own recent peak = momentum confirms. Already fading or below its recent peak = momentum diverges.
Confirmed + with-trend → long. Diverging + against-trend → short (fade).
Every entry is sized off account risk %, not a fixed share count, and exits on an ATR stop plus ATR trailing stop.
Tips
Backtest across multiple symbols and volatility regimes before trusting the defaults — breakout/fade systems behave very differently in trending vs. choppy markets
Widen nLen (breakout lookback) on lower timeframes to reduce noise-driven false breakouts
If fades are underperforming, try disabling allowShorts and running long-only to isolate performance
Tighten rsiConfirmLvl for higher-conviction (fewer, cleaner) long signals
Use the glowing bands as a quick visual regime check even when not actively watching signals
Strategie

FCPO KDJ Tower HA EMA StrategyFCPO 5-Min Strategy Backtest v1 — A day-trading strategy for FCPO (Malaysia Crude Palm Oil Futures, BMD:FCPO1!) built on a 5-layer confluence system: KDJ + Tower (Baota) + Heikin Ashi + EMA20 + MACD. It uses the exact same entry logic as the companion "FCPO 5min Signal System v2" indicator, converted to the Strategy Tester to validate signal quality.
Entry Conditions (all 5 layers must align) :
- Layer 1 — Trend filter: price above EMA20 = long only; below EMA20 = short only
- Layer 2 — Momentum: MACD histogram direction (5,20,5)
- Layer 3 — Extreme signal: KDJ J value < 20 (oversold) or > 80 (overbought)
- Layer 4 — Candle confirmation: Heikin Ashi direction matches raw candle close direction
- Layer 5 — Final filter: Tower (Baota) line flips red (bullish) / green (bearish)
- Entries only when flat; each signal fires once, on the first bar all conditions align
Exit Rules (intraday discipline) :
- Fixed stop-loss / take-profit: 8 points each by default (1 lot = RM25 per point, i.e. RM200 / RM200)
- Max holding time: 60 bars by default (can be disabled)
- End-of-day liquidation at 17:45 — no overnight positions
- No new entries after 17:15 (MYT)
Backtest Settings : commission RM12.5/lot and 1-tick slippage included; initial capital 10,000, fixed 1 lot.
How to Use : Open FCPO1! (or BMD:FCPO1!) on a 5-minute chart — keep regular candlesticks (do NOT enable Heikin Ashi candles, as fill prices would be distorted) — add the strategy, then open the Strategy Tester. All parameters (EMA / KDJ / MACD / stop-take points / time windows) are adjustable in the settings panel.
Disclaimer: This script is a technical-analysis tool for validation only. Backtest results do not guarantee future performance, and this is not financial advice. Futures trading involves high risk; always use proper risk management and stop-loss discipline.
FCPO 5分钟 策略回测 v1 —— 基于 KDJ + 宝塔线 + Heikin Ashi + EMA20 + MACD 五层共振入场系统的 FCPO(马来西亚棕榈油期货,BMD:FCPO1!)日内交易策略,与「FCPO 系统警报 v2」指标使用同一套入场逻辑,用于在策略回测器中验证信号质量。
入场条件(五层全部满足才开仓) :
- 第1层 大方向:价格在 EMA20 上方只做多,下方只做空
- 第2层 动量背景:MACD 柱状线方向(5,20,5)
- 第3层 极端信号:KDJ J 值 < 20(KDJL)或 > 80(KDJH)
- 第4层 K线确认:Heikin Ashi 同向 + 普通K线收盘同向
- 第5层 最终过滤:宝塔线翻红 / 翻绿
- 只在空仓时进场,信号首次满足时只触发一次
出场规则(按日内交易纪律) :
- 固定止损 / 止盈:默认各 8 点(1手合约每点 = RM25,即 RM200 / RM200)
- 最长持仓超时:默认 60 根K线(可关闭)
- 日内强平:17:45 触发清仓,不留隔夜仓
- 17:15 后不开新仓
回测设置 :已含手续费(RM12.5/手)与滑点(1 tick);初始资金 10,000,固定 1 手。
使用方法 :FCPO1!(或 BMD:FCPO1!)5 分钟图 → 保持普通K线蜡烛模式(不要开 Heikin Ashi 蜡烛,否则成交价失真)→ 添加策略 → 打开策略回测器查看结果。EMA / KDJ / MACD / 止损止盈点数 / 时间窗口等参数均可在设置面板调整。
提醒:本策略仅为技术分析验证工具,回测结果不代表未来表现,不构成任何投资建议。期货交易风险高,请务必配合资金管理与止损纪律。 Strategie

Trend EMA (MTF) + 4H 200 EMAfWHAT THIS DOES
Plots a higher-timeframe trend EMA on any chart (default: 60-period EMA of daily closes), colored by its slope: green while rising, red while falling. A second reference line plots the 200 EMA computed on 4-hour bars regardless of your chart timeframe. Floating chips at the end of each line identify them at a glance ("Daily trend EMA" / "4H 200 EMA"), with the trend chip showing a live direction arrow.
KEY FEATURES
- Trend EMA timeframe is selectable: Hourly, 4-Hour, or Daily (length configurable, default 60)
- Slope coloring: the line turns green when rising and red when falling, so trend state is readable without any oscillator
- Hover-to-peek bar coloring: hover over or select the indicator and the price bars instantly color green/red based on whether price is above or below the trend EMA. Click empty chart space and the coloring disappears. No settings required.
- Permanent bar coloring: if you prefer always-on painting, enable it in the Style tab ("Price bar coloring (permanent)")
- Session pinning: EMAs are computed on a fixed data session (Extended 24H by default), so the 4H 200 EMA shows the SAME value whether you view it from a 15-minute, 4-hour, or 3-day chart
- Smart labels: the two chips automatically split apart vertically when the lines converge, so they never overlap
HOW IT WORKS
- The higher-timeframe EMA is requested with gaps enabled, so it prints once per HTF bar and draws as a smooth connected line on intraday charts instead of a stair-step
- Slope state is persisted across the in-between bars, driving the line color, the label color, and the direction arrow
- The data session is pinned via ticker.modify(). Extended-hours data only exists on intraday charts, so an intraday EMA inherited from chart data changes value when you switch to daily+ timeframes. Pinning the session removes that inconsistency, which is a subtle but real problem with most MTF EMA scripts.
- The peek feature works by plotting exact candle copies behind the main price bars, colored by position vs the EMA. TradingView raises a hovered or selected indicator above the main series, which reveals them; deselecting drops them behind the bars again.
HOW TO USE IT
- Trend filter: take longs while the trend EMA is green and price holds above it, shorts while red and below. The bar-peek gives an instant read on how price has interacted with the EMA historically.
- Pullback reference: on intraday charts, the daily trend EMA often acts as a dynamic pullback zone within trends.
- The 4H 200 EMA is a slower structural reference; confluence of the two lines tends to mark meaningful support/resistance zones.
SETTINGS
- Trend EMA: timeframe, length, width, rising/falling colors
- Bar coloring: above/below colors (used by both peek and permanent modes)
- 4H 200 EMA: show/hide, color, width
- Labels: show/hide, offset from last bar
- Data: session used for intraday EMAs (Extended 24H / Regular hours / Chart)
NOTES
- Designed for chart timeframes at or below the selected EMA timeframe. On higher timeframes the intraday EMAs are sampled once per chart bar (coarser but consistent thanks to session pinning).
- The peek feature relies on solid candle/bar styles. With hollow candles, disable the "Bars above/below EMA" plots in the Style tab.
- If bars appear permanently colored after adding the indicator, right-click it and choose Visual order > Send to back.
This is a technical analysis tool for educational purposes, not financial advice. Indikator

3x MTF MA Zones [josseliani]3x MTF MA Zones is a clean multi-timeframe moving average overlay designed for dynamic support/resistance, trend structure and higher-timeframe context.
The indicator combines up to three independently configurable moving averages in one chart overlay. Each MA can use its own type, length, source and timeframe, allowing higher-timeframe moving average structure to be displayed directly on a lower-timeframe chart.
In addition to the three MAs, the indicator can identify the directional relationship between the two longer moving averages and visually highlight changes in that structure.
Three Independent Moving Averages
Each MA can be configured separately.
Available settings include:
MA type: EMA, SMA, WMA or SMMA
Source
Length
Timeframe
Color
Line width
Visibility
The default configuration uses SMMA 50 / 100 / 200.
If the timeframe field is left empty, the MA is calculated using the current chart timeframe.
A different timeframe can be selected independently for each MA. For example, a trader working on a 1-minute chart can display moving averages calculated from the 5-minute or 15-minute timeframe without changing charts.
Confirmed Higher-Timeframe Values
The optional Use Confirmed HTF Values setting controls how higher-timeframe moving averages are displayed.
When enabled, the indicator uses the last completed higher-timeframe MA value. This keeps the higher-timeframe structure stable while the current higher-timeframe candle is still developing.
When disabled, the currently developing higher-timeframe MA value can be displayed instead.
MA Zones
Optional fills can be displayed between:
MA 1 and MA 2
MA 2 and MA 3
This allows nearby moving averages to be viewed as broader dynamic structure zones rather than only as individual lines.
These areas can be useful for observing pullbacks, price reactions and confluence between several moving averages.
MA Cross and Trend Context
The indicator also monitors the relationship between the displayed moving averages.
When all three MAs are visible, the two MAs with the longest selected periods are used for the cross analysis.
If only two MAs are visible, those two are used instead.
A confirmed crossover between the selected pair changes the current directional state:
Green background — bullish MA structure
Red background — bearish MA structure
The background remains active until an opposite crossover changes the directional state.
The crossover itself can also be marked with a small diamond and an optional vertical divider through the chart.
These elements are intended to make changes in the broader MA structure easy to identify without adding separate indicators to the chart.
How I Use It
I mainly use 3x MTF MA Zones to keep higher-timeframe structure visible while trading lower timeframes.
One configuration I use for intraday gold scalping is 5-minute SMMA 50 / 100 / 200 displayed on a 1-minute chart.
I use the moving averages and the areas around them as possible:
trend-structure zones
dynamic support and resistance
reaction areas
pullback areas
continuation levels
higher-timeframe confluence
The background gives an additional visual reference for the current relationship between the longer moving averages.
This is only an example of my own configuration. The MA types, periods and timeframes can be adapted to different markets and trading styles.
Alerts
The indicator includes two types of alerts.
MA Touch Alerts
Each of the three moving averages has an independent touch alert.
A touch is detected when price reaches the corresponding MA. Each MA also has its own cooldown setting to help prevent repeated notifications while price is consolidating around the same level.
MA Cross Alerts
Separate bullish and bearish alerts are available when the selected MA pair crosses and the directional state changes.
This makes it possible to receive notifications both when price reaches an MA area and when the broader moving-average structure changes.
What Makes 3x MTF MA Zones Different
The purpose of 3x MTF MA Zones is to combine several related parts of moving-average analysis in one compact overlay.
Instead of using several separate MA indicators, each moving average can be configured independently with its own type, source, period and timeframe.
The indicator then combines these MAs with optional structure zones, confirmed higher-timeframe values, automatic cross analysis of the relevant longer-period MAs, visual trend-state highlighting and independent touch and crossover alerts.
The result is a simple multi-timeframe structure map that can remain on the trading chart without requiring constant switching between timeframes.
Notes
3x MTF MA Zones does not generate automatic buy or sell signals.
The green and red background represents the directional relationship between the selected moving averages after a confirmed crossover. It should not be interpreted as an automatic instruction to enter a trade.
Moving averages are based on historical price data, and interaction with an MA or MA zone does not guarantee support, resistance, continuation or reversal.
The indicator is intended as a visual market-structure and planning tool and should be combined with the user's own analysis and risk-management process. Indikator

Minor H1 BIAS Analyse## 1. Purpose of the Script
The **Minor H1 BIAS Analyse** is designed to determine the short-term directional market BIAS.
It does not provide entries. Instead, it evaluates several trend, momentum, and structure conditions and classifies the market as:
Long
Short
Neutral
The script should therefore be used as a directional filter together with a separate entry strategy.
---
## 2. Structure of the Minor BIAS
The Minor BIAS is based on five components:
EMA Trend
Price vs EMA
Current Candle Direction
Previous H1 High / Low Break
Market Structure Break
Each bullish condition adds one point to the Bull Score.
Each bearish condition adds one point to the Bear Score.
The maximum possible score is:
5 Long
5 Short
---
## 3. EMA Trend
The script uses two exponential moving averages:
Fast EMA: 20
Slow EMA: 50
If the Fast EMA is above the Slow EMA:
+1 Long
If the Fast EMA is below the Slow EMA:
+1 Short
This represents the basic trend direction.
---
## 4. ATR Neutral Buffer
The script uses an optional ATR buffer around the EMAs.
Default settings:
ATR Length: 14
ATR Multiplier: 0.20
The buffer creates a neutral zone around the EMAs.
Price must move clearly above or below both EMAs before the condition becomes bullish or bearish.
This helps filter small movements and market noise.
---
## 5. Price vs EMA
For a bullish condition, price must close above both EMAs plus the ATR Buffer.
Result:
+1 Long
For a bearish condition, price must close below both EMAs minus the ATR Buffer.
Result:
+1 Short
If price remains inside the buffer area:
No Score
The dashboard displays:
Inside Buffer
---
## 6. Current Candle Direction
The script also evaluates the current candle.
Bullish Candle:
Close above Open
+1 Long
Bearish Candle:
Close below Open
+1 Short
Doji:
No Score
This adds a simple momentum component to the BIAS.
---
## 7. Previous H1 High / Low Break
The script checks whether price closes above or below the previous candle.
Close above Previous High:
+1 Long
Close below Previous Low:
+1 Short
No Break:
No Score
This filter can be enabled or disabled in the settings.
The script uses the candle close, not only the wick.
---
## 8. Market Structure
The script also analyzes the previous market structure.
Default Lookback:
5 candles
It calculates:
Structure High
Structure Low
If price closes above the Structure High:
Bullish Structure Break
+1 Long
If price closes below the Structure Low:
Bearish Structure Break
+1 Short
If neither level is broken:
Range
No Score
---
## 9. Score System
The final Minor BIAS is calculated from the Bull Score and Bear Score.
Possible Long points:
EMA Trend
Price vs EMA
Bullish Candle
Previous High Break
Bullish Structure Break
Possible Short points:
EMA Trend
Price vs EMA
Bearish Candle
Previous Low Break
Bearish Structure Break
A minimum of three points is required.
---
## 10. Minor LONG
The Minor BIAS becomes Long when:
Bull Score is at least 3
and
Bull Score is greater than Bear Score.
Example:
Bull Score: 4
Bear Score: 1
Result:
MINOR LONG
---
## 11. Minor SHORT
The Minor BIAS becomes Short when:
Bear Score is at least 3
and
Bear Score is greater than Bull Score.
Example:
Bull Score: 1
Bear Score: 4
Result:
MINOR SHORT
---
## 12. Neutral
If neither side reaches the required conditions, the BIAS remains Neutral.
Example:
Bull Score: 2
Bear Score: 2
Result:
NEUTRAL
Neutral therefore represents an unclear or mixed market situation.
---
## 13. Dashboard
The dashboard shows the current state of every component.
It contains:
BIAS
EMA Trend
Price vs EMA
H1 Candle
Previous H1 Break
Structure
ATR Buffer
It also displays the current:
Bull Score / Bear Score
Example:
4 / 1
This makes it possible to understand why the current BIAS is Long, Short, or Neutral.
---
## 14. Chart Visualization
The script can display:
Fast EMA
Slow EMA
Previous H1 High / Low
Structure High / Low
BIAS Background
BIAS Label
Dashboard
Each visualization can be enabled or disabled individually.
The calculations continue to work even when the corresponding chart elements are hidden.
---
## 15. Alerts
The script includes alerts for:
Minor H1 LONG
Minor H1 SHORT
Minor H1 NEUTRAL
These can be used to receive a TradingView notification when the directional BIAS changes.
---
## 16. Meaning for Trading
The Minor BIAS should not be treated as an entry signal.
A simple trading rule would be:
**MINOR LONG:** Prefer Long setups.
**MINOR SHORT:** Prefer Short setups.
**NEUTRAL:** Wait for clearer conditions.
The actual entry should come from a separate trading setup.
---
## 17. BIAS Strength
The score can also be used to estimate the strength of the current direction.
3 Points:
Valid directional confirmation
4 Points:
Strong confirmation
5 Points:
Very strong alignment
For example:
5 / 0 Long
represents stronger bullish confirmation than:
3 / 2 Long
even though both are classified as MINOR LONG.
---
## 18. Important Timeframe Note
The current script uses the timeframe of the active chart.
That means the calculations are only truly based on H1 when the indicator is used on a **1-hour chart**.
If the script is placed on M5 or M1, the calculations also use M5 or M1 data.
For a true H1 BIAS that remains identical on every chart, the calculations would need to use fixed 60-minute data.
---
## 19. Conclusion
The **Minor H1 BIAS Analyse** is a score-based directional filter.
It combines:
Trend
Price Position
Momentum
Previous Candle Break
Market Structure
At least three confirmations are required for a directional BIAS.
The final result is:
MINOR LONG
MINOR SHORT
NEUTRAL
Its purpose is to identify the stronger short-term market direction before a separate entry setup is considered.
++ This was only used on NQ ++
Indikator

Indikator

Indikator

Indikator

Multi EMA Ribbon (8 Lines) - Style Zone & Labels### Overview
The **Multi EMA Ribbon (8 Lines) with Trend Dashboard** is an all-in-one trend analysis tool designed to give traders both visual chart intuition and real-time quantitative metrics.
By combining an 8-period Exponential Moving Average (EMA) ribbon with a real-time status dashboard, this script helps you quickly identify trend directions, momentum shifts, volatility squeezes, and dynamic support/resistance levels without cluttering your chart.
---
### Key Features
* **8 Fully Customizable EMAs:** Pre-configured with widely used default lengths (10, 20, 50, 100, 200, 400, 600, 800) to cover micro-scalping up to macro-trend levels.
* **Integrated Real-time Dashboard Table:**
* Displays exact price levels for all 8 EMAs.
* Shows real-time status (`BULL 🠅` or `BEAR 🠇`) based on price position relative to each EMA.
* Features an **Overall Trend Score** (e.g., 8/8 Bull = Strong Trend) for instant high-level bias confirmation.
* Fully customizable position (Top Right, Bottom Left, etc.) and text size.
* **Visual Fill Zones (Ribbon Effect):** Smooth background fills between adjacent EMAs allow you to instantly spot trend expansion, compression (squeezes), and reversals.
* **Fully Configurable in Style Tab:** All filled background zones are native plots, meaning you can toggle them individually or adjust their colors and transparency directly in the "Style" settings.
* **Clean & Dynamic Labels:** Clean numerical period tags project to the right of the current bar (with adjustable offset) to keep the chart clutter-free.
---
### How to Use
#### 1. Visual Chart Ribbon Analysis
* **Bullish Alignment:** When shorter EMAs (10, 20) are layered above longer EMAs (200, 800) and expanding outward, the market is in a strong uptrend.
* **Bearish Alignment:** When shorter EMAs are layered below longer EMAs, the market is in an established downtrend.
* **Compression / Squeeze:** When EMA lines converge tightly, volatility is dropping—often signaling an impending breakout.
* **Dynamic Support/Resistance:** During pullbacks in strong trends, price often tests specific EMA zones (e.g., EMA 20–50 or EMA 200) before resuming the primary trend.
#### 2. Dashboard Table
* **Quick Health Check:** Look at the **Overall Score** row at the bottom of the table:
* **6/8 to 8/8 Bullish (`STRONG`):** High probability long conditions / strong uptrend momentum.
* **0/8 to 2/8 Bullish (`WEAK`):** High probability short conditions / strong downtrend momentum.
* **3/8 to 5/8 (`MIXED`):** Consolidation, choppy market, or transition period.
---
### Inputs & Configuration
* **EMA Settings (Length and Color):** Adjust individual lengths, visibility, and line colors.
* **Display Settings:**
* `Show discreet EMA labels on the right`: Toggle right-side period tags.
* `Label offset to the right (bars)`: Adjust spacing of labels from the last bar.
* `Price Source`: Choose price input (Default: `Close`).
* **Dashboard Table Settings:**
* `Show EMA Dashboard Table`: Enable or disable the table.
* `Table Position`: Choose screen alignment (Top Right, Bottom Right, Top Left, Bottom Left).
* `Table Size`: Select display size (Tiny, Small, Normal).
---
### Disclaimer
This script is created for educational and analytical purposes only. Moving averages are lagging indicators and should always be combined with proper risk management, market structure, and volume analysis. Indikator

OminousLine EMAs (13/21/55/200)
OminousLine EMAs (13/21/55/200)
OminousLine EMAs is a clean and customizable trend-following indicator that combines four Exponential Moving Averages — EMA 13, 21, 55, and 200 — in a single chart overlay.
The indicator is designed to provide a clear visual overview of short-, medium-, and long-term market trends while keeping the chart simple and easy to read.
EMA Structure
The four default moving averages represent different layers of market momentum:
EMA 13 — Fast-moving EMA for short-term price action and momentum.
EMA 21 — Short-term trend reference that provides a slightly smoother view of price movement.
EMA 55 — Intermediate trend indicator that helps filter short-term market noise.
EMA 200 — Long-term trend reference commonly used to evaluate the broader market direction.
Trend Alignment
The relationship between the four EMAs can help visualize the current market structure.
A bullish EMA alignment may occur when:
EMA 13 > EMA 21 > EMA 55 > EMA 200
When the averages are aligned and separating upward, it can indicate increasing bullish momentum.
A bearish EMA alignment may occur when:
EMA 13 < EMA 21 < EMA 55 < EMA 200
When the averages are aligned and separating downward, it can indicate increasing bearish momentum.
When the EMAs begin moving closer together, it may indicate consolidation or weakening directional momentum.
Dynamic Support & Resistance
Moving averages can also act as dynamic reference areas during trending markets.
Price reactions around the EMA 13, 21, 55, or 200 can provide additional context when analyzing pullbacks, trend continuation, or changes in market structure.
These areas should not be considered fixed support or resistance levels.
Customization
OminousLine EMAs is fully customizable.
For each EMA, users can independently adjust:
EMA length
Visibility
Line color
Line width
Default configuration:
EMA 13 — Orange
EMA 21 — Cyan
EMA 55 — Amber
EMA 200 — Purple
The default colors are designed to provide clear visual separation, particularly on dark chart backgrounds.
How to Use
OminousLine EMAs can be used to help analyze:
Short-, medium-, and long-term trend direction
Bullish and bearish EMA alignment
Changes in momentum
EMA crossovers
EMA compression and expansion
Price interaction with moving averages
Potential dynamic support and resistance areas
The indicator can be used across different markets and timeframes. Traders can customize the EMA periods and appearance to suit their own analysis and trading methodology.
Important Notice
OminousLine EMAs is a visual trend-analysis tool and does not automatically generate buy or sell signals.
EMA alignment, crossovers, and price interactions should not be interpreted as guaranteed trading opportunities. The indicator is intended to complement other forms of technical analysis, market structure analysis, and appropriate risk management.
For informational and educational purposes only. Not financial advice. Indikator

RibbonFlux MA - Adaptive Flow [AFD]
Your averages are stacked and pointing the same way - but is that move widening, just holding, or already compressing?
Every MA ribbon on the shelf draws the same two or three lines and floods the gap with one colour at one opacity. So a ribbon that has pulled four ATR apart and is still separating looks exactly like a ribbon that has collapsed onto itself. The fill never tells you anything the lines didn't, which is why most people end up reading the lines and ignoring the shading entirely.
RibbonFlux makes the space between the lines carry the information. The gap is measured against ATR, ranked against its own recent history, and the shading answers to that: it deepens while the legs separate in agreement, and drains to a restrained neutral the moment they compress or lose their order. Same averages you already read - the space between them now states which of four conditions it is in.
WHY IT MATTERS
Separation and compression are the two things an MA ribbon actually knows, and the standard ribbon throws both away by drawing them identically. RibbonFlux spends its whole visual budget on that one distinction. It describes geometry already on your chart - never a prediction of what comes next, and never an instruction to act.
AT A GLANCE
Three independent averages - Lead, Base, and an optional Third. Each picks its own method, length (2-250) and price source, and a single enabled average still draws on its own.
Eight methods per slot - EMA, SMA, WMA, VWMA, HMA, RMA (Wilder), McGinley Dynamic, Fibonacci EMA Composite. Mixed freely: an HMA Lead over an EMA Base over an RMA Third is a valid setup.
Seven price sources per slot - Open, High, Low, Close, HL2, HLC3, OHLC4. Set per average rather than globally, and always on the chart timeframe.
The Flow Phase Engine - four conditions drive the fill's colour and depth: coherent expansion, stable flow, compression, mixed structure. Display only, and they never touch the MA values.
Each leg measured separately - Lead/Base and Base/Third are scored independently, so one fill can be compressing while the other expands. A single-opacity ribbon cannot show that.
Twelve palettes - Ocean, Indigo, Ember, Mono, Forest, Gold, Violet, Orderflow, Midnight, Copper, Arctic, Carbon. Or set Line color mode to Custom for a fixed colour per average, independent of the flow.
Line width and line style - 1 to 4 pixels, and Solid, Stepped, Dotted or Crosses. Applied to every core line and both halo tiers together, so the whole system thins or thickens as one.
Optional flow candles - bodies, wicks and borders take the relationship colour. Off by default, and under Adaptive dynamics they turn neutral during compression along with the ribbon.
Deliberately quiet - seven plots, two fills, one optional candle overlay. No alerts, no arrows, no dashboard, no labels, no boxes, no trendlines, nothing else drawn.
THE FOUR FLOW PHASES
Each leg of the ribbon is classified on every bar, and its own fill responds. Nothing here produces an event, and no phase ranks, scores or grades the market.
Coherent expansion - the enabled averages are in order, sloping the same way, and that leg is widening. Deepest shading: the phase factor is 1.00.
Stable flow - in order and sloping together, but the leg is not widening. Held back at 0.75.
Compression - the leg's ATR-normalized spacing sits in the bottom fifth of its own last 100 bars. Restrained neutral colour, and a phase factor of 0.00, which leaves depth at its 0.35 floor.
Mixed structure - the ordering or the slope agreement has broken. Restrained neutral colour, minimal shading at 0.25.
Compression uses a deadband, not a single threshold: a leg enters compression at a percent rank of 20 or below and only leaves it at 30 or above, so a leg hovering near one number does not flicker between two appearances. Before 100 bars of history exist, no leg is classified as compressed.
THE MECHANICS, STATED PLAINLY
ATR spacing = abs(faster average - slower average) / max(ATR(14), one tick)
leg depth = 0.35 + 0.65 x clamp(ATR spacing, 0, 1) x phase factor, then EMA-smoothed over the Flow response length
compression: enter at percent rank <= 20 over 100 bars, leave at >= 30
ordered: Lead > Base (> Third), or Lead < Base (< Third)
Flow response sets one number used three ways - the slope lookback, the expansion lookback, and the smoothing length: Quick is 2 bars, Balanced 3, Smooth 5. Setting Ribbon dynamics to Fixed bypasses the engine and holds each fill at the opacity you selected.
HOW IT DIFFERS FROM A STANDARD MA RIBBON
The fill is measured, not decorative - opacity is a function of ATR-normalized spacing and phase, recomputed every bar. A conventional ribbon fills the gap at a constant tone however wide or narrow it is.
Both legs are scored on their own terms - the Lead/Base fill and the Base/Third fill can disagree, so compression in the inner leg does not mute the outer one, or the reverse.
Compression is relative to the instrument, and sticky - a percent rank of its own history with a 20/30 deadband, not a fixed price or tick distance. It travels across symbols and timeframes without retuning.
Two methods a ribbon rarely offers - McGinley Dynamic and a Fibonacci EMA Composite. The composite is the equal-weight mean of five EMAs at Fibonacci-scaled periods; McGinley scales its own step by the fourth power of the price ratio.
The arithmetic ships with an independent open-source reference implementation - every documented formula is reproducible rather than asserted. A trust signal, not the pitch: what you are here for is the ribbon, not the tests.
THE VISUALS
Lead and Base - a crisp core line plus two restrained halo tiers each. At the default width of 2 the Lead halos are 6 and 4 pixels and the Base halos 5 and 3; Line width scales all of it together.
Glow - Off, Soft, Balanced, Rich, with opacity following Lead/Base spacing independently of the ribbon. So the lines themselves brighten as the pair separates, with a floor so they never vanish.
Ribbon shading - Off, Soft, Balanced, Rich sets the maximum depth the Flow Phases then modulate. Off removes both fills and leaves the lines.
A valid Third MA - one crisp line plus its own Base-to-Third shade. It also joins the ordering and slope tests, so enabling it makes coherence a three-line condition.
Line style - Stepped holds each value until the next bar. Dotted and Crosses place one mark per bar, so spacing follows bar width and opens up as you zoom in. Pine's plot() has no stroked dotted or dashed line, and this script uses no drawing objects to fake one.
Layering - the lines and fills draw in front of the candles, not behind them. Deliberate, so the optional flow candles can colour wicks and borders as well as bodies; if it reads heavy, Line width 1 or Glow Soft thins it.
HOW TO USE IT
Start with the defaults - Close EMA 9 over Close EMA 21, Ocean, Balanced glow and shading, Adaptive dynamics. Chosen for readability, not tuned as trading parameters.
Enable the Third MA for slower context - it defaults to Close EMA 50. Ordering then requires all three in sequence, a stricter condition than two.
Reach for Flow response first - Quick if the shading feels sluggish, Smooth if it feels twitchy. It is the one control that changes how fast the appearance reacts.
Set Ribbon dynamics to Fixed to switch the engine off - a plain constant-opacity ribbon, for comparing against what you ran before. Everything else, from palette to custom colours to width, style, glow and candle colouring, is taste: set it once and leave it.
WHAT IT DELIBERATELY DOES NOT DO
It issues no alerts and has no alert conditions at all. It draws no arrows, entries, retests, setup zones, targets or labels, keeps no dashboard or readout, and ranks, scores and grades nothing. It makes no accuracy, reliability, profitability, probability or future-result claim of any kind. Moving averages are lagging transformations of price that has already printed: visible separation, alignment or colour establishes neither future direction nor the quality of any trade. Educational chart context only - not financial advice.
DATA, TIMEFRAMES, AND WHAT TO CHECK YOURSELF
Everything is computed on your chart's own timeframe and data - there are no higher-timeframe requests anywhere in the source, so there is no lookahead argument to disclose and no second feed to reconcile against your chart.
Any MA moves while its bar is still forming , and two parts of this script also carry state from bar to bar: the McGinley recursion and the compression deadband. That describes the mechanism. Confirm it with the bar-replay tool on your own symbol and timeframe before relying on it - a description of mechanism is not that check, and nothing here claims to be.
The averages read chart OHLC - on Heikin Ashi, Renko, Range or similar they average those synthetic values, not traded prices. Use standard time-based candles if you want the averages to describe real prices.
VWMA needs usable volume, and the Fibonacci EMA Composite needs a length of 8 or more - each is simply unavailable otherwise. A selected calculation that cannot be produced stays unavailable: the script never silently substitutes another method.
McGinley seeds from an SMA of its own length, then advances by previous + (source - previous) / (0.6 x length x ratio^4). If its source or recurrence goes invalid the line goes unavailable and reseeds only after the next contiguous valid window.
Identical Lead and Base settings leave nothing to read - both lines still draw, but the ribbon and flow candles switch off and the lines fall back to neutral. A Third duplicating Lead or Base likewise draws its line while taking no shade and no phase depth.
ORIGINALITY AND CREDIT
Ribbon indicators are old ground; what is new here is that the fill is a measurement rather than a decoration - ATR-normalized leg spacing, a relative compression rank with hysteresis, and per-leg depth, all resolved into colour and opacity and nothing else. The engine is deliberately confined to display, and the surface is deliberately small.
Open source under the Mozilla Public License 2.0. (c) Auction Foundry LLC.
This indicator describes the geometry of averages computed from your chart's own price history. It is not a forecast, not a signal, and not financial advice. Indikator

Efficiency Ratio Adaptive Moving Average (ERAMA)Efficiency Ratio Adaptive Moving Average (ERAMA)
Efficiency Ratio Adaptive Moving Average (ERAMA) is a smooth adaptive moving average that uses Kaufman's Efficiency Ratio to shift between fast and slow EMA behavior. It then applies WMA and EMA smoothing followed by length-adjusted lag reduction.
The objective is to combine three useful properties in one line: adapt to the directional efficiency of recent price movement, maintain a visually stable baseline, and recover part of the delay introduced by smoothing. ERAMA adjusts the balance between smoothness and responsiveness using current and historical data.
How ERAMA Is Calculated
1. Efficiency Ratio
ERAMA first measures how efficiently the selected Source has moved over the ER Length:
Change = |Source − Source from ER Length bars ago|
Volatility = Sum of |Source − Previous Source| over the ER Length
ER = Change ÷ Volatility
The Efficiency Ratio is bounded between 0 and 1:
• ER near 1 — most movement contributed to net progress in one direction
• ER near 0 — price traveled back and forth with little net progress
Because both Change and Volatility scale with price movement, ER is independent of the instrument's nominal price level.
2. Efficiency-Adaptive EMA Blend
The Fast and Slow lengths create two conventional EMAs of the selected Source:
Fast EMA = EMA(Source, Fast Length)
Slow EMA = EMA(Source, Slow Length)
ERAMA blends these two lines using the current Efficiency Ratio:
Adaptive = Slow EMA + ER × (Fast EMA − Slow EMA)
When ER is high, Adaptive moves closer to the Fast EMA. When ER is low, it stays closer to the Slow EMA. Intermediate ER values produce a proportional blend between the two.
This construction uses Kaufman's Efficiency Ratio as an adaptive weight, but it is not the standard recursive Kaufman Adaptive Moving Average (KAMA) formula.
3. WMA and EMA Smoothing
The adaptive blend passes through two smoothing stages:
WMA Base = WMA(Adaptive, WMA Smooth Length)
Smoothed = EMA(WMA Base, EMA Smooth Length)
The WMA gives greater weight to recent observations. The following EMA softens residual variation and determines the main output horizon. Higher values create a steadier line but also introduce more delay.
4. Length-Adjusted Lag Reduction
ERAMA compares the Smoothed line with an EMA-smoothed version of itself:
Responsiveness Scale = Min(1, 50 ÷ EMA Length)^Responsiveness Length Decay
Effective Responsiveness = Responsiveness × Responsiveness Scale
ERAMA = Smoothed + Effective Responsiveness ×
The difference between Smoothed and EMA(Smoothed) acts as a DEMA-style lag correction. A Responsiveness value of 0 disables this correction. A value of 1 applies the full correction before length scaling.
For EMA lengths of 50 or less, Responsiveness Scale equals 1. Above 50, the scale decreases gradually according to Responsiveness Length Decay. This keeps one Responsiveness setting practical across short and long EMA lengths. A decay value of 0 disables length-based scaling.
The Mathematical Idea
ERAMA separates adaptation, smoothing, and lag reduction into distinct stages.
The Efficiency Ratio controls the position between two already-defined EMA responses. WMA and EMA then create a stable output baseline. Finally, a partial DEMA-style correction restores part of the response lost to smoothing. The correction is reduced progressively for longer EMA lengths, where the distance between a line and its second EMA can otherwise become disproportionately large.
This is a causal construction: every stage uses only current and past data. The lag-reduction term can increase turning sensitivity and may create overshoot at aggressive settings, but the Responsiveness and Responsiveness Length Decay controls make that tradeoff explicit.
Characteristics and Advantages
• Efficiency-based adaptation using a bounded 0-to-1 ratio
• Interpretable Fast and Slow EMA anchors
• WMA and EMA smoothing for a stable visual baseline
• Adjustable partial-DEMA lag reduction
• Automatic responsiveness scaling for longer EMA lengths
How to Read ERAMA
Read ERAMA through its slope, its position relative to price, and the behavior of price around the line.
Slope
A rising ERAMA indicates that the smoothed adaptive baseline is moving higher. A falling ERAMA indicates that it is moving lower. A flattening line suggests weaker directional progress or a transition between trend phases.
Price Position
Price holding above a rising ERAMA supports a bullish directional interpretation. Price holding below a falling ERAMA supports a bearish interpretation. Repeated crossings often occur when price is rotating around the adaptive baseline or directional control is weak.
Distance and Reversals
A widening distance between price and ERAMA can reflect strong momentum or extension from the baseline. The lag-reduction stage helps ERAMA respond sooner when the smoothed path turns.
Understanding the Settings
Source
Selects the price series used by ERAMA. The default is HLCC4: the average of High, Low, Close, and Close.
ER Length
Controls the period used to measure directional efficiency. Lower values react to recent path changes sooner. Higher values evaluate efficiency over a broader window.
Fast Length
Sets the Fast EMA used by the adaptive blend. Lower values make the high-efficiency response faster. Fast Length must be lower than Slow Length.
Slow Length
Sets the Slow EMA used by the adaptive blend. Higher values make the low-efficiency response more conservative. Slow Length must be higher than Fast Length.
Responsiveness
Controls the strength of the lag-reduction term. A value of 0 uses the fully smoothed line. Higher values reduce more lag but can increase turning sensitivity and overshoot.
Responsiveness Length Decay
Controls how strongly Responsiveness decreases for EMA lengths above 50. Higher values apply more reduction to long-period lines. A value of 0 uses the same Responsiveness at every EMA length.
WMA Smooth Length
Controls the first smoothing stage. Higher values produce a steadier line with more delay.
EMA Smooth Length
Controls the primary output horizon and the period used by the lag-reduction EMA. Higher values create a smoother, slower baseline.
Default Configuration
Source: HLCC4
ER Length: 10
Fast Length: 2
Slow Length: 30
Responsiveness: 0.88
Responsiveness Length Decay: 0.15
WMA Smooth Length: 12
EMA Smooth Length: 20
Practical Use
ERAMA can serve as an adaptive trend baseline, directional filter, pullback reference, or trade-management guide. It is intended for traders who prefer to interpret slope and price structure directly.
Responsiveness can be tuned to emphasize steadier trend tracking or earlier reactions to short-term changes. The settings can be adapted to the instrument, timeframe, and intended holding period.
---
Efficiency Ratio Adaptive Moving Average (ERAMA)
Efficiency Ratio Adaptive Moving Average(效率比率自適應移動平均線)是一條平滑的自適應移動平均線。它利用考夫曼效率比率(Efficiency Ratio),在快速與慢速 EMA 之間調整,再依次套用 WMA、EMA 平滑及按長度調整的延遲縮減。
ERAMA 的目標,是在一條線內結合三項特性:根據近期價格移動的方向效率作出適應、維持視覺穩定的基準,以及追回部分平滑所造成的延遲。ERAMA 使用目前及歷史資料,調整平滑度與反應速度之間的平衡。
ERAMA 如何計算
1. 效率比率
ERAMA 先衡量所選 Source 在 ER Length 期間內的移動效率:
變化 = |目前 Source − ER Length 之前的 Source|
波動 = ER Length 內每根 K 線之 |Source − 前一個 Source| 總和
ER = 變化 ÷ 波動
效率比率保持在 0 至 1 之間:
• ER 接近 1 — 大部分移動形成單一方向的淨進展
• ER 接近 0 — 價格反覆來回,總路徑較長但淨進展有限
由於變化與波動都會隨價格移動幅度同比例改變,因此 ER 不受商品名義價格水平影響。
2. 效率自適應 EMA 混合
Fast 與 Slow 長度會從所選 Source 建立兩條傳統 EMA:
Fast EMA = EMA(Source,Fast Length)
Slow EMA = EMA(Source,Slow Length)
ERAMA 使用目前的效率比率混合兩條線:
Adaptive = Slow EMA + ER ×(Fast EMA − Slow EMA)
ER 偏高時,Adaptive 會靠近 Fast EMA;ER 偏低時,則靠近 Slow EMA。介乎兩者之間的 ER 會按比例混合兩條 EMA。
這個結構使用考夫曼效率比率作為自適應權重,但並不是標準的遞迴考夫曼自適應移動平均線(KAMA)公式。
3. WMA 與 EMA 平滑
自適應混合結果會通過兩層平滑:
WMA Base = WMA(Adaptive,WMA Smooth Length)
Smoothed = EMA(WMA Base,EMA Smooth Length)
WMA 對較近期數值給予更高權重,後續 EMA 則柔化剩餘變化,並決定主要輸出週期。較高數值會令線條更穩定,但亦會增加延遲。
4. 按長度調整的延遲縮減
ERAMA 會比較 Smoothed 與其 EMA 平滑版本:
Responsiveness Scale = Min(1,50 ÷ EMA Length)^Responsiveness Length Decay
Effective Responsiveness = Responsiveness × Responsiveness Scale
ERAMA = Smoothed + Effective Responsiveness ×
Smoothed 與 EMA(Smoothed)之間的差值形成 DEMA 式延遲修正。Responsiveness 設為 0 會停用修正;設為 1 則代表在長度縮放前套用完整修正。
EMA Length 為 50 或以下時,Responsiveness Scale 等於 1。高於 50 後,縮放值會按照 Responsiveness Length Decay 逐步下降,令同一組 Responsiveness 設定可以較合理地跨越短期及長期 EMA 使用。Decay 設為 0 會停用按長度縮放。
數學設計
ERAMA 把自適應、平滑及延遲縮減分成三個獨立階段。
效率比率控制結果在兩條既定 EMA 反應之間的位置;WMA 與 EMA 形成穩定輸出基準;最後的部分 DEMA 式修正,追回一部分因平滑而失去的反應速度。對較長 EMA 而言,線條與其第二層 EMA 之間的差距可能較大,因此修正會隨長度逐步降低。
整個結構只使用目前及過往資料。延遲縮減可提高轉向靈敏度,較進取的設定亦可能產生超調;Responsiveness 與 Responsiveness Length Decay 讓這項取捨可以直接調整。
特性與優點
• 使用 0 至 1 有界效率比率作出適應
• Fast 與 Slow EMA 具有清晰可解釋的反應界線
• WMA 與 EMA 平滑形成穩定視覺基準
• 可調整的部分 DEMA 式延遲縮減
• 長週期 EMA 自動降低反應修正
如何閱讀 ERAMA
閱讀 ERAMA 時,應觀察線條斜率、價格相對位置,以及價格在線條附近的行為。
斜率
ERAMA 上升表示平滑後的自適應基準正在提高;ERAMA 下跌表示基準正在降低。線條逐漸走平,通常代表方向進展減弱,或市場正處於趨勢轉換階段。
價格位置
價格維持在上升 ERAMA 之上,可支持偏多方向判斷;價格維持在下降 ERAMA 之下,可支持偏空判斷。價格反覆穿越 ERAMA,通常出現在價格圍繞自適應基準旋轉,或方向控制偏弱的市況。
距離與轉向
價格與 ERAMA 的距離擴大,可能反映動能增強或價格已偏離基準。延遲縮減讓 ERAMA 在平滑路徑轉向時較早反應。
設定說明
Source
選擇 ERAMA 使用的價格序列。預設為 HLCC4,即 High、Low、Close、Close 的平均值。
ER Length
控制衡量方向效率的期間。較低數值會更快反映近期路徑變化;較高數值則在較廣時間範圍內評估效率。
Fast Length
設定自適應混合使用的 Fast EMA。較低數值會加快高效率市況下的反應。Fast Length 必須低於 Slow Length。
Slow Length
設定自適應混合使用的 Slow EMA。較高數值會令低效率市況下的反應更保守。Slow Length 必須高於 Fast Length。
Responsiveness
控制延遲縮減項的強度。設為 0 時使用完整平滑後的線條;較高數值會追回更多延遲,但亦可能提高轉向靈敏度及超調。
Responsiveness Length Decay
控制 EMA Length 高於 50 後,Responsiveness 隨長度下降的幅度。較高數值會對長週期線條施加更大降幅;設為 0 則所有 EMA Length 使用相同 Responsiveness。
WMA Smooth Length
控制第一層平滑。較高數值會形成更穩定但延遲更多的線條。
EMA Smooth Length
控制主要輸出週期,以及延遲縮減 EMA 所使用的週期。較高數值會形成更平滑、較慢的基準。
預設設定
Source:HLCC4
ER Length:10
Fast Length:2
Slow Length:30
Responsiveness:0.88
Responsiveness Length Decay:0.15
WMA Smooth Length:12
EMA Smooth Length:20
實際應用
ERAMA 可作為自適應趨勢基準、方向過濾器、回調參考或交易管理線,適合希望直接解讀斜率及價格結構的交易者。
Responsiveness 可用來偏向更穩定的趨勢跟隨,或更早反映短期變化。設定可按商品、時間週期及預計持倉時間調整。
---
Efficiency Ratio Adaptive Moving Average (ERAMA)
Efficiency Ratio Adaptive Moving Average(効率比適応型移動平均線)は、カウフマンの効率比(Efficiency Ratio)を利用して速いEMAと遅いEMAの挙動を動的に切り替える、滑らかな適応型移動平均線です。WMA(加重移動平均)とEMA(指数移動平均)による平滑化を行った後、期間長に連動したラグ(遅延)削減処理を適用します。
ERAMAの目的は、3つの有用な特性を1本のラインに統合することです。すなわち、近年の価格値動きの方向性効率に適応すること、視覚的に安定したベースラインを維持すること、そして平滑化によって生じる遅延の一部を取り戻すことです。ERAMAは、現在および過去のデータを用いて平滑性と応答性のバランスを調整します。
ERAMA の計算方法
1. 効率比(Efficiency Ratio)
ERAMAはまず、選択された Source が ER Length 期間内にどれほど効率的に動いたかを測定します。
変化量 = |現在の Source − ER Length 本前の Source|
変動量 = ER Length 期間内の各バーにおける |Source − 前回の Source| の総和
効率比(ER)= 変化量 ÷ 変動量
効率比(ER)は 0 から 1 の範囲に収まります。
• ERが 1 に近い — 値動きの大半が一定方向への純粋な推進に寄与している
• ERが 0 に近い — 価格が反覆移動を繰り返し、総移動距離に対して純推進がほとんどない
変化量と変動量の双方が価格の移動規模に応じてスケールするため、ERは銘柄固有の価格水準(呼び値)に依存しません。
2. 効率適応型 EMA ブレンド
Fast Length と Slow Length のパラメータにより、選択した Source から2つの従来の EMA を作成します。
Fast EMA = EMA(Source, Fast Length)
Slow EMA = EMA(Source, Slow Length)
ERAMAは、現在の効率比(ER)を用いてこれら2つのラインをブレンドします。
Adaptive = Slow EMA + ER ×(Fast EMA − Slow EMA)
ERが高いとき、Adaptiveは Fast EMA に近づきます。ERが低いとき、Slow EMA の近くにとどまります。中間のER値では、2つのEMA間で比例的なブレンドが行われます。
この構造はカウフマンの効率比を適応型ウェイトとして使用していますが、標準的な再帰型カウフマン自適応移動平均線(KAMA)の計算式とは異なります。
3. WMA および EMA による平滑化
自適応ブレンド(Adaptive)は、2段階の平滑化処理を通過します。
WMA Base = WMA(Adaptive, WMA Smooth Length)
Smoothed = EMA(WMA Base, EMA Smooth Length)
WMAは直近のデータに高い重みを置きます。続くEMAは残留変動をなめらかにし、主要な出力周期(時間軸)を決定します。数値を高く設定するほどラインは安定しますが、遅延も大きくなります。
4. 期間長に応じたラグ(遅延)削減
ERAMAは、Smoothed ラインと、それをさらにEMA平滑化したラインを比較します。
Responsiveness Scale = Min(1, 50 ÷ EMA Length)^Responsiveness Length Decay
Effective Responsiveness = Responsiveness × Responsiveness Scale
ERAMA = Smoothed + Effective Responsiveness ×
Smoothed と EMA(Smoothed)の差分は、DEMA(二重指数移動平均)スタイルのラグ補正として機能します。Responsiveness を 0 に設定するとこの補正は無効になり、1 に設定すると期間長のスケーリングが適用される前の完全な補正が行われます。
EMA Length が 50 以下のケースでは、Responsiveness Scale は 1 となります。50 を超えると、Responsiveness Length Decay に従ってスケーリング値が徐々に低下します。これにより、短期から長期のEMA期間まで同一の Responsiveness 設定を合理的に運用できます。Decay を 0 に設定すると、期間長に基づくスケーリングが無効になります。
数学的概念と設計思想
ERAMAは「適応」「平滑化」「ラグ削減」を独立した段階として明確に分離しています。
効率比(ER)が、あらかじめ定義された2つのEMA応答の間の位置を制御します。次にWMAとEMAが安定した出力ベースラインを形成します。最後に、部分的なDEMAスタイル補正によって、平滑化で失われた応答速度の一部を取り戻します。長期間のEMAでは、ラインとその2次EMAの間の乖離が過大になる可能性があるため、補正量は長さに応じて段階的に削減されます。
これは完全な因果的構造であり、すべての段階で現在および過去のデータのみを使用します。ラグ削減機能は転換の感度を高める一方で、アグレッシブな設定ではオーバーシュートを引き起こす可能性がありますが、Responsiveness と Responsiveness Length Decay のコントロールにより、このトレードオフを明示的に調整できます。
特徴とメリット
• 0〜1 の有界な効率比に基づく自適応性
• 明確に解釈可能な Fast および Slow EMA アンカー
• 安定した視覚的ベースラインを形成する WMA および EMA 平滑化
• 調整可能な部分 DEMA スタイル・ラグ削減
• 長期 EMA 期間におけるレスポンス補正の自動スケーリング
ERAMA の読み方・分析方法
ERAMAを読み解く際は、ラインの傾き、価格の相対位置、そしてライン周辺での価格の挙動に着目します。
傾き(スロープ)
ERAMAの上昇は、平滑化された自適応ベースラインが切り上がっていることを示します。ERAMAの下降は、ベースラインが切り下がっていることを示します。ラインの平坦化は、方向性の勢いの減衰、またはトレンドの移行期を示唆します。
価格の位置関係
価格が上昇するERAMAの上方で推移している場合は強気(ブル)の方向性を支持し、下降するERAMAの下方で推移している場合は弱気(ベア)の方向性を支持します。ERAMAとの頻繁な交差(クロスオーバー)は、価格がベースライン付近で保ち合いを形成しているか、方向性の主導権が弱い状態によく見られます。
乖離と反転
価格とERAMAとの距離が拡大している場合は、強力なモメンタムまたはベースラインからの乖離を反映しています。ラグ削減ステージにより、平滑化された軌跡が反転する際、ERAMAはより早期に反応することができます。
設定パラメータの理解
Source
ERAMAで使用する価格シリーズを選択します。デフォルトは HLCC4(High, Low, Close, Close の平均値)です。
ER Length
方向性の効率(Efficiency Ratio)を測定する期間を制御します。値が小さいほど直近の値動きの変化に素早く反応し、値が大きいほど広い期間で効率性を評価します。
Fast Length
適応ブレンドで使用する Fast EMA を設定します。値が小さいほど、高効率相場での反応が速くなります。Fast Length は Slow Length より小さく設定する必要があります。
Slow Length
適応ブレンドで使用する Slow EMA を設定します。値が大きいほど、低効率相場での反応が控えめになります。Slow Length は Fast Length より大きく設定する必要があります。
Responsiveness
ラグ削減項の強度を制御します。0 に設定すると完全に平滑化されたラインを使用します。高い値を設定するほどラグが解消されますが、転換時の感度やオーバーシュートが増加する場合があります。
Responsiveness Length Decay
EMA Length が 50 を超えた際に、Responsiveness が減衰する度合いを制御します。高い値を設定するほど長期ラインへの減衰が強く適用されます。0 に設定すると、すべての EMA Length で同じ Responsiveness が適用されます。
WMA Smooth Length
第1段階の平滑化期間を制御します。値が大きいほど、より遅延のある安定したラインを生成します。
EMA Smooth Length
主要な出力周期およびラグ削減用 EMA の期間を制御します。値が大きいほど、より平滑で緩やかなベースラインを生成します。
デフォルト設定
Source: HLCC4
ER Length: 10
Fast Length: 2
Slow Length: 30
Responsiveness: 0.88
Responsiveness Length Decay: 0.15
WMA Smooth Length: 12
EMA Smooth Length: 20
実戦での活用方法
ERAMAは、自適応型のトレンドベースライン、方向性フィルター、押し目・戻りの参照線、あるいはトレード管理ガイドとして活用できます。ラインの傾きや価格構造を直接解釈することを好むトレーダーに適しています。
Responsiveness をチューニングすることで、安定したトレンド追従を重視するか、短期的な変化への早期反応を重視するかを調整できます。設定は取引銘柄、時間軸、および想定する保有期間に応じて最適化することが可能です。
Indikator

Single Timeframe Multi-EMA Trend Table### Overview
The **Single Timeframe Multi-EMA Trend Table** displays the directional bias of 7 customizable Exponential Moving Averages (EMAs) calculated from a single, higher timeframe of your choice.
This allows traders working on lower execution timeframes (e.g., 1-minute or 5-minute charts) to effortlessly monitor macro trend alignment and EMA support/resistance zones from higher timeframes (e.g., 15m, 1h, or 4h) without switching charts.
---
### Key Features
* **Selectable Target Timeframe:** Choose any timeframe (1m, 5m, 15m, 1h, 4h, 1D, etc.) to fetch EMA data from.
* **7 Customizable EMAs:** Define 7 individual EMA lengths (e.g., EMA 9, 20, 50, 100, 150, 200, 800) to monitor full trend structure.
* **Consolidation Detection:** Identifies when price is compressing or trading close to a specific EMA line, marking it as a **RANGE 🟡** state.
* **Clean UI:** Displays chosen timeframe in the table header alongside active EMA lengths and clear color-coded statuses.
---
### How to Use
1. **Set Target Timeframe:** In the settings, choose the macro timeframe you want to base your analysis on (e.g., 15m).
2. **Configure EMAs:** Input your preferred EMA lengths.
3. **Gauge Trend Strength:**
* **Full Bullish Alignment:** All or most EMAs show `BULLISH 🟢`.
* **Compression/Ranging:** Multiple EMAs show `RANGE 🟡`, warning of choppy price action. Indikator

Multi-Timeframe Trend & Consolidation Table### Overview
The **Multi-Timeframe Trend & Consolidation Table** is a lightweight dashboard indicator designed to give traders a quick, multi-timeframe overview of the market trend and consolidation status directly on their chart.
Instead of switching between multiple timeframes or cluttering your chart with dozens of moving averages, this tool consolidates trend data across 10 different timeframes into a clean, customizable table.
---
### Key Features
* **Multi-Timeframe Analysis:** Monitors **1m, 3m, 5m, 10m, 15m, 1h, 4h, 1D, 1W, and 1M** timeframes simultaneously.
* **Customizable EMA Periods:** Set unique Exponential Moving Average (EMA) lengths for every individual timeframe (e.g., EMA 10 for 1m, EMA 50 for 1h, EMA 200 for 1D).
* **Consolidation Detection:** Built-in threshold logic identifies when price is hovering extremely close to the EMA line, signaling potential range-bound/chop market conditions.
* **Dynamic Table UI:** Displays the specific EMA length assigned to each timeframe directly inside the table for clear tracking. Fully customizable position (Top Right, Bottom Left, etc.) and text sizes.
---
### How It Works
The indicator compares the price of each timeframe against its assigned EMA line:
1. **BULLISH 🟢:** Current close price is above the timeframe's EMA (outside the consolidation zone).
2. **BEARISH 🔴:** Current close price is below the timeframe's EMA (outside the consolidation zone).
3. **RANGE 🟡:** Price percentage difference from the EMA is smaller than the set threshold (e.g., within 0.15%), indicating market consolidation or flat movement.
---
### How to Use
1. **Trend Alignment:** Look for timeframes aligning in the same direction (e.g., 1h, 4h, and 1D all green) to trade with the macro trend.
2. **Avoiding Chop:** When lower timeframes show `RANGE 🟡`, it indicates low volatility or moving average compression, warning you to avoid breakout trades or wait for confirmation.
3. **Execution Timeframes:** Tune lower timeframes (1m, 3m, 5m) to fast EMAs for scalp setups, while keeping higher timeframes (1D, 1W) on key levels like the 200 EMA.
---
### Settings & Inputs
* **EMA Lengths per Timeframe:** Set custom EMA periods for all 10 available timeframes.
* **Enable Consolidation Detection:** Toggle range detection on or off based on your strategy preference.
* **Consolidation Threshold (%):** Adjust the distance percentage between close price and EMA to define a range zone (default is 0.15%).
* **Table Display:** Adjust table placement on your screen and text font size. Indikator