Indikator

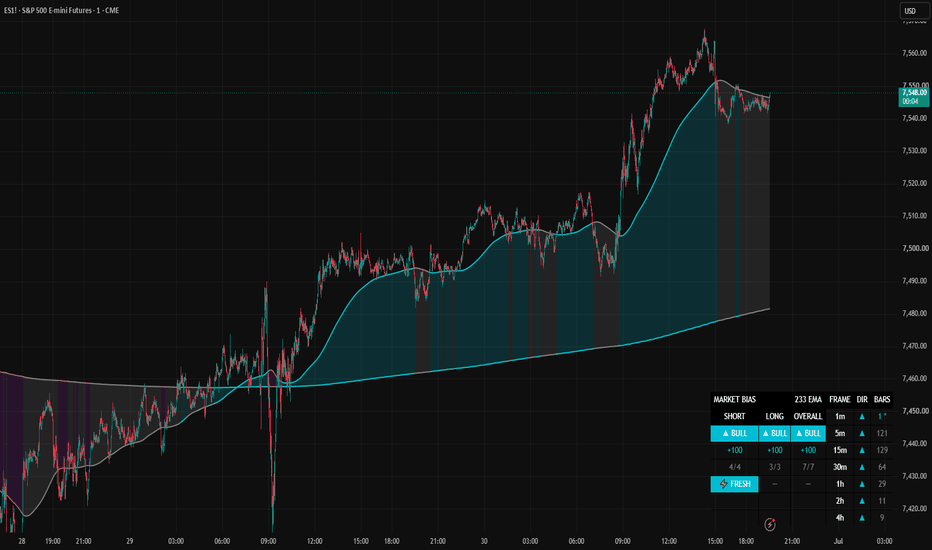
STRYK Market BiasMulti-timeframe EMA-alignment dashboard: short-term, long-term, and overall bias boxes, plus an optional two-line color band.
# STRYK Market Bias
A multi-timeframe EMA-alignment dashboard. It reads one moving average across several timeframes at once and summarizes how those timeframes line up into two composite readings — a short-term read and a long-term read — plus a combined overall read. It can also draw a two-line band on the chart. This is a descriptive context tool for discretionary analysis. It does not generate buy or sell signals.
## What it does
For each of several timeframes, it checks whether price is above or below that timeframe's EMA. Above reads bull, below reads bear. Those individual reads are combined into a weighted score for each group and shown as simple BULL / BEAR / NEUTRAL boxes, so you can see multi-timeframe alignment at a glance instead of loading the same moving average on seven separate charts.
## How it works
**One EMA, many timeframes.** A single EMA length (default 233) is applied to each timeframe: fast frames (5m / 15m / 30m, with an optional 1m) and slow frames (1h / 2h / 4h). All higher-timeframe values are taken from the last closed bar by default, so they do not repaint.
**Each frame votes.** Price above its EMA = +1 (bull), below = −1 (bear).
**Two composites, weighted differently on purpose:**
- **Short-term** emphasizes *freshness*. A fast frame that has just flipped receives a temporary extra weight that decays back to normal over a set number of bars, so recent changes on the fast frames carry more emphasis than stale ones.
- **Long-term** emphasizes *persistence*. The longer a slow frame has held its side, the more its vote weighs (up to a cap), so a slow frame that has stayed on one side for a long time carries more of the read.
Each group's score runs from −100 to +100 and is mapped to BULL / BEAR / NEUTRAL with an adjustable threshold. The **Overall** box is a blend of the two (default 60% long-term / 40% short-term, adjustable). A **fresh flag** lights when a fast frame flips within the fresh window in the same direction as the short-term read.
**Per-frame grid (optional).** Expand it to see every timeframe's own arrow and its own bars-since-flip, so you can tell which timeframe is driving or breaking the score.
## The band (optional)
Pick any two timeframes (default 1m and 4h). The EMA of each is drawn as a line and the area between them is filled. The band and lines are colored by where price sits relative to the two lines: above both, between them, or below both. A **fade** option holds the current color until price stays in a new zone for a set number of bars, so a brief poke into the band does not immediately change the color.
## How to use it
Treat it as context, not instructions. When all the boxes agree and sit at their extremes, the timeframes are simply aligned. The more informative moments are when the short-term and long-term reads diverge, or when a fresh flip appears against the current read. Use the per-frame grid to see exactly which timeframe is responsible.
Everything is adjustable: the EMA length and source, which timeframes are used, the weighting mode per group, the fresh and persistence settings, the threshold and overall blend, and the band and its colors, transparency and fade.
## Notes
- With non-repaint on (default), higher-timeframe reads are delayed by one bar of that timeframe in exchange for values that do not change after the fact. Turn it off for live intrabar values, which repaint.
- Timeframes smaller than your chart timeframe are sampled at chart resolution.
- Alerts are provided for short-term, long-term, and overall state changes.
## Disclaimer
This script is for informational and educational purposes only. It does not produce buy or sell signals and makes no claim about future results. Do your own analysis and manage your own risk. Indikator
MTF MA Cross Table Pro**Multi-Timeframe MA Cross**
Multi-Timeframe MA Cross is a moving average dashboard and overlay tool designed to help traders quickly see whether price is trading above or below key exponential moving averages across multiple timeframes.
The indicator displays a table showing the relationship between price and the selected EMA lengths across several major timeframes, including:
* 1 Minute
* 5 Minute
* 15 Minute
* 1 Hour
* 4 Hour
* 1 Day
* 1 Week
Each timeframe is checked against the 20, 50, 100, and 200 EMA.
The table shows whether price is **Above** or **Below** each moving average.
**Table Colour Rules**
* **Green** = price is above the selected EMA
* **Red** = price is below the selected EMA
This gives a quick visual map of trend strength and moving average positioning across multiple timeframes.
**Main Features**
* Multi-timeframe EMA dashboard
* Tracks 20, 50, 100, and 200 EMA conditions
* Green/red table cells for fast trend reading
* Adjustable MA lengths
* Adjustable table text size
* Current timeframe EMA overlays
* Optional 20, 50, 100, and 200 EMA plots
* Optional weekly EMA overlays
* Designed for quick multi-timeframe trend confirmation
**Overlay Moving Averages**
The indicator can also plot moving averages directly on the chart, including:
* Current timeframe 20 EMA
* Current timeframe 50 EMA
* Current timeframe 100 EMA
* Current timeframe 200 EMA
* Weekly 20 EMA
* Weekly 50 EMA
* Weekly 100 EMA
Each moving average can be turned on or off from the settings panel.
**Suggested Use**
This indicator can be used to quickly assess whether price is aligned above or below important moving averages across short-term, intraday, daily, and weekly timeframes.
It may help traders identify broader trend alignment, support and resistance zones, and areas where multiple timeframe moving averages are acting as confirmation.
For example, if price is above the 20, 50, 100, and 200 EMA across multiple higher timeframes, this may suggest stronger bullish trend alignment. If price is below those averages, it may suggest weaker or bearish conditions.
**Disclaimer**
This indicator is designed as a visual trend and moving-average reference tool only. It is not financial advice and should not be used on its own for trade entries or exits. Always combine it with your own analysis, market structure, risk management, and trading plan.
Indikator

Ultimate Hull SuiteGreymyst Ultimate Hull Suite
The Greymyst Ultimate Hull Suite is a premium, multi-functional trend-following indicator designed to provide traders with highly accurate, low-lag momentum signals. Built entirely from the ground up for professional trading, this suite combines advanced Moving Average variations with dynamic volatility filters and multi-timeframe analysis to offer extreme confluence in a single tool.
🌟 Core Concepts & Features
1. Advanced Hull Variations
Traditional moving averages often suffer from lag. The Hull Moving Average solves this by prioritizing recent price action. This suite allows you to toggle between three powerful variations:
HMA (Standard Hull): The classic low-lag moving average.
EHMA (Exponential Hull): Uses exponential calculations to react even faster to sudden price spikes.
THMA (Triple Hull): Offers ultra-smooth trend detection, practically eliminating market noise and false signals during choppy ranges.
2. Multi-Timeframe (MTF) Alignment
Trading against the macro trend is a common pitfall. The built-in MTF engine allows you to anchor your Hull Moving Average to a higher timeframe (e.g., viewing the 4-Hour Hull trend on a 15-minute chart). This ensures you are only taking trades that align with the dominant market direction.
3. Dynamic Volatility Bands (Hull Envelopes)
Instead of static support and resistance, this suite wraps the Hull Moving Average in ATR-based Volatility Bands.
Trend Cloud: The area between the Hull and the bands is filled with a bullish (green) or bearish (red) cloud.
Mean Reversion: When price action aggressively pierces the upper or lower bands, it signals an overextended market, warning you of potential pullbacks or mean-reversion opportunities.
4. Squeeze Momentum Confluence Filter
A trend is only as strong as the volume and volatility behind it. This indicator integrates a hidden Squeeze Volatility Engine (combining Bollinger Bands and Keltner Channels).
The Filter: Buy and Sell signals are strictly suppressed if the market is stuck in a low-volatility "squeeze" (consolidation).
Signals are only generated when the Hull changes direction AND volatility is actively expanding, keeping you out of flat, choppy markets.
5. Automated Signals & Alerts
The suite visually prints clear B (Buy) and S (Sell) markers on your chart when high-probability confluence is met (Trend Shift + Volatility Expansion).
It includes comprehensive, ready-to-use Alert Conditions so you can automate your trading via webhooks or receive notifications directly to your phone.
⚙️ How to Use It for Confluence
Trend Confirmation: Use the color of the Hull MA (Green for Up, Red for Down) as your primary directional bias.
Entry Triggers: Look for Buy/Sell markers printed by the indicator. Because of the built-in Squeeze filter, these markers represent moments where price is reversing with momentum.
Take Profit / Stop Loss: Use the outer ATR bands as dynamic profit targets or trailing stop-loss zones.
(Created by greymyst) Indikator

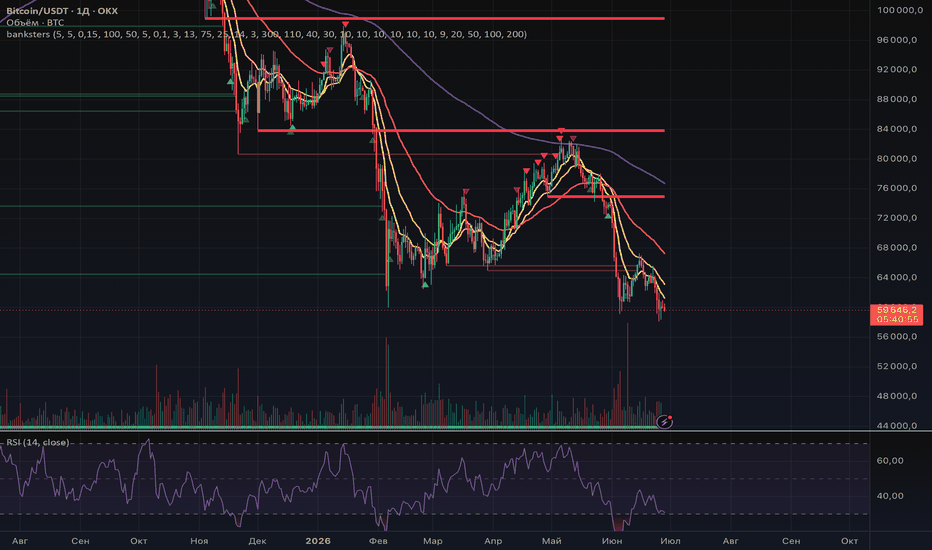
bankstersOverview & Synergistic Concept
Banksters Workspace is a multi-component trading framework designed to combine structural market levels, momentum divergence tracking, and dynamic trend filtering into a single, cohesive workspace.
Instead of cluttering the chart with standalone scripts, this tool integrates three distinct non-redundant methodologies to help a trader identify institutional breakouts, overbought/oversold turning points, and the path of least resistance (the core trend).
1. Structural Levels (Breakouts & Retests): Automatically detects significant Swing Highs and Swing Lows using customizable pivot lookbacks. When price breaks these structural points with an impulse expansion (validated by a minimum candle body percentage), a temporary key level is generated. The script monitors this level for either a false breakout (invalidating the line) or a valid retest within a defined buffer zone.
2. Momentum Divergences (MFI & Stochastic): Utilizes the Money Flow Index (MFI) to measure volume-weighted price momentum. By comparing recent MFI peaks/troughs with actual price action across adaptive lookback periods, the script isolates hidden and regular divergences. To prevent premature entries, signals are filtered through a Stochastic Oscillator to ensure they occur strictly within overbought or oversold territories.
3. Dynamic Trend Filtering (EMA Ribbon): Implements a flexible Exponential Moving Average (EMA) matrix (defaulting to 9, 20, 50, 100, and 200 periods).
How the Components Work Together
The system is built on a "Filter, Trigger, Structure" synergy:
* The Filter (EMA): The 200 EMA and 50 EMA act as the ultimate trend filters. Traders should prioritize bullish structural breakouts when price is trading above these moving averages and bearish breakouts when below.
* The Structure (Banksters Levels): Defines the exact execution zones. An impulse break through a level shows market intent, while a subsequent retest provides an optimal risk-to-reward entry point.
* The Trigger (MFI Divergence): When a price retests a key structural level, an accompanying MFI bullish or bearish divergence serves as the ultimate exhaustion trigger, confirming that institutional order flow is defending the level.
Interface Customization
To ensure a clean charts workflow, the user interface features master toggles to completely enable or disable individual modules. All styling properties (colors, line widths, and plot shapes) have been offloaded to the native TradingView "Style" tab for seamless visual customization.
---
Описание на русском языке / Russian Description
Banksters Workspace — это комплексный инструмент, объединяющий три независимые торговые методики для определения институциональных уровней, импульсных пробоев и зон истощения тренда.
Indikator
Volume Profile Supertrend [HexaTrades]Volume Profile Supertrend re-imagines the classic Supertrend. Instead of trailing bands built from pure volatility (ATR), it builds them around the levels where real volume has traded the Point of Control and Value Area.
The philosophy is simple: a normal Supertrend follows volatility; this one follows where the market accepts value. Price tends to gravitate to, and trend away from, the zones where the most business gets done. By anchoring the trend engine to value migration, the indicator aims to stay on the right side of the move while filtering out a portion of low-quality volatility noise.
Everything is computed internally in Pine; no built-in Volume Profile tool is used, so it works on any symbol and timeframe that has volume.
💡How it works
1. Rolling Volume Profile:
It looks back over the last Profile Lookback bars, finds the high–low range, and divides it into Number of Rows price buckets. Every historical bar's volume is distributed across the buckets its range spans, producing a fresh volume distribution on every candle.
2. POC, VAH & VAL:
POC (Point of Control) : the price bucket with the highest traded volume (the "fairest price").
Value Area: the script expands outward from the POC until it captures the chosen Value Area % (default 70%) of total volume.
VAH / VAL: the upper and lower edges of that Value Area.
3. Smoothing & Supertrend bands:
POC, VAH, and VAL are smoothed with EMAs to remove jitter. Two trailing bands are then built, exactly like a Supertrend:
Lower band = smoothed VAL − (ATR × buffer) → support used while bullish.
Upper band = smoothed VAH + (ATR × buffer) → resistance used while bearish.
The bands only trail in the trend-following direction, so they lock in as the price advances.
4. Trend flip:
The trend is bullish while price holds above the lower band, and flips bearish when price closes below it (and vice-versa). The flip is evaluated against the previous bar's confirmed bands, so closed candles never change.
💡How to read it
🔶Bullish:A green line sits below the price. The market is accepting a higher value; treat pullbacks toward the line as the trend "breathing." A flip to red is your warning.
🔶Bearish: A red line sits above the price. Value is migrating lower; rallies into the line are where sellers tend to re-engage. A flip to green signals a potential turn.
🔶Choppy Markets: When price is inside the value area and trend strength is low, the market may be sideways.
In these conditions, signals can be weaker. It may be better to wait for a clear value breakout or stronger trend strength.
🔺Signals
- BUY label prints when the trend flips from bearish to bullish.
- SELL label prints when the trend flips from bullish to bearish.
- A flip dot marks the exact bar of the change on the trend line.
- Trend Strength Filter: Set Minimum Trend Strength above 0 to filter out weak trend flips and display only higher-conviction signals. (Available in the indicator settings.)
┼ Dashboard
-Trend: Current direction Bullish or Bearish.
-Strength: 0–100% conviction score blending distance from POC, POC slope, and whether price has broken outside the Value Area.
-Price Position: Above / Inside / Below Value Area.
-Last Signal: The most recent BUY or SELL that fired.
Alerts
The indicator includes alerts for important events:
-Buy Signal / Sell Signal
-Bullish Trend / Bearish Trend (flip)
-Price Above Value Area / Price Below Value Area
-Price Crossing POC EMA
Suggested Settings
For Intraday Trading
Use lower lookback and medium rows for faster signals.
Example:
-Profile Lookback: 50–100
-Rows: 30–50
-EMA Smoothing: 8–14
-ATR Buffer: 0.5–1.0
For Swing trading
Use higher lookback and smoother settings for cleaner signals.
Example:
-Profile Lookback: 100–250
-Rows: 40–70
-EMA Smoothing: 10–21
-ATR Buffer: 0.8–1.5
For Cleaner Signals
-Increase EMA Smoothing Length
-AIncrease TR Buffer
-Increase Minimum Trend Strength
Volume Profile Supertrend combines the proven structure of a Supertrend with the market's true area of value derived from a rolling Volume Profile. Instead of relying solely on price volatility, it follows the migration of value through the Point of Control (POC) and Value Area (VAH/VAL) to identify higher-quality trend changes.
Whether you're a day trader or swing trader, this indicator helps you visualize trend direction, identify dynamic support and resistance, filter weak reversals, and stay aligned with the prevailing market structure. Use it as a standalone trend-following tool or alongside your existing trading strategy for additional confirmation.
We would love to hear your suggestions. If you have ideas for new features, indicators, analytics, or improvements, please share your feedback. Your input helps guide future updates and improve the indicator for all traders.
This indicator is for educational and analytical purposes only. It is not financial advice. Trading involves risk. Always use proper risk management and combine this indicator with your own analysis before taking any trade.
Indikator

Indikator
Indikator

Indikator

Indikator

Indikator

DaXtreme SPY Command Center**DaXtreme SPY Command Center** is a rule-based trading system designed specifically for SPY options trading. Rather than predicting market direction, it waits for multiple independent confirmations before generating a trade signal. The strategy is built around a 9:30–9:45 AM Opening Range Breakout (ORB), using the ORB High and ORB Low as the session's primary decision levels. Once the opening range is established, the script evaluates trend, momentum, participation, and market structure before issuing a BUY CALL or BUY PUT signal.
The system combines VWAP, the 9 EMA, and the 21 EMA to identify trend direction. Price must remain on the correct side of VWAP while the 9 EMA aligns with the 21 EMA and continues sloping in the direction of the trade. It also uses both a 5-minute RSI for overall market bias and an Entry RSI for immediate momentum confirmation. A Cumulative Volume Delta (CVD) proxy measures buying and selling pressure to help confirm institutional participation.
To reduce low-quality trades, the script includes several guardrails. An Extended Move Filter prevents entries after price has already moved too far from the 9 EMA, reducing the likelihood of chasing exhausted moves. A VWAP Chop Filter suppresses signals during sideways conditions where price repeatedly crosses VWAP without establishing direction. A Pullback Rejection Filter requires price to break the ORB, retest the level, and reject back in the direction of the trend before a signal is allowed, improving entry quality over simple breakout strategies.
Each potential trade receives a Signal Score from 0 to 10 based on ten independent confirmations, including VWAP position, EMA alignment, EMA trend, ORB retest, pullback rejection, RSI strength, CVD direction, and extension status. This score is converted into a trade grade ranging from A+ to C, allowing only high-quality setups to generate alerts. A configurable minimum score lets the trader control how selective the system should be.
The integrated Command Center dashboard provides a real-time overview of the current market environment. It displays the active Signal Score, star rating, trade grade, trade status, ORB High and Low, VWAP bias, 9 EMA trend, 5-minute RSI, Entry RSI, CVD direction, confidence percentage, market state, contract mode, and ORB status. Market conditions are classified as Trend, Range, Chop, or Squeeze to help the trader adapt expectations throughout the session.
Trade status progresses through a structured workflow of WAIT, CALL READY, BUY CALL, MANAGE CALL, PUT READY, BUY PUT, MANAGE PUT, and EXIT, giving clear guidance throughout the life of each trade. Exit warnings are generated whenever price loses the 9 EMA or VWAP for long positions, or reclaims those levels during short positions, signaling that the original trade thesis may be weakening.
The Command Center is optimized for SPY on the 5-minute timeframe and is intended for both 0DTE and 1DTE option contracts. It is designed to reduce emotional decision-making by requiring multiple layers of confirmation before entry and by providing objective guidance for trade management and exits. The overall philosophy is simple: trade only when structure, trend, momentum, and participation all agree, allowing quality to take precedence over quantity.
Indikator

Swing Momentum Pullback Strategy + ChecklistSwing Momentum Pullback Strategy + Checklist
This indicator is a complete swing trading system designed to help traders identify
trend breakouts and low-risk momentum pullbacks, optimized for the Daily Timeframe.
The script combines a long-term trend filter, automated resistance detection, and
specific entry triggers into a single chart overlay, along with a real-time Strategy
Checklist Dashboard that confirms setups at a glance.
─────────────────────────────────
🎯 CORE COMPONENTS
─────────────────────────────────
▸ Trend Filter (Purple Line)
200-period Simple Moving Average (SMA). Acts as the long-term trend filter.
Long setups are only considered when price is above this line.
▸ Momentum Guide (Orange Line)
8-period Exponential Moving Average (EMA). Tracks short-term momentum.
In strong trends, price tends to "ride" this line. Entries are sought when
price pulls back to test this area.
▸ Multi-Month Resistance Line (Orange Horizontal)
Automatically plots the highest price over a user-defined lookback period (in months).
Instantly visualizes the key resistance level a stock must break out above.
▸ Strategy Checklist Dashboard
A real-time table that evaluates Trend, Resistance, and Momentum conditions to
display a clear ✅ ENTER, 🚀 GAP UP, or ⏳ WAIT signal.
─────────────────────────────────
🛠 HOW IT WORKS — TWO SETUPS
─────────────────────────────────
1. The Daily Gap Up ("GAP" Label)
Fires when a stock gaps up with strong overnight momentum.
• Open is at least X% above the prior day's Close (adjustable, default 3%)
• Open is above the prior day's High
• Price must be above the 200 SMA
→ Marked with a green "GAP" label on the chart
2. The Trend Pullback ("ENTER" Signal)
A trend-following entry to join an existing move at lower risk.
• Stock is in an uptrend (above 200 SMA)
• Price dips down to touch or test the 8 EMA
• Candle shows a pullback (red candle or lower close) — confirms we're buying
a dip, not chasing a top
→ Dashboard "Action Signal" turns orange and displays ✅ ENTER
─────────────────────────────────
📋 CHECKLIST DASHBOARD — READINGS
─────────────────────────────────
Trend (> 200 SMA):
🟢 Bullish — Price is in an uptrend. Safe to look for entries.
🔴 Bearish — Price is below the 200 SMA. Stay out.
Above Resistance?:
🟢 Breakout — Price has cleared the multi-month resistance line.
⚪ --- — Price is currently below the key breakout level.
Near 8 EMA?:
🟢 Yes — Price is near the value zone for a potential pullback entry.
Action Signal:
🚀 GAP UP — Strong momentum gap detected.
✅ ENTER — Valid pullback entry confirmed.
⏳ WAIT — No qualifying setup on the current bar.
─────────────────────────────────
⚙️ SETTINGS
─────────────────────────────────
- Momentum EMA Length — Default: 8. Controls pullback line sensitivity.
- Trend SMA Length — Default: 200. Long-term trend filter period.
- Gap Up % Threshold — Default: 3.0%. Minimum overnight gap to trigger signal.
- Resistance Lookback (Mo.) — Default: 3. Months used to find the key resistance level.
- Table Position — Move the checklist dashboard to any corner of your chart.
─────────────────────────────────
⚠️ DISCLAIMER
─────────────────────────────────
For educational purposes only. Not financial advice.
Always manage your risk and use a stop loss. Indikator

Indikator

Indikator

Adaptive Support & Resistance Pro with EMA Momentum Filter## Description
This indicator is an advanced tool designed to identify adaptive Support and Resistance (S/R) zones and combine them with an Exponential Moving Average (EMA) momentum filter. Unlike static S/R lines, this script uses a combination of momentum oscillators and dynamic pivot calculations to find high-probability reversal zones on higher or current timeframes.
The core philosophy of this indicator is to prevent "knife-catching." Instead of firing a signal immediately when a support or resistance level is formed, it waits for the price to confirm a change in momentum by crossing the EMA line in the direction of the trade.
---
## How It Works (Under the Hood)
### 1. Support & Resistance Detection
The script uses a multi-layered filter to detect true pivot points:
* **Legacy RSI & Modified RSI:** It evaluates overbought (>75) and oversold (<25) conditions using a 9-period Relative Strength Index.
* **Chande Momentum Oscillator (CMO) based on HMA:** It applies a 1-period CMO logic over Hull Moving Averages (HMA 5 and HMA 12) to detect immediate shifts in market velocity.
* **Close Pivots:** It uses deviation-free highest/lowest calculations (`ta.highest` and `ta.lowest`) combined with `ta.valuewhen` to fetch precise structural levels.
A **Support Zone** is formed only when the RSI is oversold, the CMO shows an upward momentum shift (>50), and a local low pivot is confirmed.
A **Resistance Zone** is formed when the RSI is overbought, the CMO shows a downward shift (<-50), and a local high pivot is confirmed.
### 2. S/R Timeframe Flexibility
Through the `request.security` function, users can plot these adaptive levels from higher timeframes (HTF) onto their current chart. To prevent **repainting** and back-shifting signals, the script strictly uses `barmerge.lookahead_off`.
### 3. EMA Momentum Trigger (The Confirmation Filter)
To filter out false breakouts and premature entries during heavy trend extensions, an EMA filter is introduced:
* **BUY Signal:** Triggered only when a new Support level has been established AND the price successfully closes above the EMA (`ta.crossover`).
* **SELL Signal:** Triggered only when a new Resistance level has been established AND the price successfully closes below the EMA (`ta.crossunder`).
**Strict Discipline:** The script uses an internal state machine (`waitForBuyBreak` / `waitForSellBreak`) ensuring that **only ONE signal** is fired per newly created S/R level. This completely eliminates the "whipsaw" effect (multiple false signals) when the price is consolidating or chopping around the moving average.
---
## Settings & Customization
* **Line Width / Colors:** Fully customize the visual thickness and color styling of your Support and Resistance zones.
* **S/R Timeframe:** Leave it blank for the current chart timeframe, or select higher timeframes (e.g., 4H or 1D) for macro level analysis.
* **Enable EMA Filter:** Toggle this option ON to use the momentum confirmation logic, or OFF to see signals immediately upon S/R level creation.
* **EMA Length:** Adjust the period of the confirmation line (Default is 50, but can be set to 20 for faster entries or 200 for macro trend-following).
---
## Alerts
The script includes three built-in alert conditions for automation:
1. `New S/R line` - Triggers whenever a new support or resistance level is plotted.
2. `BUY Signal` - Triggers when the EMA crossover confirms the support bounce.
3. `SELL Signal` - Triggers when the EMA crossunder confirms the resistance rejection.
## Disclaimer
This indicator is meant for educational and analytical purposes only. Past performance does not guarantee future results. Always practice proper risk management. Indikator

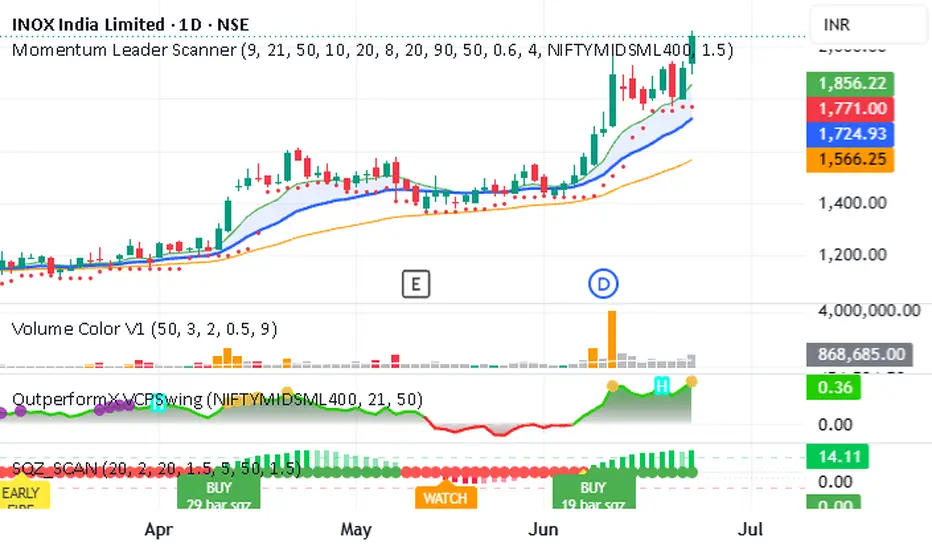
SQZ SCAN & EMA Ride Scanner - AshishShort Description
A dual-mode EMA9/21/50 trend-ride scanner with volume classification and a relative-strength "Grinder Mode" for stocks that trend without ever coiling tight enough to trigger a squeeze. Use alongside its companion, SQZ_SCAN, for momentum timing.
What it does
EMA Ride Scanner V2.a finds stocks in a clean, established uptrend and flags healthy pullback zones to buy — instead of chasing breakouts after the move has happened. Built on ideas from Qullamaggie's Episodic Pivot framework, Stockbee's price-neglect filter, and VCPSwing's 10/20-MA ride philosophy. It checks: EMA9>21>50 stack alignment, minimum ride duration, distance from 52-week low, and volatility contraction. Volume bars are color-coded as EP surges, distribution, or healthy dips.
Two modes (single toggle)
Standard Mode (toggle OFF) — for stocks that coil and release. Flags a 0-5% pullback to EMA9, ideally on light volume. Pair with SQZ_SCAN for the breakout-timing signal.
Grinder Mode (toggle ON) — for stocks that never coil. Some strong trends have such low, steady volatility that they never compress enough to trigger a squeeze — by the time SQZ_SCAN fires, they've already run too far from EMA9 to count as a dip. Grinder Mode drops the squeeze requirement and instead checks: low ATR, long ride above EMA21, and meaningful outperformance vs a benchmark index (momentum begets momentum). If price is also near EMA9/21, it flags a Grinder Setup.
Note: cloud-bounce count is shown for visual reference only, not used as a filter — low-ATR stocks often show very few bounces simply because they ride EMA9 continuously rather than dipping and recovering.
Companion: SQZ_SCAN
SQZ_SCAN (LazyBear Squeeze Momentum, normalized to % of price for cross-stock comparison) shows when volatility compression releases into a confirmed move — WATCH (squeeze building, qualifying bar count reached), EARLY FIRE (momentum just turned positive inside the squeeze), or BUY (squeeze fired + momentum green & rising + volume surge confirmed).
Workflow:
Screen with EMA Ride Scanner (Standard Mode) for clean pullback candidates.
Check SQZ_SCAN on each — prioritize WATCH/EARLY FIRE/BUY.
Separately, screen Grinder Mode for low-volatility names — don't require SQZ confirmation here, it structurally won't fire for this archetype.
Sanity-check on hourly before entry — only to rule out an active breakdown, not as a hard gate. Both indicators are daily-timeframe tools; hourly readings are noisy and shouldn't override a valid daily setup.
What this isn't
A screening tool, not a full trading system — no buy/sell signals, no risk management built in. Combine with your own entry timing, sizing, and stops. Indikator

EMA Ride Scanner V2.a (Toggle) - AshishShort Description
A dual-mode EMA9/21/50 trend-ride scanner with volume classification and a relative-strength "Grinder Mode" for stocks that trend without ever coiling tight enough to trigger a squeeze. Use alongside its companion, SQZ_SCAN, for momentum timing.
What it does
EMA Ride Scanner V2.a finds stocks in a clean, established uptrend and flags healthy pullback zones to buy — instead of chasing breakouts after the move has happened. Built on ideas from Qullamaggie's Episodic Pivot framework, Stockbee's price-neglect filter, and VCPSwing's 10/20-MA ride philosophy.
It checks: EMA9>21>50 stack alignment, minimum ride duration, distance from 52-week low, and volatility contraction. Volume bars are color-coded as EP surges, distribution, or healthy dips.
Two modes (single toggle)
Standard Mode (toggle OFF) — for stocks that coil and release. Flags a 0-5% pullback to EMA9, ideally on light volume. Pair with SQZ_SCAN for the breakout-timing signal.
Grinder Mode (toggle ON) — for stocks that never coil. Some strong trends have such low, steady volatility that they never compress enough to trigger a squeeze — by the time SQZ_SCAN fires, they've already run too far from EMA9 to count as a dip. Grinder Mode drops the squeeze requirement and instead checks: low ATR, long ride above EMA21, and meaningful outperformance vs a benchmark index (momentum begets momentum). If price is also near EMA9/21, it flags a Grinder Setup.
Note: cloud-bounce count is shown for visual reference only, not used as a filter — low-ATR stocks often show very few bounces simply because they ride EMA9 continuously rather than dipping and recovering.
Companion: SQZ_SCAN
SQZ_SCAN shows when volatility compression releases into a confirmed move — WATCH (squeeze building), EARLY FIRE (just released), or BUY (released + volume confirmed). NOTE: As with most indicators, this is a lagging indicator on a daily timeframe, and accuracy reduces significantly on lower timeframes.
Workflow:
Screen with EMA Ride Scanner (Standard Mode) for clean pullback candidates.
Check SQZ_SCAN on each — prioritize WATCH/EARLY FIRE/BUY.
Separately, screen Grinder Mode for low-volatility names — don't require SQZ confirmation here, it structurally won't fire for this archetype.
Sanity-check on hourly before entry — only to rule out an active breakdown, not as a hard gate. Both indicators are daily-timeframe tools; hourly readings are noisy and shouldn't override a valid daily setup.
What this isn't
A screening tool, not a full trading system — no buy/sell signals, no risk management built in. Combine with your own entry timing, sizing, and stops. Indikator

Day Trade Trend Watchlist# 10-Stock Premarket Breakout + EMA/VWAP Day Trade Trend Watchlist
Before you start:
Extended Hours must be turned on.
Mark your Pre Market Levels or find a Indicator does that for you.
## Overview
This indicator turns any chart into a live screening dashboard for up to 10 stocks at once. It tracks each ticker's premarket high and low, flags the moment price breaks out of that range, and reads trend from EMA alignment — all from one customizable table, without needing to open 10 separate charts. A VWAP and 8/21/200 EMA are also plotted directly on your chart for the symbol you're currently viewing.
## What it does
- **Premarket High/Low (PMH/PML) tracking** — automatically calculates each ticker's premarket range (default 4:00–9:30 AM ET, adjustable session and timezone) and resets it fresh every trading day. Pulls real extended-hours data regardless of your own chart's display settings.
- **Breakout detection** — once premarket ends, the script flags the moment price crosses above the premarket high or below the premarket low, both in the table and with an on-chart arrow label naming the ticker.
- **Trend column (8/21/200 EMA stack)** — each ticker's trend is read from EMA alignment: price stacked above all three EMAs shows UP, the reverse shows DOWN, anything in between shows MIXED.
- **Daily inside/outside bar column** — classifies whether each ticker's current daily candle is still contained inside yesterday's range, or has broken outside it (up, down, or both).
- **On-chart EMA + VWAP** — the 8, 21, and 200 EMA plus a session VWAP are plotted directly on whatever symbol/timeframe your chart is showing, for standard visual trend and fair-value context.
- **Customizable dashboard** — choose exactly which columns appear (Last Price, PM High/Low, Breakout Status, Trend, Daily Bar), set text size, table position, and recolor every part of the table to match your own chart theme. Default view is a clean, minimal Ticker + Last price layout.
- **Built-in alerts** — get notified the moment any of your 10 tickers breaks its premarket high or low, with an option to only fire once per level per day.
## How to use it
1. Add the indicator to any chart — the chart's own symbol doesn't need to match your watchlist.
2. Open Settings → "Watchlist" group → enter up to 10 tickers. Leave any slot blank to skip it.
3. Adjust the premarket session window and timezone if you trade a market other than US equities.
4. Use the "Columns to Show" group to pick exactly what information you want visible.
5. Right-click the chart → Add Alert → select this indicator to receive breakout notifications.
## Notes
- Premarket tracking, EMAs, and trend classification all run on the 10-minute timeframe internally for consistency across all 10 tickers, regardless of your chart's own timeframe.
- This is a discretionary screening tool, not a standalone signal generator — use it alongside your own market structure, volume, and risk management approach.
- If a ticker shows "n/a," double check the symbol is entered correctly or that premarket data is available for that instrument.
Indikator

Indikator

Multi-EMA Future Trajectory Projector [20/50/100/200]Multi-EMA Future Trajectory Projector DescriptionThe Multi-EMA Future Trajectory Projector solves a fundamental limitation of traditional moving averages: lag. Because Exponential Moving Averages (EMAs) are backward-looking mathematical averages, traders are often left guessing how long or how far a price must move before a trend crossover occurs.
This script eliminates the guesswork by calculating the exact mathematical decay of the 20, 50, 100, and 200 EMAs into the unprinted, blank future space of your chart. Rather than predicting where the market will go, this tool acts as a "What-If" simulator , plotting the precise trajectory curves the EMAs will take based on your own expected price targets.
Unlike standard indicators, this script gives you complete visual control over the lookahead vectors directly inside the Inputs tab, allowing you to custom-style your future projection lines.
How it Works (The Math)
An EMA weighs the most recent price closing data heavier using a fixed smoothing multiplier: Multiplier = 2 / (Length + 1)
Because future price bars do not exist yet, this indicator runs a recursive loop algorithm starting from the real-time live price bar. It uses a chain-link calculation where every forward step is derived from the previous step’s projected EMA value using your selected price source as the fixed focal target.
Core Features & Settings
Custom Lookahead Depth: Adjust the Number of Extensions to project anywhere from 1 to 500 bars into the future blank space. Simulate Multiple Scenarios: Change the Price Source input to simulate different environments. For example, setting it to Close calculates the path if the price completely flatlines.
Complete Input Styling: TradingView natively restricts code-generated future lines from appearing in the "Style" tab. This script bypasses that limitation by moving all color, thickness, and line style (Solid, Dashed, Dotted) settings directly into the Inputs panel for individual EMAs.
How to Use This in Your Trading
1. Anticipating Trend Crossovers (EMA Crosses)Instead of waiting hours or days for a 20/50 EMA cross to print historically, look at the projected slopes. If the 20 EMA trajectory curve is bending aggressively toward the 50 EMA, you can visually measure exactly how many bars are required at the current price level for a crossover to trigger.
2. Identifying Extensions & Mean Reversion Shorter moving averages (like the 20 EMA) react rapidly to spot prices and curve sharply, while longer ones (like the 200 EMA) plot flat trajectories. Use the gap between the short-term and long-term future lines to judge if an asset is overextended and likely to experience a mean-reversion pullback.
3. Support & Resistance Confluence Projected curves map out where key historical moving averages will form dynamic support or resistance on upcoming bars. Use the future line coordinates to plan precise, front-run take-profit limits or stop-loss placements.
Indikator

Indikator

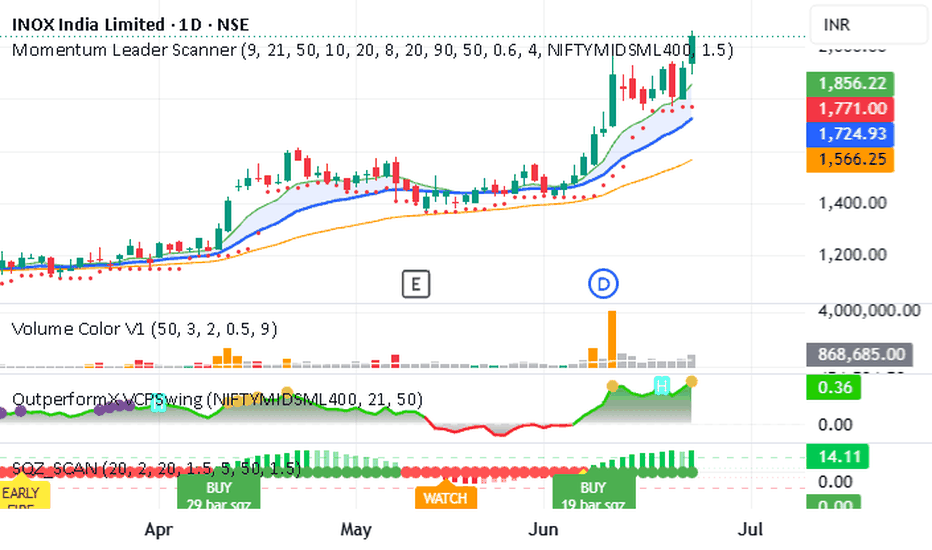
Momentum Leader Scanner - AshishMomentum Leader Scanner — a systematic tool for catching high-conviction momentum stocks after their initial breakout (EP candle), while they consolidate quietly in the EMA9/21 cloud before the next leg up. Combines relative strength vs. benchmark, proximity to 52-week highs, and a low-volume pullback filter to surface coiled setups — then locks a precise breakout trigger price the moment a setup is confirmed, so you can place your entry order in advance instead of reacting after the move has already started.
How it works
The script anchors its analysis to the most recent qualifying EP candle (a single-day move of 8%+ by default) and measures the stock's outperformance against a benchmark (default: NIFTYMIDSML400) since that candle — not over an arbitrary fixed window. This avoids one EP candle alone inflating a "strength" reading; the outperformance has to be sustained after the move, not just caused by it.
A setup requires four conditions together:
Outperformance vs benchmark since the EP candle exceeds a minimum threshold (default 10%)
Proximity to 52-week high (default within 20%) — confirming the stock hasn't lost its leadership
A qualifying EP candle within the detection window
A healthy pullback — price sitting inside the EMA9/EMA21 cloud (with a small tolerance for wick excursions) while the EMA9 > EMA21 > EMA50 stack stays intact, on below-average volume
When all four align, the script locks a breakout trigger price — the highest high since the EP candle — letting you pre-place a GTT order rather than waiting for a confirmed close above resistance, which is often a day or more late.
What it's good for
Catching stocks in the "coil after the jump" phase: violent move, quiet digestion, then continuation. It explicitly tracks how many separate EP candles have fired (visible as a diagnostic) so you can judge whether a stock had one clean catalyst or has been repeatedly volatile.
What it isn't built for
Slow, low-volatility grinders that never have a sharp EP candle (a different system altogether), and stocks that move too fast and too cleanly to ever pull back into the cloud on a daily timeframe.
Status
Actively used and refined against live market data — published as-is for traders who understand swing/momentum trading and want to incorporate systematic outperformance and pullback logic into their own process. Not financial advice; verify every signal against your own risk management before acting on it. Indikator