TRADLEWARE-DCA+Trend ETF
DCA + Trend: Monthly Contributions with a Bear-Market Exit and Dip-Ladder Re-entry
This strategy treats "putting money in every month" and "managing the pile of money already invested" as two separate jobs. A fixed monthly contribution never stops, even in a bear market — but the accumulated stack gets pulled out entirely when the long-term trend breaks, and put back to work gradually as the market recovers rather than all at once.
The target here is beating plain monthly dollar-cost averaging, not simple buy-and-hold. On broad-market ETFs, which tend to trend upward over long horizons, DCA already captures much of the benefit of buying dips just by staying systematic — a real bar to clear, not a strawman. It's also the one this strategy has consistently cleared across every asset tested so far (see Known limitations for where it falls short of buy-and-hold's raw return instead).
How it works
Every calendar month, a fixed dollar amount is invested, regardless of what the trend is doing — this means fixed dollars buy more shares exactly when the market is cheap, which is the whole point of dollar-cost averaging. Separately, a 200-day SMA acts as a trend filter for the accumulated position: when price closes below it, the entire stack built up so far is sold. When the trend recovers, that money doesn't necessarily go back in all at once — instead it can be split into tranches that buy in stages as price falls further below its prior peak during the bear market, so more of the recovery budget lands at genuinely lower prices instead of guessing the exact bottom.
Entry
Three separate mechanisms add to the position:
Monthly DCA: on the first bar of every calendar month, a fixed dollar amount is invested — by default, this keeps happening even during a bear market (can be turned off to pause contributions below the trend line instead)
Dip-ladder tranches: after a bear-market exit, the re-entry budget is split equally across up to three pieces, regardless of how deep each one triggers — each buys when price falls a further fixed percentage below the running all-time high (15%, 20%, and 30% below, by default) — this uses the all-time high as the reference level specifically because, unlike the moving average, it does not sink during the bear market
Lump sum recovery: any part of the re-entry budget that wasn't already spent by the dip-ladder tranches is deployed in one shot on the first bar the trend recovers
Exit
The entire accumulated position (not the monthly contributions still to come) is sold in full the moment price closes below the 200-day SMA — a trend-broken event, not something that unwinds gradually. An optional "death cross" confirmation (50-day SMA also below the 200-day SMA) can be required before treating a dip as a genuine bear market, which reduces false exits during brief pullbacks.
Parameters
SMA period: 200 days (the trend filter for the exit)
SMA hysteresis band: a dead zone around the SMA, on by default. The regime only flips bullish above SMA×(1+band) or bearish below SMA×(1-band); price sitting between those two lines just holds whatever state it was already in. This filters out marginal SMA crossings that would otherwise trigger an exit and re-entry over a move that never became a real trend break — most such round trips re-buy at close to the same price they sold at, paying costs without capturing anything. Set to 0 to require only a plain SMA cross.
Monthly DCA amount: fixed dollar amount invested on the first bar of each month
Lump re-entry percentage: how much of the value that was sold at the exit gets redeployed on recovery (0 = skip lump entirely and resume monthly DCA only; higher = more of the recovery captured, at the cost of more drawdown if the recovery turns out to be a false one)
Death cross confirmation: off by default; when enabled, requires the 50-day SMA below the 200-day SMA before treating the market as unsafe
DCA during bear regime: on by default; contributions keep buying through the bear market instead of pausing
Dip-ladder toggle and three rung levels (percentage below the running high): default 15%, 20%, 30% below; any rung can be set to 0 to disable it
Whole-share DCA: off by default. A fractional monthly quantity (contribution amount smaller than one share) rounds down to zero on most equity brokers and never fills or fires an alert. Turning this on banks any unspent contribution and carries it to the next month, firing a whole-share order once enough has accumulated
Label offset: how far the buy/sell trade labels sit from the bar, in multiples of ATR(14)
Chart labels
Every fill is marked directly on the chart: a green label below the bar for each buy (tagging which mechanism fired — DCA, LUMP, or RUNG 1/2/3, combined if more than one lands on the same bar) and a red label above the bar for each exit (CRASH EXIT or PERIOD END), showing the blended profit/loss across everything that closed on that bar. Since one crash exit can unwind dozens of separate monthly contributions and dip-ladder buys at once, the P&L shown is the combined result of all of them, not just one trade. Both label types also show the cash left in the account after that fill — useful for keeping an eye on how close the pool is to running dry, since TradingView blocks an order it can't cover and DCA/lump/rung buys stall until the next sale refills it.
Costs modelled
0% commission (typical for US equity brokers), 1 tick slippage, fills at next bar's open.
Intended assets and timeframe
Daily bars, US equity ETFs. Built and tested on MGK specifically, using the settings published as its defaults (death-cross confirmation off, rungs at 15/20/30% below the running high) — that combination is the only one checked end-to-end against a live TradingView run. Seven other broad-market, growth, value, equal-weight, and momentum funds — QQQ, VOO, IVW, IVE, RSP, SPYM, and SPMO — were also tested, each with its own settings rather than MGK's defaults left unchanged, and are very likely to beat plain monthly DCA too: that pattern held without exception on every asset checked so far. Their validated combination is different from what's published here — death-cross confirmation on and wider rungs at 20/30/40% — which is the better starting point if you switch tickers, with QQQ as the one exception even to that (see Known limitations): it pairs better with death-cross confirmation off and the hysteresis band set to 2% instead. Parameter choices matter more than they might look — death-cross on/off, the lump percentage, and the rung spacing have each swung the outcome by a wide margin in testing — so tuning for whichever asset and regime you're actually using, rather than leaving the MGK-tuned defaults unchanged, is worth the effort.
Known limitations
The exit reacts at the next bar's open after the trend breaks, so it lags fast crashes rather than anticipating them. In a slow, grinding bear market, the dip ladder's fixed rungs can all fire and the market can keep falling anyway, leaving a larger paper loss than the version without a ladder — the extra return the ladder aims to capture on recovery is paid for with real, and sometimes severe, worst-case pain during a prolonged decline. Size the lump and rung percentages to a drawdown you could actually hold through, not just a comfortable one. Bear-market DCA contributions can sit on paper losses for a long time before a recovery arrives. Switching to one of the other seven validated funds calls for different settings than the published MGK defaults — see Intended assets and timeframe above. QQQ specifically pairs better with the death-cross confirmation off and the hysteresis band at 2% rather than either of the other two combinations. For VOO, turning death-cross confirmation on is a genuine trade-off rather than a clear-cut fix: it gives a smaller drawdown and better Calmar ratio at the cost of slightly lower return and Sharpe. TradingView's own chart price does not include dividends, so a live TradingView backtest will differ somewhat from a dividend-adjusted one, though trade dates should still match. Over the published defaults' validated window, trade count sits below the sample size usually wanted for stable statistics — treat this as a directional result to build on, not a confirmed edge, until it's been checked over a longer window or across more of the validated assets.
If you already hold a lump-sum position and plan to add ongoing contributions on top of it, don't feed the lump into this strategy's own trading — a crash exit sells everything it holds at once, lump included, and testing found that dragged results down noticeably compared to keeping an existing lump in a separate buy-and-hold position and only running new contributions through this strategy. Even limited to just the ongoing contributions, though, this strategy's trading is not guaranteed to beat simply holding those same contributions — in the scenarios tested so far, plain buy-and-hold of the contributions matched or outperformed running them through the strategy's exit/re-entry logic. Treat this as a tool for managing how an existing trend-following thesis gets traded, not as a proven improvement over doing nothing.
Strategie

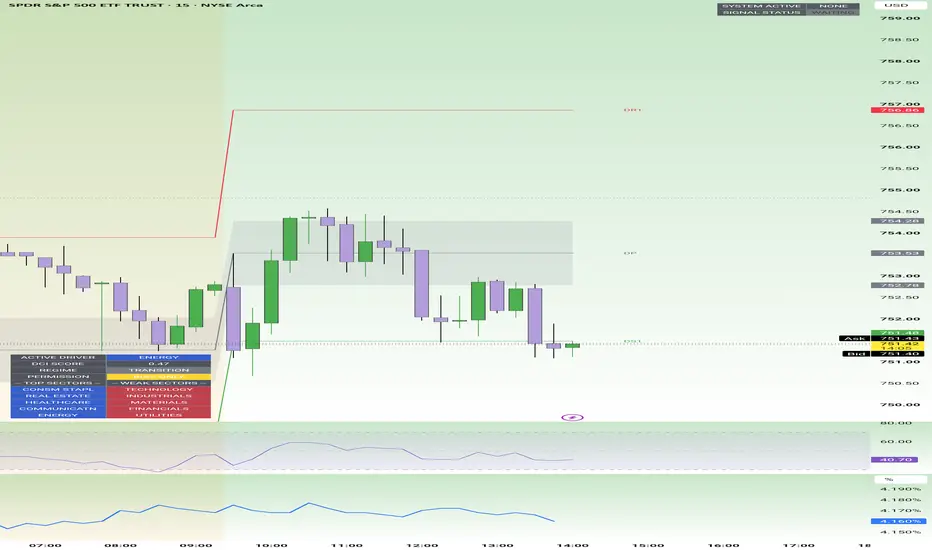
ES/SPY Conversion Ratio (by Yulien)The CME_MINI:ES1! ES/ AMEX:SPY SPY Conversion Ratio compares E-mini S&P 500 futures (ES) with the SPDR S&P 500 ETF (SPY). It establishes a daily reference ratio from the confirmed close of the first regular-session minute (9:30-9:31 AM, America/New_York), avoiding reliance on the noisier opening-auction print.
It also calculates a live ratio on every update, displays the percentage drift from the first-minute reference, and converts a user-selected SPY price level into its corresponding ES price rounded to the configured ES tick size.
The indicator includes a configurable on-chart table, an interactive SPY reference level, and a customizable horizontal marker. It does not generate trading alerts or directional signals. This tool is intended for relative price conversion and execution reference only.
IMPORTANT DATA REQUIREMENT
Accurate operation requires real-time market data for both CME ES futures and SPY. Delayed, unavailable, or differently timestamped feeds can produce stale prices, an unavailable first-minute reference, or an inaccurate live ratio. Indikator

Strong ETF Screener | ProjectSyndicateStrong ETF Screener turns dozens of charts into a single institutional-style dashboard, ranking a curated universe of the 40 largest US-listed ETFs by performance across six timeframes and scoring each one on professional-grade risk metrics — Beta, Sharpe, Sortino, Omega, Z-Score, and Kelly — so you can find the market's leaders and weigh their risk-adjusted quality at a glance, all on one clean, sortable panel. Every figure is computed live on the daily timeframe from real price history, not hard-coded, so the board reflects the market as it actually is right now.
📊 Curated Top-40-by-AUM Universe — the screener watches the 40 biggest US-listed ETFs by assets under management in one place: broad-market and S&P 500 cores (VOO, SPY, IVV, VTI), growth and tech (QQQ, VUG, VGT, XLK, SMH), international and emerging markets (VEA, IEFA, VXUS, VWO, IEMG), bonds (BND, AGG, TLT, BNDX, VCIT), factor and income (SCHD, VYM, VIG, QUAL, JEPI, RSP), and alternatives like gold (GLD) and spot Bitcoin (IBIT). Instead of flipping through forty charts, you see every fund's performance and risk profile side by side and immediately spot which sleeve of the market is leading and which is rolling over.
🗓️ Six-Timeframe Performance — each ETF is tracked across Week, Month, Quarter, 6-Month, 12-Month, and Year-to-Date returns, so you can separate a one-week move from a genuine long-run trend and see momentum building or fading across horizons in a single row.
🧮 Institutional Risk Metrics, Done Properly — beyond raw returns, every fund is scored on Sharpe (excess return per unit of total volatility), Sortino (return per unit of downside risk only), Omega (probability-weighted gains versus losses above the risk-free threshold), Z-Score (how stretched the recent move is in standard deviations), and the Kelly fraction (a theoretical optimal-sizing read from return and variance). The stats are annualized from daily returns over a rolling one-year window with a configurable risk-free rate, so the risk picture is consistent and comparable across the whole list — letting you line a high-flying tech fund up against a steady bond ETF on the same footing.
🎯 Basket-Relative Beta — Beta is measured against an equal-weight basket of the 40 ETFs in the screener, so it tells you how a fund moves relative to this specific top-40 cohort rather than a single broad index. Beta above 1 swings harder than the group; below 1 is steadier — an instant read on which names amplify the market and which cushion it. You control the lookback length used for the beta and correlation calculation.
🌡️ Annualized Weekly Volatility — a dedicated Wk Vol column annualizes the standard deviation of recent weekly returns, giving you a fast read on how violent each fund's price action is before you size into it — so a leveraged-feeling growth or crypto ETF never gets mistaken for a sleepy aggregate-bond fund.
🔀 Dynamic Sorting — sort the entire board by any of the six performance columns, or by static AUM rank, with a single setting. Rank by YTD to find the year's leaders, by Week to catch what is moving on fresh flows, or by any horizon in between — the table re-ranks instantly.
🎨 Bloomberg-Amber Theme with Color-Coded Strength — a clean amber-on-black dashboard with a multi-level gradient that runs from bright amber on the strongest gains through to deep red on the steepest losses, so strength and weakness jump out the moment you look at the panel.
🧩 Fully Customizable Dashboard — place the table anywhere on the chart (Top / Middle / Bottom paired with Left / Center / Right), choose your text size (Tiny / Small / Normal / Large), set the sort column, the beta length, and the risk-free rate and periods — all from the settings menu, no code editing required. The 40-ticker list is a single, clearly labeled block in the source, so refreshing the universe as AUM rankings shift is a quick edit.
🔒 Daily-Timeframe Lock — the screener is built for daily data and will prompt you to switch if you load it on a lower timeframe, so the returns, volatility, and ratios are always calculated on the basis they are designed for.
⚡ Lightweight and Efficient — the whole 40-name board is built from a tight, well-organized script that runs smoothly on TradingView, with a clean merged title heading and an alternating-row layout for easy reading. Delisted or halted tickers degrade gracefully to blank rows rather than breaking the panel.
🎯 Why this is different — most watchlists show you price and maybe a percentage move. This screener puts performance and a full institutional risk stack — Sharpe, Sortino, Omega, Z-Score, Kelly, Beta, and annualized volatility — for the forty largest ETFs on one sortable, color-coded panel, so you are ranking opportunities by risk-adjusted quality, not just chasing the biggest green number.
🚀 Where to use it — apply it to any daily chart to monitor the ETF leadership landscape as a whole. Use it for top-down asset-allocation and rotation ideas, cross-sleeve comparison (equity vs bond vs commodity vs crypto), and risk screening before you drill into an individual fund's chart for entry timing.
⚠️ Important — this is a research and decision-support dashboard, not a buy/sell system, and it makes no performance guarantees. The 40-name universe is a snapshot of the current largest ETFs by AUM and will drift over time; the board re-ranks live, but membership is fixed until you update the ticker list. All figures are historical and descriptive, computed from past price data, and say nothing certain about the future. Risk metrics like Sharpe, Sortino, Omega, Z-Score, and Kelly are simplified, assumption-based estimates and should inform your judgment, not replace it. Always pair the screener with your own analysis and risk management. Indikator

Income ETF vs Benchmark ComparatorCompare the performance of income/covered call ETFs (JEPI, JEPQ, QYLD, QQQI, XYLD, SPYI) against their benchmark ETFs (SPY, QQQ) to determine if income strategies outperform buy-and-hold.
Features:
Total Returns: Year-by-year and period total returns (price appreciation + dividends, non-reinvested)
Dividend Yields: Annual dividend percentages for both income and benchmark ETFs
NAV Decay: Measures underperformance of income ETF vs benchmark
Dividend Extraction Analysis: Shows hypothetical benchmark returns if you extracted the same dividends by selling shares
Sharpe Ratios: Risk-adjusted returns for performance comparison
Predefined Pairs: Quick selection of common comparisons or custom symbol input
Customizable Display: Adjustable table position and font size
How to Use:
Select a comparison pair (e.g., "JEPI vs SPY") or choose "Custom" to compare any two symbols
Also put the ticker in analysis in the chart and 1D time frame
Review yearly performance, dividends, and risk metrics in the table
Ideal for investors evaluating whether income ETF strategies justify their NAV decay compared to traditional index investing. Indikator

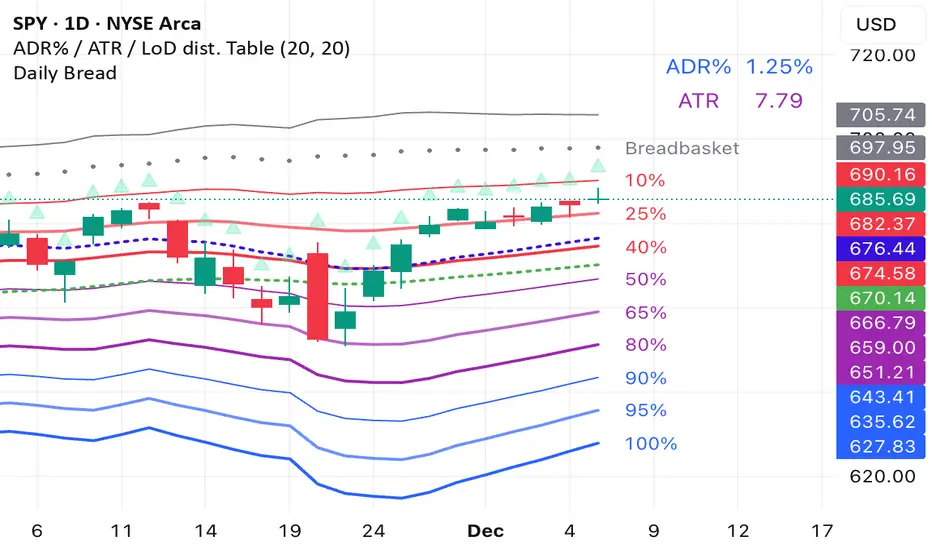
Indikator
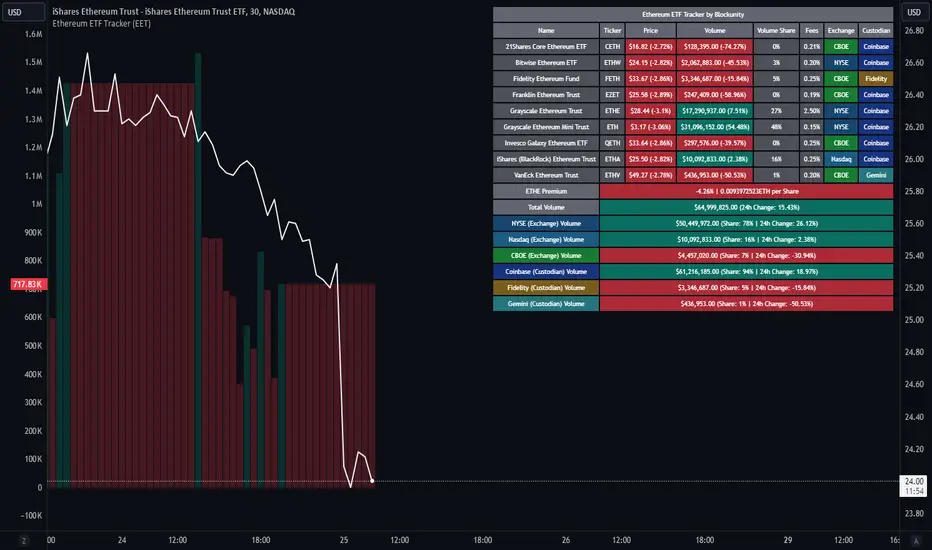
Indikator

Indian Equities Theme Tracker [EWT] - Sector Rotation HeatmapIdentify where the "Smart Money" is flowing in the Indian Markets.
The Indian Equities Theme Tracker is a powerful visual dashboard designed for NSE traders and investors to monitor sector rotation and relative strength in real-time. By tracking the most liquid Exchange Traded Funds (ETFs), this tool provides a birds-eye view of the Indian economy—from core benchmarks like Nifty 50 and Nifty 500 to high-growth themes like Defence, EV, Tourism, and Energy.
In modern markets, capital doesn't move into all stocks at once; it rotates between sectors. This script helps you spot the leaders and laggards across five different timeframes, ensuring you are always positioned in the strongest themes.
🚀 Key Features :
23+ Essential Themes: Tracks Broad Market, Market Caps (Mid/Small), Sectors (IT, Bank, Auto, Metal), and Narratives (Defence, Tourism, EV, Energy).
Dynamic Performance Sorting: Automatically reorders the table based on your selected lookback (1 Day, 1 Week, 1 Month, 3 Months, or YTD).
Heatmap Logic: Intuitive color coding helps you instantly identify extreme bullishness or bearishness across the board.
Liquidity Focused: Uses the most liquid NSE ETFs (BeES and equivalent) to ensure the data is accurate and reflects tradeable prices.
Pro UI Design: A clean, professional dashboard that can be positioned anywhere on your chart without cluttering your price action analysis.
📊 Themes Included :
Benchmarks: Nifty 500, Nifty 50, Nifty Next 50.
Market Caps: Midcap 150, Smallcap 250.
Sectors: Private & PSU Banks, IT, Pharma, Healthcare, FMCG, Auto, Metals, Infra, Realty.
Thematic/Narratives: Defence, Tourism, Energy, EV & New Age Automotive, Consumption.
Safe Havens: Gold & Silver.
🛠️ How to use :
Timeframe: Switch to the Daily (D) timeframe for the best results.
Settings: Use the inputs to change the table position (Top/Middle/Bottom) and the sorting criteria.
Strategy: Look for themes that are consistently at the top of the "1 Month" and "3 Month" lists—these are your structural leaders. Use "1 Day" to spot quick tactical bounces.
Disclaimer: This indicator is for educational and informational purposes only and does not constitute financial advice. Always perform your own due diligence. Indikator

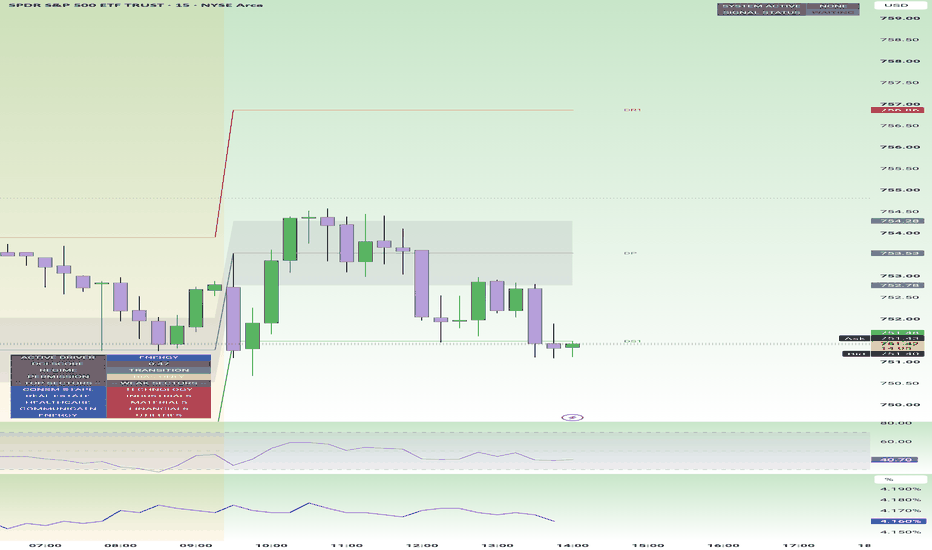
Indikator
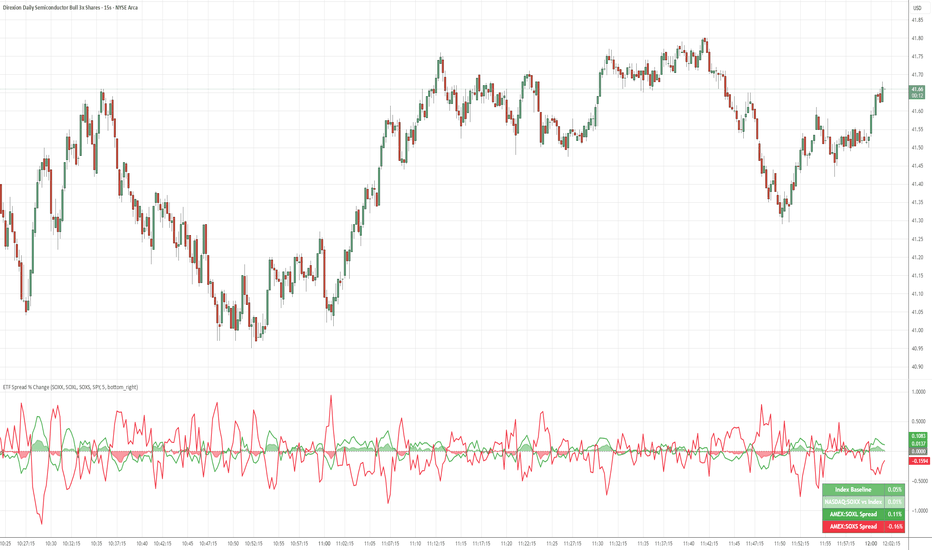
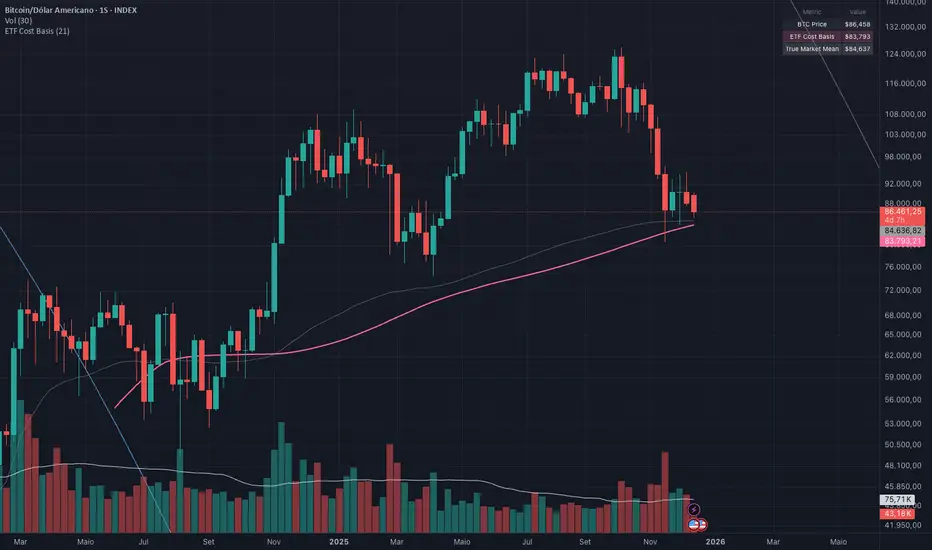
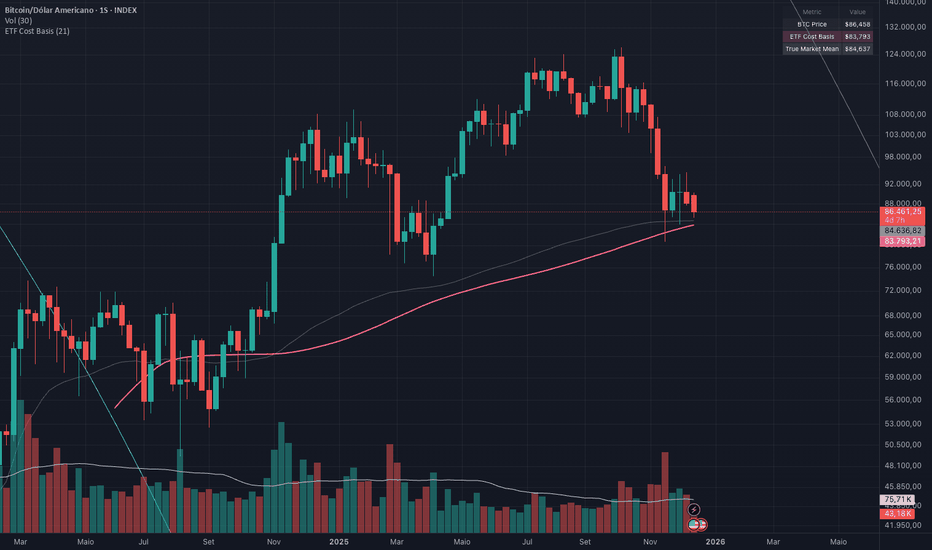
BTC ETF Average Inflow Cost BasisConcept
Since the historic launch of Bitcoin Spot ETFs on January 11, 2024, institutional flows have become a major driver of price action. This indicator aims to visualize the aggregate Cost Basis (average entry price) of the major Bitcoin ETFs relative to the underlying asset.
It serves as an on-chain proxy for institutional positioning, helping traders identify critical support levels where ETF inflows have historically concentrated.
How it Works
The script aggregates daily volume data from the top Bitcoin ETFs (IBIT, FBTC, ARKB, GBTC, BITB) and compares it against the Bitcoin price (BTCUSDT).
ETF Cost Basis (Pink Line):
This is calculated as a Cumulative Volume-Weighted Average Price (VWAP), anchored specifically to the ETF launch date (Jan 11, 2024).
Formula: It accumulates (BTC Price * Total ETF Volume) and divides it by the Cumulative Total ETF Volume.
This creates a dynamic level representing the "breakeven" price for the aggregate volume traded through these funds.
True Market Mean (Gray Line):
This represents the simple cumulative average of the Bitcoin price since the ETF launch date. It acts as a neutral baseline for the post-ETF market era.
How to Use
Institutional Support: The Cost Basis line often acts as a strong dynamic support level during corrections. When price revisits this level, it suggests the market is returning to the average institutional entry price.
Trend Filter:
Price > Cost Basis: The market is in a net profit state relative to ETF flows (Bullish/Trend continuation).
Price < Cost Basis: The market is in a net loss state (Bearish/Capitulation risk).
Confluence: The intersection of the Cost Basis and the True Market Mean can signal pivotal moments of trend reset.
Features
Data Aggregation: Pulls data from 5 major ETFs via request.security without repainting (using closed bars).
Dashboard: Includes a table in the top-right corner displaying real-time values for Price, Cost Basis, and Market Mean.
Customization: You can toggle individual ETF Moving Averages in the settings (disabled by default due to price scale differences between BTC and ETF shares).
Disclaimer
This tool is for educational purposes only and attempts to estimate institutional cost basis using volume proxies. It does not represent financial advice.
Indikator
Bibliothek
Indikator

Indikator

ETF Leverage VerificationDo leveraged ETFs really return what they promise?
Do they return the exact 2x or 3x? Or a slightly different multiple?
How much do they deviate from the promised leverage multiples?
Do these deviations impact investors in a positive or negative manner?
These are the questions that I want to answer with this indicator.
The ETF Leverage Verification indicator challenges the conventional understanding of leveraged ETFs by measuring how they actually perform versus their theoretical targets.
Instead of assuming leveraged ETFs perfectly track their target multiple, this indicator quantifies the real-world behavior by comparing the expected returns versus the actual results on every trading day.
Key Features
Measures actual versus expected performance of leveraged ETFs
Tracks deviation patterns across thousands of trading days
Identifies asymmetric behavior in up versus down markets
Quantifies beneficial "cushioning effect" during market declines
Provides statistical summary of performance patterns
Works with any leverage factor (2x, 3x, -1x, etc.)
Compatible with all leveraged ETFs (equity, bond, commodity, volatility)
How to Use the Indicator
Enter the Expected Leverage Factor (default: 2.0)
Select the Base Asset (underlying index, e.g., SPX)
Select the Leveraged Asset (leveraged ETF, e.g., SSO)
Understanding the Results
Green markers: Days when the ETF outperformed its expected multiple
Red markers: Days when the ETF underperformed its expected multiple
Data Table:
Positive Deviations: Count of days with better-than-expected performance
Negative Deviations: Count of days with worse-than-expected performance
Avg Deviation: Average magnitude of deviation from expected returns
Frequency Skew: Difference between beneficial deviations in down vs. up markets
Impact: Overall assessment of pattern benefit to investors
Summary Label:
Percentage of positive deviations in up and down markets
Total sample size for statistical significance
Key Patterns to Look For
Positive Deviation in Negative Days:
This occurs when a leveraged ETF falls less than expected during market declines. For example, if SPX falls 1% and a 2x ETF falls only 1.8% (instead of the expected 2%), this creates a +0.2% deviation. This pattern is beneficial as it provides downside protection.
Negative Deviation in Positive Days:
This happens when a leveraged ETF rises less than expected during market advances. For example, if SPX rises 1% and a 2x ETF rises only 1.9% (instead of the expected 2%), this creates a -0.1% deviation. This pattern reduces upside performance.
Frequency Skew:
The most critical metric that measures how much more frequently beneficial deviations occur in down markets compared to up markets. A higher positive skew indicates a stronger asymmetric pattern that helps long-term performance.
Mathematical Background
The indicator computes the deviation between expected and actual performance:
Deviation = Actual Return - Expected Return
Where:
Expected Return = Base Asset Return × Leverage Factor
The deviation is then categorized into four possible outcomes:
Positive deviation on positive market days
Negative deviation on positive market days
Positive deviation on negative market days
Negative deviation on negative market days
In short, more positive deviations are good for investors.
Please feel free to criticize. I'm happy to improve the indicator. Indikator

SOXL Trend Surge v3.0.2 – Profit-Only RunnerSOXL Trend Surge v3.0.2 – Profit-Only Runner
This is a trend-following strategy built for leveraged ETFs like SOXL, designed to ride high-momentum waves with minimal interference. Unlike most short-term scalping scripts, this model allows trades to develop over multiple days to even several months, capitalizing on the full power of extended directional moves — all without using a stop-loss.
🔍 How It Works
Entry Logic:
Price is above the 200 EMA (long-term trend confirmation)
Supertrend is bullish (momentum confirmation)
ATR is rising (volatility expansion)
Volume is above its 20-bar average (liquidity filter)
Price is outside a small buffer zone from the 200 EMA (to avoid whipsaws)
Trades are restricted to market hours only (9 AM to 2 PM EST)
Cooldown of 15 bars after each exit to prevent overtrading
Exit Strategy:
Takes partial profit at +2× ATR if held for at least 2 bars
Rides the remaining position with a trailing stop at 1.5× ATR
No hard stop-loss — giving space for volatile pullbacks
⚙️ Strategy Settings
Initial Capital: $500
Risk per Trade: 100% of equity (fully allocated per entry)
Commission: 0.1%
Slippage: 1 tick
Recalculate after order is filled
Fill orders on bar close
Timeframe Optimized For: 45-minute chart
These parameters simulate an aggressive, high-volatility trading model meant for forward-testing compounding potential under realistic trading costs.
✅ What Makes This Unique
No stop-loss = fewer premature exits
Partial profit-taking helps lock in early wins
Trailing logic gives room to ride large multi-week moves
Uses strict filters (volume, ATR, EMA bias) to enter only during high-probability windows
Ideal for leveraged ETF swing or position traders looking to hold longer than the typical intraday or 2–3 day strategies
⚠️ Important Note
This is a high-risk, high-reward strategy meant for educational and testing purposes. Without a stop-loss, trades can experience deep drawdowns that may take weeks or even months to recover. Always test thoroughly and adjust position sizing to suit your risk tolerance. Past results do not guarantee future returns. Backtest range: May 8, 2020 – May 23, 2025 Strategie

ETF Builder & Backtest System [TradeDots]Create, analyze, and monitor your own custom “ETF-like” portfolio directly on TradingView. This script merges up to 10 different assets with user-defined weightings into a single composite chart, allowing you to see how your personalized portfolio would have performed historically. It is an original tool designed to help traders and investors quickly gauge risk and return profiles without leaving the TradingView platform.
📝 HOW IT WORKS
1. Custom Portfolio Construction
Multiple Assets : Combine up to 10 different stocks, ETFs, cryptocurrencies, or other symbols.
User-Defined Weights : Allocate each asset a percentage weight (e.g., 15% in AAPL, 10% in MSFT, etc.).
Single Composite Value : The script calculates a weighted “ETF-style” price, effectively simulating a merged portfolio curve on your chart.
2. Performance Tracking & Return Analysis
Automatic History Capture : The indicator records each asset’s starting price when it first appears in your chosen date range.
Rolling Updates : As time progresses, all asset prices are continually evaluated and the portfolio value is updated in real time.
Buy & Hold Returns : See how each asset—and the overall portfolio—performed from the “start” date to the most recent bar.
Annualized Return : Automatically calculates CAGR (Compound Annual Growth Rate) to help visualize performance over varying timescales.
3. Table & Visual Output
Performance Table : A comprehensive table displays individual asset returns, annualized returns, and portfolio totals.
Normalized Chart Plot : The composite ETF value is scaled to 100 at the start date, making it easy to compare relative growth or decline.
Optional Time Filter : You can define a specific date range (Start/End Dates) to focus on a particular period or to limit historical data.
⚙️ KEY FEATURES
1. Flexible Asset Selection
Choose any symbols from multiple asset classes. The script will only run calculations when data is available—no need to worry about missing quotes.
2. Dynamic Table Reporting
Start Price for each asset
Percentage Weight in the portfolio
Total Return (%) and Annualized Return (%)
3. Simple Backtesting Logic
This script takes a straightforward Buy & Hold perspective. Once the start date is reached, the portfolio remains static until the end date, so you can quickly assess hypothetical growth.
4. Plot Customization
Toggle the main “ETF” plot on/off.
Alter the visual style for tables and text.
Adjust the time filter to limit or extend your performance measurement window.
🚀 HOW TO USE IT
1. Add the Script
Search for “ETF Builder & Backtest System ” in the Indicators & Strategies tab or manually add it to your chart after saving it in your Pine Editor.
2. Configure Inputs
Enable Time Filter : Choose whether to restrict the analysis to a particular date range.
Start & End Date : Define the period you want to measure performance over (e.g., from 2019-12-31 to 2025-01-01).
Assets & Weights : Enter each symbol and specify a percentage weight (up to 10 assets).
Display Options : Pick where you want the Table to appear and choose background/text colors.
3. Interpret the Table & Plots
Asset Rows : Each asset’s ticker, weighting, start price, and performance metrics.
ETF Total Row : Summarizes total weighting, composite starting value, and overall returns.
Normalized Plot : Tracks growth/decline of the combined portfolio, starting at 100 on the chart.
4. Refine Your Strategy
Compare how different weights or a new mix of assets would have performed over the same period.
Assess if certain assets contribute disproportionately to your returns or volatility.
Use the results to guide allocations in your real trading or paper trading accounts.
❗️LIMITATIONS
1. Buy & Hold Only
This script does not handle rebalancing or partial divestments. Once the portfolio starts, weights remain fixed throughout the chosen timeframe.
2. No Reinvestment Tracking
Dividends or other distributions are not factored into performance.
3. Data Availability
If historical data for a particular asset is unavailable on TradingView, related results may display as “N/A.”
4. Market Regimes & Volatility
Past performance does not guarantee similar future behavior. Markets can change rapidly, which may render historical backtests less predictive over time.
⚠️ RISK DISCLAIMER
Trading and investing carry significant risk and can result in financial loss. The “ETF Builder & Backtest System ” is provided for informational and educational purposes only. It does not constitute financial advice.
Always conduct your own research.
Use proper risk management and position sizing.
Past performance does not guarantee future results.
This script is an original creation by TradeDots, published under the Mozilla Public License 2.0.
Use this indicator as part of a broader trading or investment approach—consider fundamental and technical factors, overall market context, and personal risk tolerance. No trading tool can assure profits; exercise caution and responsibility in all financial decisions.
Indikator

Indikator

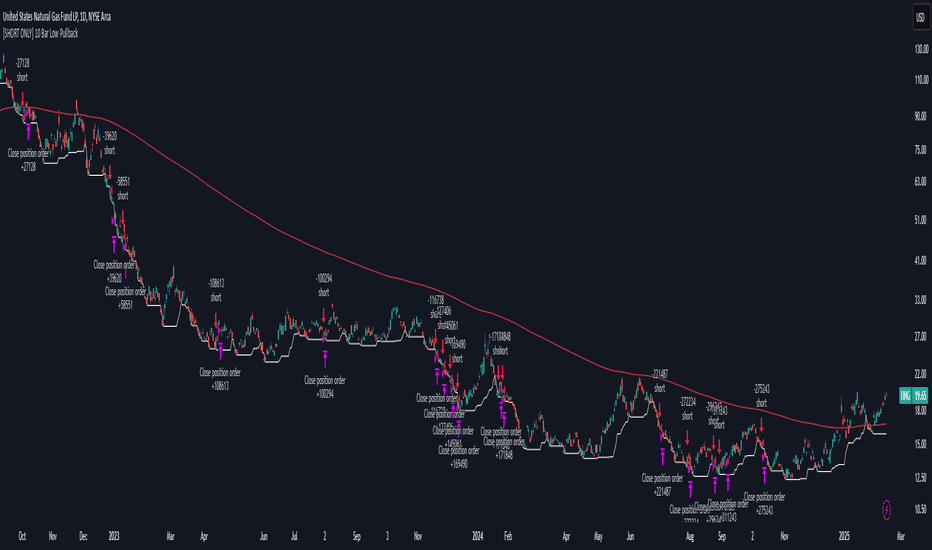
[SHORT ONLY] 10 Bar Low Pullback█ STRATEGY DESCRIPTION
The "10 Bar Low Pullback" strategy is a contrarian short trading system designed to capture pullbacks after a new 10‐bar low is made. it identifies a potential short opportunity when the current bar’s low breaks below the lowest low of the previous 10 bars, provided that the bar exhibits strong internal momentum as measured by its IBS value. An optional trend filter further refines entries by requiring that the close is below a 200-period EMA.
█ WHAT IS INTERNAL BAR STRENGTH (IBS)?
Internal Bar Strength (IBS) measures where the closing price falls within the high-low range of a bar. It is calculated as:
ibs = (close - low) / (high - low)
- Low IBS (≤ 0.2): Indicates the close is near the bar's low, suggesting oversold conditions.
- High IBS (≥ 0.8): Indicates the close is near the bar's high, suggesting overbought conditions.
█ SIGNAL GENERATION
1. SHORT ENTRY
A Short Signal is triggered when:
The current bar’s low is below the lowest low of the past X bars (default: 10).
The bar’s IBS is greater than the specified threshold (default: 0.85).
The signal occurs within the defined trading window (between Start Time and End Time).
If the EMA Filter is enabled, the close must be below the 200-period EMA.
2. EXIT CONDITION
An exit Signal is generated when the current close falls below the previous bar’s low (close < low ), indicating a potential bearish reversal and prompting the strategy to close its short position.
█ ADDITIONAL SETTINGS
Lookback Period: Defines the number of bars (default is 10) over which the lowest low is calculated.
IBS Threshold: Sets the minimum required IBS value (default is 0.85) to qualify as a pullback.
Trading Window: Trades are only executed between the user-defined Start Time and End Time.
EMA Filter (Optional): When enabled, short entries are only considered if the current close is below the 200-period EMA, with the EMA period being adjustable (default is 200).
█ PERFORMANCE OVERVIEW
Designed for shorting opportunities, this strategy aims to capture pullbacks following an aggressive 10-bar low break.
It leverages a combination of a lookback low and IBS measurement to identify overextended bullish moves that may revert.
The optional EMA filter helps confirm a bearish market environment by ensuring the price remains under the trend line.
Suitable for use on various assets, including stocks and ETFs, on daily or similar timeframes.
Backtesting and parameter optimization are recommended to tailor the strategy to specific market conditions.
Strategie
[SHORT ONLY] ATR Sell the Rip Mean Reversion Strategy█ STRATEGY DESCRIPTION
The "ATR Sell the Rip Mean Reversion Strategy" is a contrarian system that targets overextended price moves on stocks and ETFs. It calculates an ATR‐based trigger level to identify shorting opportunities. When the current close exceeds this smoothed ATR trigger, and if the close is below a 200-period EMA (if enabled), the strategy initiates a short entry, aiming to profit from an anticipated corrective pullback.
█ HOW IS THE ATR SIGNAL BAND CALCULATED?
This strategy computes an ATR-based signal trigger as follows:
Calculate the ATR
The strategy computes the Average True Range (ATR) using a configurable period provided by the user:
atrValue = ta.atr(atrPeriod)
Determine the Threshold
Multiply the ATR by a predefined multiplier and add it to the current close:
atrThreshold = close + atrValue * atrMultInput
Smooth the Threshold
Apply a Simple Moving Average over a specified period to smooth out the threshold, reducing noise:
signalTrigger = ta.sma(atrThreshold, smoothPeriodInput)
█ SIGNAL GENERATION
1. SHORT ENTRY
A Short Signal is triggered when:
The current close is above the smoothed ATR signal trigger.
The trade occurs within the specified trading window (between Start Time and End Time).
If the EMA filter is enabled, the close must also be below the 200-period EMA.
2. EXIT CONDITION
An exit Signal is generated when the current close falls below the previous bar’s low (close < low ), indicating a potential bearish reversal and prompting the strategy to close its short position.
█ ADDITIONAL SETTINGS
ATR Period: The period used to calculate the ATR, allowing for adaptability to different volatility conditions (default is 20).
ATR Multiplier: The multiplier applied to the ATR to determine the raw threshold (default is 1.0).
Smoothing Period: The period over which the raw ATR threshold is smoothed using an SMA (default is 10).
Start Time and End Time: Defines the time window during which trades are allowed.
EMA Filter (Optional): When enabled, short entries are only executed if the current close is below the 200-period EMA, confirming a bearish trend.
█ PERFORMANCE OVERVIEW
This strategy is designed for use on the Daily timeframe, targeting stocks and ETFs by capitalizing on overextended price moves.
It utilizes a dynamic, ATR-based trigger to identify when prices have potentially peaked, setting the stage for a mean reversion short entry.
The optional EMA filter helps align trades with broader market trends, potentially reducing false signals.
Backtesting is recommended to fine-tune the ATR multiplier, smoothing period, and EMA settings to match the volatility and behavior of specific markets.
Strategie

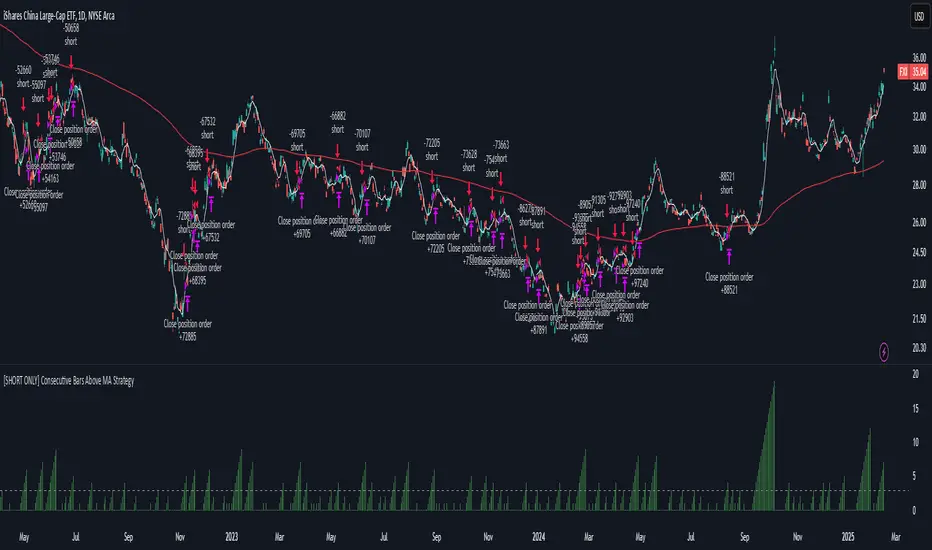
[SHORT ONLY] Consecutive Bars Above MA Strategy█ STRATEGY DESCRIPTION
The "Consecutive Bars Above MA Strategy" is a contrarian trading system aimed at exploiting overextended bullish moves in stocks and ETFs. It monitors the number of consecutive bars that close above a chosen short-term moving average (which can be either a Simple Moving Average or an Exponential Moving Average). Once the count reaches a preset threshold and the current bar’s close exceeds the previous bar’s high within a designated trading window, a short entry is initiated. An optional EMA filter further refines entries by requiring that the current close is below the 200-period EMA, helping to ensure that trades are taken in a bearish environment.
█ HOW ARE THE CONSECUTIVE BULLISH COUNTS CALCULATED?
The strategy utilizes a counter variable, `bullCount`, to track consecutive bullish bars based on their relation to the short-term moving average. Here’s how the count is determined:
Initialize the Counter
The counter is initialized at the start:
var int bullCount = na
Bullish Bar Detection
For each bar, if the close is above the selected moving average (either SMA or EMA, based on user input), the counter is incremented:
bullCount := close > signalMa ? (na(bullCount) ? 1 : bullCount + 1) : 0
Reset on Non-Bullish Condition
If the close does not exceed the moving average, the counter resets to zero, indicating a break in the consecutive bullish streak.
█ SIGNAL GENERATION
1. SHORT ENTRY
A short signal is generated when:
The number of consecutive bullish bars (i.e., bars closing above the short-term MA) meets or exceeds the defined threshold (default: 3).
The current bar’s close is higher than the previous bar’s high.
The signal occurs within the specified trading window (between Start Time and End Time).
Additionally, if the EMA filter is enabled, the entry is only executed when the current close is below the 200-period EMA.
2. EXIT CONDITION
An exit signal is triggered when the current close falls below the previous bar’s low, prompting the strategy to close the short position.
█ ADDITIONAL SETTINGS
Threshold: The number of consecutive bullish bars required to trigger a short entry (default is 3).
Trading Window: The Start Time and End Time inputs define when the strategy is active.
Moving Average Settings: Choose between SMA and EMA, and set the MA length (default is 5), which is used to assess each bar’s bullish condition.
EMA Filter (Optional): When enabled, this filter requires that the current close is below the 200-period EMA, supporting entries in a downtrend.
█ PERFORMANCE OVERVIEW
This strategy is designed for stocks and ETFs and can be applied across various timeframes.
It seeks to capture mean reversion by shorting after a series of bullish bars suggests an overextended move.
The approach employs a contrarian short entry by waiting for a breakout (close > previous high) following consecutive bullish bars.
The adjustable moving average settings and optional EMA filter allow for further optimization based on market conditions.
Comprehensive backtesting is recommended to fine-tune the threshold, moving average parameters, and filter settings for optimal performance.
Strategie

[SHORT ONLY] Consecutive Close>High[1] Mean Reversion Strategy█ STRATEGY DESCRIPTION
The "Consecutive Close > High " Mean Reversion Strategy is a contrarian daily trading system for stocks and ETFs. It identifies potential shorting opportunities by counting consecutive days where the closing price exceeds the previous day's high. When this consecutive day count reaches a predetermined threshold, and if the close is below a 200-period EMA (if enabled), a short entry is triggered, anticipating a corrective pullback.
█ HOW ARE THE CONSECUTIVE BULLISH COUNTS CALCULATED?
The strategy uses a counter variable called `bullCount` to track how many consecutive bars meet a bullish condition. Here’s a breakdown of the process:
Initialize the Counter
var int bullCount = 0
Bullish Bar Detection
Every time the close exceeds the previous bar's high, increment the counter:
if close > high
bullCount += 1
Reset on Bearish Bar
When there is a clear bearish reversal, the counter is reset to zero:
if close < low
bullCount := 0
█ SIGNAL GENERATION
1. SHORT ENTRY
A Short Signal is triggered when:
The count of consecutive bullish closes (where close > high ) reaches or exceeds the defined threshold (default: 3).
The signal occurs within the specified trading window (between Start Time and End Time).
2. EXIT CONDITION
An exit Signal is generated when the current close falls below the previous bar’s low (close < low ), prompting the strategy to exit the position.
█ ADDITIONAL SETTINGS
Threshold: The number of consecutive bullish closes required to trigger a short entry (default is 3).
Start Time and End Time: The time window during which the strategy is allowed to execute trades.
EMA Filter (Optional): When enabled, short entries are only triggered if the current close is below the 200-period EMA.
█ PERFORMANCE OVERVIEW
This strategy is designed for Stocks and ETFs on the Daily timeframe and targets overextended bullish moves.
It aims to capture mean reversion by entering short after a series of consecutive bullish closes.
Further optimization is possible with additional filters (e.g., EMA, volume, or volatility).
Backtesting should be used to fine-tune the threshold and filter settings for specific market conditions.
Strategie

Indikator

Indikator

Indikator