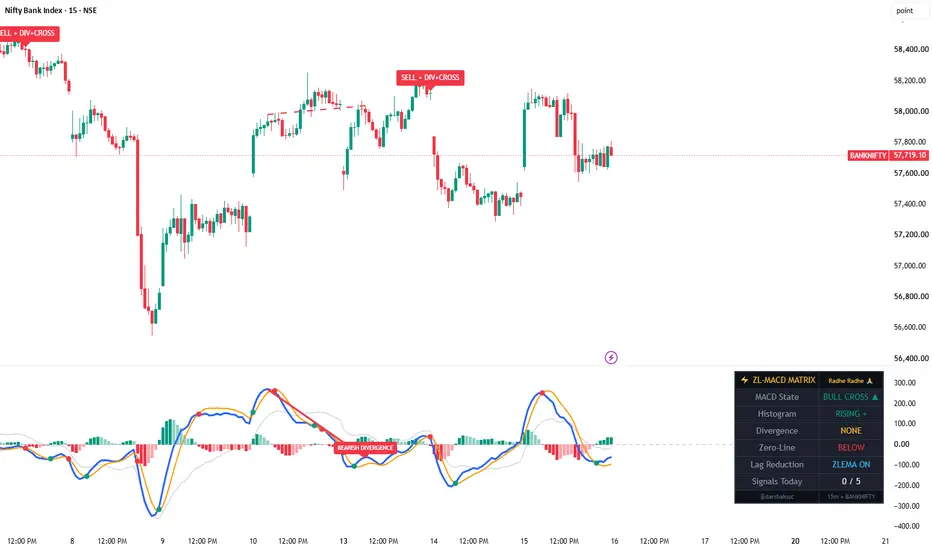
MACD Momentum StructureMACD Momentum Structure
MACD Momentum Structure transforms the traditional MACD into a visual momentum framework designed to make changes in market momentum easier to interpret.
Instead of relying only on the conventional MACD histogram and signal-line crossover, the script organizes momentum into a dynamic visual structure that highlights how momentum develops, expands, slows, and transitions.
What It Shows
Momentum Wave
A smoothed representation of MACD that makes the underlying momentum structure easier to follow.
Momentum Phases
The indicator identifies different stages of momentum development, including:
* Bullish Acceleration
* Bullish Expansion
* Bullish Deceleration
* Bearish Acceleration
* Bearish Expansion
* Bearish Deceleration
* Transition
These phases help visualize whether momentum is strengthening, continuing, weakening, or transitioning.
Momentum Turning Points
Confirmed swing points are highlighted on the momentum wave to make important changes in momentum structure easier to identify.
Momentum Flow
A visual flow element extends the current momentum direction to illustrate the potential continuation path of the current momentum structure. This is a visual aid, not a prediction or guarantee of future price movement.
Momentum Divergence
The indicator can highlight potential bullish and bearish divergence between price structure and MACD momentum, helping identify situations where price movement and underlying momentum may be developing differently.
MACD Structure
The traditional MACD, signal line, histogram, and zero-line relationship remain visible, while the additional visual structure provides greater context around those familiar signals.
How to Read It
The visual structure can be interpreted as a sequence of momentum development:
Acceleration → Expansion → Deceleration → Transition
Strong acceleration and expansion indicate increasing momentum, while deceleration can indicate that the current momentum is losing strength. A transition phase highlights a change in the relationship between momentum and its signal structure.
The purpose is not to predict the market with certainty, but to make momentum behavior more visible and easier to analyze.
Important Note
This indicator is a visual analytical tool based on MACD calculations and momentum structure. Turning points and divergence signals are confirmed using historical data and may appear with a delay.
It does not provide guaranteed future price predictions, entry signals, or trading results.
Use it together with price action, market structure, volatility, and other forms of technical analysis as part of a broader trading process.
Indikator

MACD + Impulse MACD - Normalized Momentum ScaleThis indicator brings two complementary momentum frameworks — standard Price MACD and Impulse MACD — into one shared, normalized momentum environment. The result is a view that goes beyond a single crossover or histogram reading: it lets you see how two different expressions of momentum are behaving together, where they agree, where they diverge, which one is leading, how strongly each is expanding or contracting, and whether that relationship is being reinforced by the developing higher timeframe.
At the center of the design is the Normalized Momentum Scale (NMS), which places both MACD families on the same fixed -100 to +100 coordinate. That common scale is what makes the comparison meaningful. Instead of looking at two separate indicators with unrelated native magnitudes, the script lets their lines, signals, histograms, crossover age, and higher-timeframe context coexist in one visual framework.
The standard Price MACD side captures the familiar relationship between fast and slow exponential averages of Close. The Impulse MACD side approaches momentum differently, using a smoothed High/Low envelope and a zero-lag EMA centerline to distinguish movement occurring inside that envelope from movement extending beyond it. This implementation was inspired by LazyBear's Impulse MACD concept:
Those differences are exactly what make the pairing useful. The goal is not to make standard MACD and Impulse MACD behave alike, but to give them a common language for magnitude and direction. When both expand together, when one begins to roll over before the other, when their histograms disagree, or when the developing higher timeframe confirms one side of the picture, those relationships become much easier to see and interpret.
➖The Normalized Momentum Scale➖
The core of the indicator is the Normalized Momentum Scale, or NMS. Each raw MACD-derived value is first divided by ATR14. This changes the question from:
“How many price units apart are these values?” to: “How large is this momentum displacement relative to the instrument's current volatility?”
That first normalization step makes the measurement substantially more portable across instruments and timeframes. But simply plotting ATR-normalized values on a linear scale creates another problem. Most ordinary momentum activity remains clustered relatively close to zero, while occasional large expansions can stretch the scale dramatically. NMS addresses that by applying a monotonic nonlinear transfer to the ATR-relative value and mapping it onto a fixed -100 to +100 coordinate. The scale deliberately provides more visual resolution through the region where momentum spends most of its time, while progressively compressing increasingly uncommon volatility-relative excursions toward the outer limits.
Its principal absolute-value calibration points are 0.70 ATR → 34, 1.25 ATR → 55, 2.50 ATR → 65, 4.00 ATR → 75, 7.00 ATR → 89, 12.0 ATR → 95, and 20.0 ATR → 100.
This is not a percentage scale, probability scale, RSI-style oscillator, or automatic overbought/oversold model. A reading of 75 does not mean “75% bullish.” It means that the underlying momentum displacement has reached a particular standardized magnitude relative to prevailing volatility. Because the transformation is monotonic, the ordering of MACD and its Signal is preserved. A bullish MACD crossover before normalization remains a bullish crossover after normalization.
➖Standard MACD➖
The standard MACD side defaults to the familiar 12 / 26 / 9 configuration, with all three lengths exposed in Settings. MACD and MACD Signal are independently normalized against ATR14 and then mapped through NMS. This preserves their crossover relationship while placing both lines on the common -100 to +100 momentum coordinate. The shaded region between them makes expansion and contraction easier to see. When MACD leads Signal, the pair assumes the bullish family color; when Signal leads MACD, it assumes the bearish family color.
The MACD Histogram is treated separately and importantly. The script first calculates the true raw histogram — MACD minus Signal — before normalization. That raw difference is then divided by ATR14 and independently mapped through NMS. This matters because subtracting two values after they have already passed through a nonlinear scale would distort the actual histogram magnitude.
➖Impulse MACD➖
Impulse MACD provides a second view of momentum. Its default architecture uses a 34-period smoothed High/Low envelope, a 34-period zero-lag EMA centerline, and a 9-period Signal. Both lengths are user-adjustable. The Impulse value remains at zero while its centerline is contained within the smoothed envelope and begins expressing signed momentum as that centerline moves beyond the envelope. This gives it a different character from standard MACD and can make the comparison between the two especially useful during transitions.
Impulse MACD and its Signal are normalized and mapped through the exact same NMS architecture as standard MACD. Its histogram is also calculated from the true raw difference first — Impulse MACD minus Impulse Signal — and only then normalized by ATR14 and mapped through NMS. That gives the indicator two genuinely different momentum models without sacrificing a common measurement framework.
➖Reading the two together➖
The indicator is not intended to answer only whether momentum is bullish or bearish. Its larger purpose is to show how two different momentum constructions are behaving relative to one another. When standard MACD and Impulse MACD are both expanding in the same direction, momentum is being expressed through both the conventional EMA relationship and the filtered Impulse framework. When one begins contracting, crossing, or changing direction before the other, that disagreement can reveal a transition that would be less obvious when either indicator is viewed alone.
The histograms add another layer. Their sign identifies current MACD-versus-Signal ownership, while their NMS magnitude shows how large that separation is relative to volatility. A small positive histogram just above zero and a positive histogram near 55 are therefore not visually treated as equivalent momentum conditions.
➖Developing higher-timeframe context➖
A Developing Auto-Next-HTF MACD Histogram is included as a higher-timeframe reference.
This is not the chart-timeframe histogram resampled onto a higher timeframe. The complete MACD calculation is performed natively inside the automatically selected next higher timeframe using the same user-selected Fast, Slow, and Signal lengths. That higher timeframe also calculates its own ATR14 before the histogram is mapped through NMS. The result gives a direct view of whether the local histogram is aligned with, diverging from, or potentially moving ahead of the developing momentum structure one timeframe above. Because this is intentionally a Developing HTF value, it can change while the current higher-timeframe candle remains open. It should be treated as live context rather than a confirmed higher-timeframe signal.
➖Focused NMS guide levels➖
The right side of the oscillator uses the semantic ladder 0, ±13, ±34, ±55, ±75, ±89 and ±100, but the indicator intentionally does not display every level all the time. Zero remains the permanent center reference. Other guide levels appear only when currently visible momentum geometry is actually approaching them. The guide engine considers standard MACD, MACD Signal, MACD Histogram, Developing HTF Histogram, Impulse MACD, Impulse Signal, and Impulse Histogram. A distant -75 level, for example, is not displayed merely because it is the next available rung below the current MACD value. This keeps the scale contextual and reduces unnecessary visual clutter while still making important momentum zones visible as they become relevant. Again, these levels should not automatically be interpreted as support/resistance or overbought/oversold thresholds. They are reference points on the standardized momentum scale.
➖Right-side labels➖
Current NMS values are displayed directly beside the oscillator through a compact right-label system. The MACD family and Impulse family each track the age of their most recent crossover using an inclusive bars-ago convention, where the crossover candle itself is 1ba. Crossover age also follows directional ownership. During a bullish MACD state, the age appears with MACD; during a bearish state, it appears with MACD Signal. The same convention is used for Impulse MACD and Impulse Signal. This makes it possible to see not only which component currently owns the pair, but also how long that relationship has been active.
➖Price-pane momentum context➖
The indicator can also project its histogram state onto the main price chart without moving the oscillator out of its pane. Optional force-overlay candles use the chart's actual Open, High, Low, and Close. Only their color is supplied by the momentum engine. Users can choose either MACD Histogram or Impulse Histogram as the candle-color source, with MACD Histogram selected by default. The candle body, wick, and border have independent transparency controls.
➖Customization➖
The default presentation is intentionally designed to show the relationship between the two systems while remaining readable. MACD / Signal and Impulse MACD / Signal default to line presentation, while both true histograms remain available as histogram plots. Historical display windows, widths, transparency, fills, labels, and plot styles can all be adjusted.
Color customization has been kept intentionally simple. The entire standard MACD family shares one Bull / Bear / Neutral palette, while the entire Impulse family shares a separate Bull / Bear / Neutral palette. This keeps the visual language consistent without requiring a separate color control for every individual plot.
➖How I use the scale➖
I generally begin with direction around zero, then look at which member owns each MACD/Signal pair, followed by the magnitude and direction of the histograms. From there, the NMS level provides context for how significant that momentum condition is relative to volatility.
A crossover occurring near the center of the scale may represent a very different market condition from a crossover occurring after one family has already expanded toward 55, 75, or beyond.
The Developing HTF Histogram then provides a final layer of context: is the next timeframe reinforcing the local move, opposing it, or beginning to turn?
The value of the indicator is therefore less about finding one “magic” level and more about seeing direction, magnitude, agreement, disagreement, expansion, contraction, crossover age, and higher-timeframe alignment in one standardized momentum framework.
➖Important note➖
The Normalized Momentum Scale changes the representation of momentum magnitude, not the underlying MACD relationships themselves.
Standard MACD remains standard MACD. Impulse MACD remains its own separate momentum construction. NMS simply gives both a common volatility-relative coordinate so their behavior can be compared more meaningfully.
The current chart bar and the Developing HTF series can both evolve while their respective candles are open. As with any technical indicator, this tool is intended to provide analytical context rather than predict future price movement with certainty.
➖A few chart examples➖
Indikator

MACD Matrix [Quantum Algo]MACD Matrix
═══════════════════════════════════════════════
🔶 OVERVIEW
MACD Matrix reads the Moving Average Convergence Divergence as a complete momentum system rather than a single line and histogram. It classifies momentum into four quadrants instead of one sign, aligns four timeframes into a live matrix with a scored consensus, detects histogram divergence and draws it on both the oscillator and the price candles, tracks histogram compression before expansion, and paints a momentum river through price so the entire reading lives on the chart — not only in the pane below it.
The result is a MACD you can read from the candles alone: the river's color tells you the quadrant, the aura tells you whether momentum is expanding or fading, gold beacons mark full multi-timeframe alignment, and every signal carries its own historical record on the exact symbol you are trading.
═══════════════════════════════════════════════
🔶 WHAT IS MACD?
The Moving Average Convergence Divergence, created by Gerald Appel, measures momentum as the distance between a fast and a slow exponential moving average. A signal line smooths that distance, and the histogram — introduced by Thomas Aspray — shows the gap between the two. MACD above zero means the fast average leads the slow one (bullish regime); the histogram rising means momentum is accelerating.
═══════════════════════════════════════════════
🔶 WHAT ARE THE FOUR MACD QUADRANTS?
Most traders read MACD as bullish or bearish. It actually has four distinct states, and the difference between them is where the money is:
— Expanding ▲: above zero and the histogram rising — momentum accelerating in an uptrend.
— Fading ▲: above zero and the histogram falling — the uptrend losing thrust, the earliest warning.
— Expanding ▼: below zero and the histogram falling — momentum accelerating in a downtrend.
— Fading ▼: below zero and the histogram rising — the downtrend losing thrust, the earliest turn.
MACD Matrix names the quadrant on every bar, colors the river and the aura by it, and stamps it into every signal's tooltip.
═══════════════════════════════════════════════
🔶 WHY IS THIS ORIGINAL?
1. The quadrant engine. Four momentum phases instead of two, made visible on the price chart through the momentum river and aura, so fading momentum is caught before the sign ever flips.
2. The timeframe matrix. Four configurable timeframes, each read as side-of-zero × expanding-or-fading, with a consensus score. A gold beacon prints on price the moment all four align with expanding momentum — a threshold event, not a vague "trend agreement."
3. Dual-canvas divergence. Histogram divergences are drawn as connectors in the pane AND as dashed twins across the corresponding price pivots on the chart, so the divergence is visible exactly where you trade it.
4. The histogram squeeze. Histogram amplitude is ranked inside its own recent history; when it compresses below a low percentile the momentum is coiled, marked with gold dots, and the expansion out of the coil fires a directional release signal — a compression concept almost never applied to MACD.
5. Signal families with per-symbol records. Zero-line crosses, early signal crosses on the correct side of zero, divergences and squeeze releases are tracked as separate families, each with ten-bar outcome statistics shrunk toward neutral at small samples and a Wilson lower bound — quoted in every tooltip and on the dashboard.
═══════════════════════════════════════════════
🔶 HOW IT WORKS
— MACD, signal and histogram are computed from configurable lengths; the quadrant is derived from the sign of MACD and the direction of the histogram.
— Four higher-timeframe MACD states are requested without lookahead and scored into the matrix.
— Histogram pivots are compared against price pivots to detect regular divergences, drawn on both canvases.
— Histogram amplitude is ranked against its own history for the squeeze; a mature coil that expands fires a release.
— Every signal family feeds its own first-in-first-out outcome samples; statistics are reported with sample counts.
Signals are evaluated on confirmed bars and do not repaint. Higher-timeframe matrix rows finalize when their own bar closes, as with any multi-timeframe reading. All drawings are capped.
═══════════════════════════════════════════════
🔶 HOW TO USE IT
— Trade the quadrant, not the sign: Expanding phases favor continuation entries; Fading phases favor taking profit or tightening risk, and they precede most zero-line crosses.
— Use the matrix as a filter: a 4/4 beacon is the highest-conviction environment; a divided matrix (2/4) warns that timeframes disagree.
— Divergence on the candles: when the dashed price line and the pane connector appear together, you have a momentum-versus-price disagreement located precisely on structure.
— Watch the coil: a long squeeze followed by a release is the setup for expansion; the R family record tells you how reliably releases have followed through here.
— Works on all markets and timeframes; configure the four matrix timeframes to match your trading horizon.
═══════════════════════════════════════════════
🔶 SETTINGS
— MACD: fast, slow and signal lengths.
— Timeframe Matrix: four timeframes.
— Signals & Squeeze: divergence pivot length, squeeze window and percentile, cooldown, signal visibility.
— Statistics: sample cap, minimum samples, shrinkage strength, Wilson z-score.
— Visuals and dashboard: river and aura toggles, river length, full color and position control.
═══════════════════════════════════════════════
🔶 ALERTS
— Matrix Aligned Bullish / Bearish — all four timeframes aligned with expanding momentum.
— Zero-Line Cross — MACD crossed zero.
— Histogram Divergence — a divergence printed.
— Squeeze Release — the histogram expanded out of its coil.
═══════════════════════════════════════════════
🔶 FAQ
Q: Does it repaint?
A: Signals are evaluated on confirmed bars and never change once printed. The higher-timeframe rows of the matrix update while their own bar is open and finalize at its close — this is inherent to any multi-timeframe reading, and no lookahead is used.
Q: How is this different from a standard MACD?
A: A standard MACD shows one line, one signal and one histogram in a pane. This tool adds the quadrant classification, the four-timeframe matrix and beacons, divergence drawn on the price chart itself, the histogram squeeze, the momentum river and aura on price, and per-family statistics.
Q: What does the momentum river represent?
A: A short exponential average of price colored by the current MACD quadrant. Its purpose is purely to carry the momentum reading onto the candles — bright when momentum expands, dimmed when it fades — so you can read momentum without looking away from price.
Q: What do the family percentages mean?
A: The share of past signals in that family after which price had moved favorably ten bars later, on the current symbol and timeframe, shrunk toward fifty percent at small samples. They describe history — they are not predictions.
Q: Which settings should I change first?
A: The four matrix timeframes, so the matrix reflects your own trading horizons. The MACD lengths follow the classic 12, 26, 9 defaults.
═══════════════════════════════════════════════
🔶 CREDITS
The Moving Average Convergence Divergence is by Gerald Appel; the MACD histogram is by Thomas Aspray (1986). The Wilson score interval is by Edwin B. Wilson (1927). The quadrant engine, timeframe matrix and beacon logic, dual-canvas divergence rendering, histogram squeeze, per-symbol statistics and all code in this script are original work — no third-party or open-source script code was reused.
═══════════════════════════════════════════════
🔶 LIMITATIONS
— MACD is a lagging momentum measure; the quadrant engine reduces but cannot eliminate lag.
— Divergences can extend before resolving; the family record exists to quantify this on your chart.
— Statistics describe the current chart's history only; past frequencies never guarantee future outcomes.
═══════════════════════════════════════════════
🔶 DISCLAIMER
This indicator is a research and charting tool provided for educational purposes. It is not financial advice, and nothing it displays is a recommendation to buy or sell any asset. Trading involves substantial risk of loss. Always do your own analysis and manage risk responsibly. Indikator

Divergence Scanner - Multi-Oscillator Confirmation [Dots3Red]📉 DIVERGENCE SMART SCANNER — MULTI-OSCILLATOR CONFIRMATION STATS
A single-oscillator divergence — price makes a new high while RSI doesn't confirm it — is treated as a reversal warning almost everywhere. Whether adding a second or third oscillator's agreement actually makes that warning more reliable is rarely tested. This script tests it, directly, on the chart in front of you.
✨ WHY THIS MATTERS
"More confirmation means more reliable" is one of the most repeated pieces of trading folklore. This script checks whether that's actually true here, rather than assuming it. Every divergence is checked against three separate oscillators — RSI, MACD histogram, and Williams %R — and graded by how many of them agreed. The outcome of every divergence is then tracked, sorted by that confirmation count:
📊 1 oscillator confirms: 54% reversed (n=28)
📊 2 oscillators confirm: 63% reversed (n=19)
📊 3 oscillators confirm: 71% reversed (n=9)
If confluence genuinely matters on this chart, these numbers should step upward. If they don't, that's useful information too — either way, it's measured, not assumed.
⚙️ HOW IT WORKS
📐 Swing detection — confirmed pivot highs and lows, each stored alongside the value every oscillator held at that exact moment, so structure is compared pivot-to-pivot rather than pivot-to-current-bar.
📊 Multi-oscillator confirmation — a bearish divergence requires price making a higher high; each oscillator that simultaneously makes a *lower* high adds one to the confirmation count. Bullish divergence is the mirror case at swing lows. The count (1, 2, or 3) is shown directly on the chart label.
🎯 Tiered outcome grading — every divergence is tracked forward. If price genuinely moves in the expected reversal direction by a meaningful distance within a set window, it's graded as reversed; otherwise it isn't. The result feeds into that specific confirmation tier's running statistic — 1-oscillator divergences are never mixed together with 3-oscillator ones, since that's exactly the comparison the whole tool exists to make.
🔒 Non-repainting — all detection and grading happens strictly on confirmed bars.
🧭 HOW TO USE
1️⃣ Read the confirmation count on the label before reacting to a divergence. "▼ 1/3 confirm" and "▼ 3/3 confirm" look like the same event on the chart but carry very different weight once you check their respective tiers.
2️⃣ Check the dashboard's tier stats, not just the current divergence. The measured reversal rate and sample size (n=) for that specific tier tell you how much history actually backs it up on this chart.
3️⃣ Let the sample size guide your confidence. A tier with 4-5 recorded events is still forming; one with 30+ is telling you something real about how this instrument has behaved.
4️⃣ Use the tier comparison to decide whether waiting for more confluence is worth it. If reversal rates climb clearly from 1 to 2 to 3 oscillators, holding out for stronger confirmation is justified here. If the tiers are flat or don't separate meaningfully, a single-oscillator divergence is just as informative as a rarer triple-confirmed one — and waiting for 3/3 may just mean missing setups for no real benefit.
5️⃣ Treat it as context, not a trigger. Like every tool in this catalog, it describes what has already happened — it doesn't predict what happens next.
⏱️ WHICH TIMEFRAMES WORK BEST
Divergence needs enough bars between swings to form and then resolve meaningfully, which generally makes 15-minute through 4-hour the most effective range — the same window where most swing-based structure tools perform best.
On very short timeframes (1-3 minute), pivots form so frequently that many flagged divergences will be closer to noise than genuine structure — the tier sample sizes will grow quickly, but individual signals may carry less weight. On daily or weekly charts, genuine divergence setups are naturally rarer, so expect fewer signals and a longer wait before any tier's sample size becomes large enough to trust. The tool still functions on both ends of that range — it simply takes longer, or shorter, for its statistics to become genuinely informative.
🛠️ SETTINGS
📐 Swing Detection — Pivot Leg (bars required on each side to confirm a pivot)
📊 Oscillators — independent length settings for RSI, MACD, and Williams %R
🎯 Outcome Grading — Reversal Confirmation distance (in ATR) and Outcome Window (bars)
🎨 Visualization — toggle divergence lines and confirmation labels independently; line width, line style, label size, and label position style (natural above/below placement, or pointing left)
🎨 Colors — independent bullish/bearish line and label text colors, label background, and full dashboard color control including separate good/bad outcome indicators
🖥️ Dashboard — show/hide, position — all three confirmation tiers with their measured reversal rates and total signal count
📝 NOTES
Statistics accumulate from when the indicator is added to the chart. Higher-confirmation tiers (2 and especially 3 oscillators) will naturally take longer to build a meaningful sample than the 1-oscillator tier, since triple-confirmed divergences are rarer by definition.
⚠️ DISCLAIMER
This is an analytical and visualization tool. It does not generate trade signals and does not constitute financial advice. Historical reversal rates do not guarantee how any future divergence will resolve. Indikator

MACD Pullback Validation with Divergence Filters [algotim]MACD Pullback Validation with Divergence Filters is a momentum confirmation indicator designed to identify continuation opportunities after temporary pullbacks rather than generating signals from every MACD crossover.
Instead of relying on a single event, the script evaluates multiple stages of market behavior. It begins by detecting pullbacks within an existing momentum cycle, waits for momentum recovery, confirms that price and the MACD histogram are no longer weakening, and optionally verifies that the setup occurs near significant price locations using pivot-derived support/resistance levels or Bollinger Band extremes.
The objective is to reduce low-quality MACD signals by requiring several independent conditions to align before a bullish or bearish signal is displayed.
Problem Statement
Traditional MACD crossover signals frequently occur during ranging markets or immediately after short-lived momentum fluctuations. Likewise, divergence signals alone often appear too early and do not necessarily indicate that momentum has already shifted back in the anticipated direction.
This indicator addresses that limitation by requiring multiple confirmation stages rather than treating each condition as an independent trading signal.
Instead of responding to isolated events, it evaluates whether a pullback has occurred, whether momentum is rebuilding, whether a recent divergence supports the move, and whether price is located in an area where reversals may be more meaningful.
Methodology
The analytical framework consists of several sequential validation layers.
First, MACD crossover events occurring above or below the zero line are monitored to identify temporary pullbacks within an existing momentum cycle. These crossover events establish the recent pullback state.
Next, the script monitors the MACD histogram. Bullish momentum requires the histogram to remain above zero while increasing relative to the previous bar. Bearish momentum requires the histogram to remain below zero while decreasing.
The indicator then waits for the MACD line itself to cross the zero line, treating this as evidence that momentum has shifted back in the direction of the prevailing move.
Histogram divergence is calculated using confirmed pivot highs and pivot lows. Regular bullish divergence requires price to form a lower low while the histogram forms a higher low. Regular bearish divergence requires price to form a higher high while the histogram forms a lower high. Hidden divergence calculations are also available for users who wish to visualize continuation-type divergence.
Finally, optional contextual filters may be enabled.
The Support/Resistance filter checks whether the current price is interacting with recently confirmed pivot-based levels.
The Bollinger Band filter requires bullish setups to occur after closing below the lower band and bearish setups after closing above the upper band, helping identify momentum reversals from statistically extended price conditions.
Signals are generated only after every enabled validation layer has been satisfied.
Signal Workflow
Bullish workflow
1. Detect a recent bearish MACD crossover occurring above the zero line to identify a pullback.
2. Confirm a regular bullish MACD histogram divergence using pivot comparisons.
3. Require the MACD histogram to begin strengthening.
4. Wait for the MACD line to cross back above the zero line.
5. Optionally require interaction with recent pivot-based support.
6. Optionally require price to close below the lower Bollinger Band.
7. Display a bullish signal.
Bearish workflow
1. Detect a recent bullish MACD crossover occurring below the zero line.
2. Confirm a regular bearish MACD histogram divergence.
3. Require bearish histogram acceleration.
4. Wait for the MACD line to cross below the zero line.
5. Optionally require interaction with recent pivot-based resistance.
6. Optionally require price to close above the upper Bollinger Band.
7. Display a bearish signal.
Why This Indicator Is Different
Many MACD indicators generate signals immediately after crossovers, while divergence indicators typically evaluate price and momentum independently.
This script integrates these concepts into a sequential validation framework where each condition serves a different analytical purpose.
The pullback logic identifies temporary counter-trend momentum.
The histogram evaluates whether momentum is rebuilding.
The zero-line crossover confirms broader momentum alignment.
Divergence provides evidence that momentum and price are no longer moving in agreement.
Optional pivot interaction and Bollinger Band filters add market-location confirmation before a signal is produced.
Rather than displaying every crossover or every divergence, the indicator waits until multiple independent conditions align before producing a trading signal.
Inputs
The script includes configurable parameters for:
* MACD fast, slow, and signal periods
* Pullback lookback window
* Divergence pivot lengths
* Divergence range settings
* Optional hidden divergence display
* Optional Support/Resistance validation
* Pivot sensitivity
* Optional Bollinger Band confirmation
* Bollinger Band length and standard deviation
Alerts
Built-in alert conditions are available for:
* Bullish Signal
* Bearish Signal
* Regular Bullish Divergence
* Hidden Bullish Divergence
* Regular Bearish Divergence
* Hidden Bearish Divergence
Practical Usage
The indicator is intended for traders who prefer waiting for momentum confirmation after temporary pullbacks instead of reacting to every MACD crossover.
Optional Support/Resistance and Bollinger Band filters can be enabled to make signal selection more restrictive when additional price-location confirmation is desired.
Limitations
MACD histogram divergence relies on confirmed pivot highs and lows, so divergence signals are only confirmed after the required pivot bars have formed.
Support and resistance levels are derived from pivot calculations and represent algorithmically identified swing points rather than manually drawn market structure.
Like any momentum-based indicator, performance may vary across different market conditions and should be evaluated alongside a broader trading plan and appropriate risk management.
Notes
This indicator is intended as an analytical decision-support tool. It combines momentum analysis, pullback recognition, divergence detection, and optional contextual filters into a structured confirmation process rather than relying on any individual condition as a standalone trading signal. Indikator

MACD Divergence Engine════════════════════════════════════════════════════
OVERVIEW
MACD Divergence Engine is a rebuild of the classic MACD divergence
detector, redesigned around one question the original never asks:
is this divergence actually worth anything?
A raw divergence is a low-information event. Every oscillator prints
dozens of them, most in conditions where the pattern has no business
working. This engine finds the same structures, then grades each one
from 0 to 100 across ten independent factors and only draws the ones
that clear your threshold. Every signal is labelled with its grade
(A+ / A / B / C / D) and its numeric score, so you can see exactly
how much the model liked it rather than treating all signals alike.
Built on Pine v6. Runs in its own pane with a single zero centre line
as the reference axis.
════════════════════════════════════════════════════
WHAT IT DOES DIFFERENTLY
1 — VOLATILITY NORMALIZATION
Raw MACD is measured in price units. A reading of 0.8 means something
completely different on an index future, on EURUSD, and on a $3
small-cap. That is why fixed MACD thresholds never transfer between
instruments.
Here the oscillator is divided by ATR, by its own standard deviation,
or by percent-of-price (your choice). Every internal threshold is then
expressed in volatility units, so the zero line, the exhaustion bands
and all ten score components mean the same thing on every symbol and
every timeframe without re-tuning. Raw mode is available if you want
the classic scale back.
2 — MULTI-PIVOT SCAN
Conventional divergence scripts compare the current swing to exactly
one prior swing. Real divergences frequently form against the second
or third pivot back, and those get missed entirely.
This build maintains a rolling ledger of recent pivots, evaluates every
legal pairing inside your bar-gap window, scores each one, and emits
the single strongest. Scan depth is adjustable from 1 to 8.
3 — THE CONFLUENCE MODEL
Each divergence candidate is scored across ten orthogonal factors:
· MAGNITUDE — how far apart the price swing and the momentum swing
genuinely are, in ATR and oscillator sigma. Combined as a geometric
mean so a near-flat price leg cannot be rescued by a large
oscillator leg. A 0.1-ATR "divergence" scores near zero.
· EXTREMITY — how stretched the oscillator was at the pivot.
Reversals want an extreme reading; continuations want a shallow
pullback that never reached exhaustion, so this factor inverts
between the two classes.
· SPACING — pivots too close together are the same swing counted
twice; too far apart and market structure has changed between them.
· REGIME FIT — see the next section. Highest-value single filter.
· EXTENSION — distance from the structural moving average, signed
toward the intended trade, in ATR.
· VOLUME — regular divergence wants falling volume on the second
push, which is what exhaustion looks like. Hidden divergence wants
rising volume. Neutral on symbols without volume data.
· HIGHER-TIMEFRAME BIAS — momentum direction on a higher timeframe,
auto-selected from your chart timeframe or set manually.
· MOMENTUM SHIFT — is the histogram already turning at the
confirmation bar, and is the MACD line on the right side of signal.
· ZERO-LINE INTEGRITY — see below.
· BAR STRUCTURE — RSI positioning at the pivot plus the rejection
wick as a proportion of that bar's range.
All ten weights are exposed as inputs. Set any of them to 0 to remove
that factor entirely. The model is auditable, not a black box you have
to take on faith — you can see and change exactly what it rewards.
4 — REGIME AWARENESS
Regular and hidden divergences are opposite trades and fail in opposite
conditions. Regular divergence is mean-reversion and gets destroyed in
strong trends. Hidden divergence is continuation and gets destroyed in
chop. Firing both blindly guarantees you take the wrong one half the
time.
Trend strength is measured by blending Kaufman's Efficiency Ratio (how
straight the path is) with ADX (directional conviction) — two different
questions, deliberately averaged. Direction comes from DMI confirmed by
a structural moving average; when those two disagree the regime is
classified as TRANSITION, which is itself useful information.
The model then scores each divergence class against that measured
regime. Notably, a regular divergence WITH the prevailing trend — a
pullback low that held while momentum improved — is treated as the
highest-quality version of the pattern, while the same structure
against a strong trend is scaled down as the falling-knife trade it is.
5 — GENERALISED ZERO-LINE DISCIPLINE
The classic rule says a bullish divergence should form entirely below
zero. This build extends that: in Strict mode the whole oscillator
segment between both pivots must stay on the correct side of the zero
line, not just the two endpoints. The rule is also correctly inverted
for hidden divergences, which legitimately live on the opposite side of
zero from regular ones. Soft mode checks only the pivot values, and Off
removes the constraint.
════════════════════════════════════════════════════
THE ZERO CENTRE LINE
The pane carries one zero line, drawn as a first-class object rather
than a background hairline, because every threshold in the model is
anchored to it. Above zero is momentum expansion, below is contraction.
It can optionally take its colour from the current regime, giving you
the market state at a glance without reading any numbers. Line width is
adjustable.
════════════════════════════════════════════════════
READING THE OUTPUT
· Solid line between two pivots — regular divergence
· Dashed line — hidden divergence
· Label — direction, grade, and score out of 100
· Dotted line on the price chart — the same divergence mirrored onto
price, so you can see both legs of the structure at once
· Shaded band — adaptive exhaustion envelope at ±N sigma
· Histogram — four-state colouring for expansion and fade above and
below zero
Grades: A+ is 85 and above, A is 75+, B is 65+, C is 55+, D below that.
════════════════════════════════════════════════════
SETTINGS GUIDE
Start with defaults. Minimum Score is 60, which is roughly a B grade.
· Want fewer, higher-conviction signals — raise Minimum Score to 75
or 85. Expect a large drop in signal count. This is the main dial.
· Trading continuation setups — enable Hidden divergences.
· Too few signals on a choppy instrument — set Zero-Line Discipline
to Soft, or reduce Pivot Left/Right.
· Divergences forming against older swings are being missed — raise
Prior Pivots Scanned.
· Instrument has no meaningful volume (many FX feeds) — set the
Volume Confirmation weight to 0 rather than leaving it neutral.
· Want the classic MACD scale back — set Normalization to Raw.
Oscillator MA type is selectable: EMA, SMA, WMA, HMA, DEMA, TEMA,
ZLEMA and KAMA. KAMA adapts its smoothing to the efficiency ratio,
which reduces whipsaw in chop. ZLEMA and TEMA cut lag at the cost of
overshoot.
════════════════════════════════════════════════════
ALERTS
Five alert conditions are provided: regular bullish, regular bearish,
hidden bullish, hidden bearish, and an A+ grade filter that fires only
on scores of 85 or above.
A structured JSON alert is also emitted on every signal, carrying the
symbol, timeframe, signal type, grade, numeric score, regime state,
higher-timeframe bias, price and ATR — suitable for routing to a
webhook.
════════════════════════════════════════════════════
REPAINTING
Signals do not repaint. Pivot confirmation requires the configured
number of bars to the right of the pivot, so a divergence is only
detected after those bars have printed and its position never moves
afterwards. The trade-off is inherent to all pivot-based detection:
the signal is by definition late by that many bars. That is disclosed
rather than hidden.
"Evaluate on bar close only" is enabled by default and prevents the
live-bar score components from flickering intrabar.
════════════════════════════════════════════════════
CREDITS
Based on "MACD Divergences" by @DaviddTech, whose script established
the pivot-comparison structure and the zero-line rule this build starts
from. The divergence detection has been rewritten around a multi-pivot
ledger, and the normalization layer, confluence scoring model, regime
engine and drawing system are new work.
Open source. Use it, read it, change it.
════════════════════════════════════════════════════
DISCLAIMER
This is an analysis tool, not financial advice and not a trading
system. It identifies and grades a chart pattern; it does not tell you
what to buy or sell, and it does not include position sizing, risk
management or exits. A high score means the model's criteria were met,
not that the trade will work. Divergence is a pattern that fails
regularly, and it fails most often exactly where it is most tempting —
against a strong trend.
No indicator predicts the future. Past behaviour of any pattern does
not guarantee future results. Test anything on your own instruments and
timeframes before risking capital, and size positions on the assumption
that any individual signal can be wrong.
════════════════════════════════════════════════════ Indikator

MAHQuant_IND_Divergence_v1.0MAHQuant Divergence for Many Indicators v1.0
A professional multi-indicator divergence detection system with advanced risk management features. This indicator combines powerful divergence scanning across 10+ technical indicators with automated Entry/SL/TP calculation and smart confluence filtering.
✨ Key Features:
1️⃣ Multi-Indicator Divergence Detection:
• Simultaneously scans for divergences across 10+ indicators:
MACD, MACD Histogram, RSI, Stochastic, CCI
Momentum, OBV, VW-MACD, CMF, MFI
Custom external indicator support
• Detects both Regular and Hidden divergences
• Bullish and Bearish divergence identification
• Visual divergence lines with customizable styles
2️⃣ Advanced Risk Management (NEW):
• Automatic SL/TP Calculation
Entry price based on signal candle close
Stop Loss using ATR-based dynamic calculation
Two Take Profit levels (TP1 = 1:1 RR, TP2 = 1:2 RR)
Visual horizontal lines for Entry, SL, TP1, TP2
• Max SL Distance Protection
Configurable maximum stop loss limit (default: 800 points)
Prevents excessive risk in high-volatility conditions
Automatically caps SL if ATR-based distance exceeds limit
3️⃣ Smart Confluence Filter (NEW):
• Option to show signals ONLY when both Regular AND Hidden divergences appear together
• Significantly reduces false signals
• Increases signal reliability and probability
4️⃣ Professional Visualization:
• Signal Label: Shows Entry, SL, TP1, TP2 prices directly on chart
• Auto-Clean Mode: Automatically removes old signal lines to keep chart clean
• Customizable line lengths, colors, and styles
• Pivot point markers (optional)
• Divergence count display
5️ Alert System:
• Built-in alerts for all divergence types
• Separate alerts for Regular Bullish/Bearish
• Separate alerts for Hidden Bullish/Bearish
• Combined positive/negative divergence alerts
⚙️ How to Use:
Basic Setup:
Add indicator to your chart
Select which indicators to scan (MACD, RSI, Stoch, etc.)
Choose divergence type: Regular, Hidden, or Both
Adjust Pivot Period (default: 5) based on your timeframe
Risk Management:
5. Set ATR Length (default: 14) for SL calculation
6. Adjust ATR Multiplier (default: 0.1-1.0) for SL distance
7. Configure Max SL Distance to limit maximum risk
8. Enable "Show SL/TP Lines" to visualize levels
Advanced Filtering:
9. Enable "Show Only Confluence" to filter for highest-probability signals
10. Use "Show Only Last Signal Lines" to keep chart clean
11. Adjust SL/TP Lines Length for visual preference
Trading Strategy:
• Entry: Enter on signal candle close or next candle open
• Stop Loss: Use the calculated SL level (below/above divergence pivot)
• Take Profit 1: Close 50% position at TP1 (1:1 RR)
• Take Profit 2: Close remaining 50% at TP2 (1:2 RR)
📊 Indicator Settings Explained:
• Pivot Period: Number of bars for pivot detection (higher = fewer but stronger signals)
• Source for Pivots: Use Close or High/Low for pivot calculation
• Divergence Type: Regular (reversal), Hidden (continuation), or Both
• Min Number of Divergence: Filter out weak signals (show only if X+ divergences detected)
• Max Pivot Points to Check: How far back to search for divergences
• ATR Multiplier: Higher = wider SL, lower = tighter SL
• Max SL Distance: Maximum allowed SL in points (prevents excessive risk)
🎯 Best Practices:
✅ Use on higher timeframes (1H, 4H, Daily) for more reliable signals
✅ Combine with trend analysis and support/resistance levels
✅ Enable Confluence filter for higher probability setups
✅ Always use proper position sizing and risk management
✅ Backtest on your preferred market before live trading
⚠️ Important Notes:
• This indicator provides signals based on divergence detection
• Not all signals will be profitable - always use stop loss
• Market conditions affect divergence reliability
• Past performance does not guarantee future results
• This is a tool to assist your analysis, not a standalone trading system
Credits & Acknowledgment:
• Original divergence detection logic inspired by LonesomeTheBlue's open-source "Divergence for Many Indicators v4" indicator
• Enhanced with professional risk management features, SL/TP automation, and confluence filtering by MAHQuant Trading System
• Thank you to the TradingView community for open-source collaboration and continuous learning
⚠️ Disclaimer:
This script is for educational and informational purposes only. It does not constitute financial, investment, or trading advice. The author is not responsible for any losses incurred from using this indicator. Past performance is not indicative of future results. Always conduct your own research and manage your risk appropriately. Trade at your own risk. Indikator

MACD Momentum Phase & Acceleration ObservatoryMACD Momentum Phase & Acceleration Observatory is a current-chart momentum research indicator that extends the familiar MACD line, Signal line, and Histogram into a structured view of separation, expansion, contraction, equilibrium, relative magnitude, and crossover-cycle behavior.
The script is designed for users who want to study how MACD momentum changes rather than rely only on a line crossover. It is a descriptive context tool. It does not generate Buy or Sell instructions, predict future price movement, estimate win rate, or manage risk.
WHAT IT SHOWS
- A configurable MACD line, Signal line, and state-colored Histogram.
- Five descriptive momentum phases.
- A noise-aware expansion and contraction model.
- An adaptive Near Equilibrium state with separate entry and exit boundaries.
- Three display scales: Raw MACD, Percent of Slow Average, and ATR Units.
- A robust rolling Histogram magnitude score.
- A subdued-to-reactivated magnitude sequence.
- Cross-cycle peak retention.
- MACD path efficiency.
- A compact or detailed context readout.
- Optional factual event markers and alert conditions.
WHY THIS IS MORE THAN A STANDARD MACD
A standard MACD primarily shows the relationship between a fast moving average, a slow moving average, and a smoothed Signal line. This script keeps that familiar structure, but its main contribution is a coordinated lifecycle model built around the MACD Histogram.
The distinguishing design consists of:
- separating the raw analytical engine from display normalization;
- classifying the Histogram into five momentum phases;
- filtering small expansion/contraction changes with an adaptive noise deadband;
- reducing equilibrium-boundary flapping with entry/exit hysteresis;
- measuring relative Histogram magnitude with rank-based methods;
- tracking reactivation after a sustained subdued sequence;
- measuring how much Histogram separation remains inside the active crossover cycle; and
- measuring whether the MACD path has been direct or rotational over a selected lookback.
These components are designed to describe different parts of one MACD separation lifecycle. They are not independent indicators combined without a shared purpose.
CORE MACD ENGINE
The raw calculations are:
Raw MACD = Fast Moving Average - Slow Moving Average
Raw Signal = Moving Average of Raw MACD
Raw Histogram = Raw MACD - Raw Signal
The Fast, Slow, and Signal calculations can each use one of the following moving-average methods:
- EMA
- SMA
- RMA
- WMA
- HMA
The source and all lengths are configurable. Fast Length must remain lower than Slow Length. If the configuration is invalid or the selected scale is unavailable, the context readout reports the condition instead of presenting a normal Ready state.
RAW ANALYTICAL CORE AND DISPLAY SCALE
The analytical state is calculated from the raw MACD structure. Display normalization is handled separately.
Available display modes are:
Raw MACD
Shows the MACD components in their native chart-price units.
Percent of Slow Average
Divides MACD, Signal, and Histogram by one percent of the absolute Slow Average value.
ATR Units
Divides MACD, Signal, and Histogram by the current ATR value using the selected ATR length.
The same positive divisor is applied to all three displayed components on each bar. More importantly, crossover events, zero crossings, phase classification, magnitude scoring, path efficiency, and cycle retention are calculated from the raw series. Changing the display mode therefore changes the visual unit, but it does not rewrite the underlying analytical event history.
FIVE-STATE MOMENTUM PHASE MODEL
The Histogram is classified into five descriptive states:
Positive Expansion
The raw Histogram is above zero and its absolute magnitude is expanding beyond the adaptive noise deadband.
Positive Contraction
The raw Histogram is above zero and its absolute magnitude is contracting.
Negative Expansion
The raw Histogram is below zero and its absolute magnitude is expanding.
Negative Contraction
The raw Histogram is below zero and its absolute magnitude is contracting.
Near Equilibrium
The absolute raw Histogram is inside the adaptive equilibrium boundary.
Expansion and contraction are based on the smoothed one-bar change in absolute Histogram magnitude. The script also estimates ordinary recent one-bar magnitude movement. That estimate creates an adaptive deadband. When the current magnitude change is too small to distinguish clearly from recent noise, the prior motion state is retained instead of forcing another Expansion/Contraction switch.
ADAPTIVE EQUILIBRIUM WITH HYSTERESIS
The equilibrium entry boundary is calculated from an EMA of the absolute raw Histogram multiplied by the Equilibrium Band Multiplier.
Once Near Equilibrium is active, the exit boundary is wider than the entry boundary:
Exit Boundary = Entry Boundary x Equilibrium Exit Hysteresis
Using separate entry and exit boundaries reduces rapid state changes when the Histogram repeatedly moves just above and below one threshold.
HISTOGRAM ACCELERATION
Histogram Acceleration is the smoothed one-bar change of the Histogram. The detailed readout can display the current value and direction. Optional acceleration-turn markers and alerts identify factual zero crossings in the raw acceleration measure.
The acceleration value shown in the readout follows the selected display unit. The five-state phase model remains based on the raw Histogram structure.
ROBUST HISTOGRAM MAGNITUDE SCORE
The Magnitude field measures the current absolute raw Histogram relative to its own recent history. It is bounded from 0 to 100 and offers three methods:
Percent Rank
Ranks the current absolute Histogram among observations in the selected lookback. This method is less dominated by one isolated extreme value.
Range Rank
Locates the current absolute Histogram between the rolling minimum and rolling maximum.
Hybrid Rank
Combines 65 percent Percent Rank with 35 percent Range Rank. This is the default method.
The score is classified as:
- Subdued
- Typical
- Extended
These labels describe relative recent magnitude only. They are not probabilities, confidence levels, overbought/oversold signals, or forecasts.
MAGNITUDE REACTIVATION
Magnitude Reactivation is a stateful sequence, not a directional trade signal.
The sequence works as follows:
1. The Magnitude score remains at or below the Subdued threshold for at least the selected Minimum Subdued Bars.
2. The reactivation condition becomes armed.
3. A reactivation event is recorded when the score reaches the Magnitude Reactivation threshold.
The default visual marker is a small yellow dot at the top of the pane. It indicates that relative Histogram magnitude has re-emerged after a sustained subdued sequence. It does not specify bullish or bearish direction.
CROSS-CYCLE PEAK RETENTION
A cross cycle begins whenever the raw MACD line crosses the raw Signal line.
During the active cycle, the script records the largest absolute raw Histogram magnitude. Cross-Cycle Peak Retention is calculated as:
Current Absolute Histogram / Active-Cycle Peak Absolute Histogram x 100
A value near 100 means the current separation is near the largest separation recorded in that crossover cycle. A lower value means more of that cycle's peak separation has contracted. This measurement is descriptive and does not determine whether price will continue or reverse.
MACD PATH EFFICIENCY
MACD Path Efficiency compares the net displacement of the raw MACD line with the total distance traveled by the raw MACD line over the selected lookback:
Absolute Net MACD Displacement / Sum of Absolute One-Bar MACD Changes x 100
A higher value describes a more direct MACD path. A lower value describes a more rotational or back-and-forth path. It is not a measure of profitability, trend quality, or future reliability.
CONTEXT READOUT
The Context Readout can be disabled or shown in Compact or Detailed mode.
Compact mode shows:
- Phase
- Location relative to zero
- Histogram value
- Magnitude score and state
- Configuration status
Detailed mode additionally shows:
- Histogram Acceleration
- Phase Age
- Bars in the active cross cycle and Peak Retention
- MACD Path Efficiency
- Confirmed or Live bar status
The table position, text size, header size, background, border, and row presentation are configurable.
VISUAL DESIGN
The default palette separates the line family from the Histogram family:
- MACD line: ice white
- Signal line: electric blue
- Positive Expansion: bright green
- Positive Contraction: teal
- Negative Expansion: magenta
- Negative Contraction: orange
- Near Equilibrium: vivid purple
- Magnitude Reactivation: yellow
The Histogram uses a depth layer and a narrower core layer. The MACD and Signal lines can use optional glow and separation fill. The adaptive equilibrium band, zero guide, phase rail, and background tint can be enabled or disabled independently.
EVENT MARKERS AND ALERTS
Default factual markers are:
- a small upward arrow at the pane bottom when MACD crosses above Signal;
- a small downward arrow at the pane top when MACD crosses below Signal; and
- a small yellow dot at the pane top when Magnitude Reactivation occurs.
Optional markers are available for:
- Histogram Acceleration turning positive or negative; and
- MACD crossing above or below zero.
Alert conditions are available for the same events and for each phase transition. These events describe calculated state changes. They are not trade-entry or trade-exit recommendations.
REALTIME AND CONFIRMED-BAR BEHAVIOR
Confirmed Bars Only is enabled by default.
With the default setting:
- markers and alert conditions trigger after the chart bar closes;
- stateful Magnitude Reactivation updates are committed on confirmed realtime bars; and
- the committed cross-cycle peak is updated on confirmed realtime bars.
The MACD lines, Histogram, phase display, and context readout can still change while the current bar is forming because their inputs change with live price. This is normal realtime behavior. Users who disable Confirmed Bars Only intentionally allow intrabar events, which can change before the bar closes.
The script uses the current chart timeframe only. It does not request another symbol or timeframe, use lookahead, access future data, or apply a future plot offset.
HOW TO USE THE INDICATOR
1. Start with Location and Phase.
Location shows whether raw MACD is above or below zero. Phase shows whether Histogram magnitude is expanding, contracting, or near equilibrium.
2. Add Magnitude context.
Use Subdued, Typical, and Extended as rolling relative-magnitude descriptions. Do not interpret them as probabilities.
3. Observe reactivation after subdued conditions.
A yellow dot identifies a transition from a sustained subdued sequence to a higher relative magnitude. Read its direction from the Histogram sign and phase, not from the dot itself.
4. Use Detailed mode for lifecycle context.
Phase Age shows duration. Cross-Cycle Peak Retention shows how much separation remains relative to the active cycle peak. Path Efficiency shows whether the MACD path has been direct or rotational.
5. Select a suitable display unit.
Raw MACD preserves native units. Percent of Slow Average and ATR Units can make the pane easier to read on symbols with different price or volatility scales. Analytical states remain based on raw MACD.
DEFAULT CONFIGURATION
The default core uses 12-period EMA, 26-period EMA, and a 9-period EMA Signal line with Close as the source.
The default research settings use:
- Raw MACD display
- 3-bar acceleration smoothing
- 8-bar phase-noise estimation
- 0.25 phase-noise multiplier
- 34-bar adaptive equilibrium basis
- 0.28 equilibrium entry multiplier
- 1.25 equilibrium exit hysteresis
- 120-bar Hybrid Magnitude Rank
- 20 / 35 / 80 Subdued, Reactivation, and Extended thresholds
- 3 Minimum Subdued Bars
- 20-bar MACD Path Efficiency
- Compact Context Readout
- Confirmed Bars Only enabled
The defaults are general starting points, not optimized settings for a specific symbol or timeframe.
LIMITATIONS
- MACD is derived from moving averages and therefore contains lag.
- Expansion, contraction, equilibrium, magnitude, retention, and efficiency describe the current and historical calculation state; they do not forecast price.
- Results depend on the selected source, moving-average methods, lengths, smoothing, lookbacks, and thresholds.
- Rank-based measurements are relative to a rolling window and can change as old observations leave that window.
- Frequent MACD/Signal crossings create shorter cross cycles and can make Peak Retention change quickly.
- Low-liquidity symbols, gaps, abrupt price changes, and very short timeframes can produce rapid state transitions.
- The open bar remains fluid until it closes.
- The script does not include position sizing, stop placement, targets, backtesting, or risk management.
Use the indicator as one transparent source of momentum context alongside independent price analysis and risk controls. Indikator

VWAP-MACD with Volume ConfirmationVWAP-MACD with Volume Confirmation
VWAP-MACD+ replaces the price series inside a classic MACD calculation with an anchored VWAP series, then adds a volume-strength filter so that crossover signals are only flagged as "confirmed" when they occur on above-average volume. The result is a momentum oscillator that reflects shifts in the volume-weighted average price rather than raw closing price, with a built-in sanity check against low-conviction crosses.
How it works
Anchored VWAP — VWAP is calculated from hlc3 * volume, accumulated and reset at the start of each new period based on the selected anchor (Session, Week, or Month). This is the same anchoring logic as TradingView's native VWAP, just computed manually so it can feed into the MACD below.
VWAP-based MACD — instead of EMA-ing close like a standard MACD, this script EMAs the VWAP series itself (fast length default 12, slow length default 26). The difference between the fast and slow EMAs of VWAP is the MACD line; a further EMA of that (default 9) is the signal line; their difference is the histogram. Because VWAP is smoother and volume-weighted, the resulting MACD reacts to shifts in the "fair value" price rather than every tick of noise in the close.
Volume Momentum Filter — each bar's volume is compared to its moving average (default 20-period SMA) to get a relative volume ratio. Bars are classified as strong (≥1.5x average), weak (<0.75x average), or normal, and the histogram's color intensity reflects this — brighter columns mean the current move is backed by stronger volume, faded columns mean it's on thin volume.
Volume-Confirmed Crossovers — a standard MACD/signal-line crossover only becomes a plotted "confirmed" signal when relative volume is at or above average (≥1.0x). This is meant to filter out crossovers that happen on quiet, low-conviction bars.
Reading the indicator
Blue line — VWAP-based MACD line.
Orange line — signal line (EMA of the MACD line).
Histogram columns — MACD minus signal, colored green above zero / red below zero, with intensity scaled by relative volume (bright = strong volume, faded = weak volume, mid = normal).
Green up-triangle — bullish crossover confirmed by volume.
Red down-triangle — bearish crossover confirmed by volume.
Zero line — dashed gray reference; crosses of the MACD line through zero can also be used as a secondary trend-context read, though this script's plotted signals are specifically the signal-line crossovers.
Suggested use
This is a trend/momentum tool built around volume-weighted price rather than raw close, intended for:
Traders who already use VWAP as an intraday or swing fair-value reference and want a momentum oscillator derived from that same series instead of close price
Filtering out MACD crossovers that occur on low-volume, low-conviction bars by relying on the "confirmed" triangle markers rather than every raw crossover
Combining with the anchor period that matches your trading horizon — Session for intraday, Week or Month for swing/position context
As with any momentum oscillator, it works best alongside broader trend or structure context (e.g., higher-timeframe trend, support/resistance) rather than as a standalone signal — volume confirmation reduces noise but doesn't guarantee follow-through.
Inputs
Fast Length / Slow Length / Signal Smoothing — EMA lengths for the VWAP-MACD calculation
VWAP Anchor Period — Session, Week, or Month
Volume MA Lookback — averaging period for the relative volume filter
Enable Volume Confirmation Shading — toggles both the histogram's volume-based color intensity and the volume requirement on confirmed crossover signals
Alerts
Two alert conditions are built in:
VWAP-MACD Bullish Cross (Vol Confirmed)
VWAP-MACD Bearish Cross (Vol Confirmed) Indikator

MACD Trend Phase MTF by [Itto Ryu]# MACD Trend Phase MTF by — User Manual (Publication Version)
---
## 1 · Purpose
This indicator answers one question: **"Where are we in the trend lifecycle?"** — not merely "has MACD crossed yet?"
A single MACD can only describe momentum state; it cannot describe trend *phase*, because phase emerges from the relationship between multiple timeframes. This script reads a PPO-normalized MACD across three time layers — a slow timeframe sets the regime, a mid timeframe defines the phase, and the chart timeframe tracks entry timing — then outputs an instantly readable phase name, a multi-timeframe dashboard, and a weighted consensus verdict (MAJOR).
Because everything is normalized to percentages, it works on any market and any symbol: index futures, stocks, crypto, or forex.
## 2 · Methodology
**Engine — PPO (Percentage Price Oscillator):**
```
PPO = (EMA(close,12) − EMA(close,26)) / EMA(close,26) × 100
Signal = EMA(PPO, 9)
Hist = PPO − Signal
```
PPO is used instead of raw MACD so thresholds stay constant across markets and across years (raw MACD is denominated in price units and cannot be compared across symbols).
**Phase state machine (computed on the Phase TF, default 4H):** each timeframe uses only three features:
1. **Regime** — PPO above/below zero
2. **Impulse** — PPO above/below its signal line
3. **Leg-peak memory** — is the latest impulse leg's PPO peak lower than the previous leg's peak? (structural momentum divergence)
Combined with the slow-TF regime, this yields 9 phases:
| Phase | Condition | Meaning |
|---|---|---|
| ESTABLISHED BULL | Slow bull + mid bull + impulse up | Fully aligned uptrend |
| BULL PULLBACK | Mid bull + impulse down + peaks not declining | Correction inside an uptrend — a classic continuation setup |
| WEAKENING BULL | Mid bull + impulse down + lower peaks | Late-stage uptrend — momentum thinning |
| EMERGING BULL | Mid bull but slow TF not yet bull | New trend, not yet confirmed |
| TRANSITION / CHOP | \|PPO\| < chop threshold | No phase — directionless market |
| (4 BEAR phases = mirror) | | BEAR RALLY = the mirror continuation setup |
**Anti-flicker:** the committed phase changes only after the new raw phase persists for N chart bars (default 2) — hysteresis prevents flickering.
**Timing signal:** when the phase is a pullback phase and the chart-TF histogram inflects back in the trend direction (`hist > hist ` after falling, or the mirror), a ▲/▼ triangle prints on the price chart. The idea: the higher timeframe defines *where* momentum entries make conceptual sense; the chart timeframe shows *when* the counter-move is fading.
**MAJOR consensus:** each grid TF scores its phase (Established ±1.0, Pullback ±0.75, Emerging ±0.5, Weakening ±0.25, Chop 0), weighted by timeframe (default 30m×1, 1H×1.5, 4H×2, D×3) → summed into a net % → |net| ≥ 20% = LONG/SHORT lean, ≥ 50% = strong. This is a structured way of reading multi-timeframe agreement at a glance — higher timeframes get louder votes.
## 3 · Defaults (Inputs)
| Input | Default | Rationale |
|---|---|---|
| Regime TF | D | Slowest layer; only its zero-line side is used |
| Phase TF | 240 (4H) | Phase-defining layer — roughly 4–6× the chart TF works well |
| Fast / Slow / Signal | 12 / 26 / 9 | Standard values, identical on every TF — deliberately untuned |
| Chop threshold | 0.10% | \|PPO\| below this = directionless market |
| Phase confirm bars | 2 | Hysteresis against phase flicker |
| Grid TFs | 30m / 1H / 4H / D | Dashboard rows |
| Weights | 1 / 1.5 / 2 / 3 | Higher timeframes get louder votes |
| Major bias / Strong | 20% / 50% | Verdict thresholds |
| Dashboard size | Middle | Tiny / Middle / Large |
All defaults are starting points, not optimized values — adjust them to your market and timeframe structure.
## 4 · Visual Elements
| Element | Meaning |
|---|---|
| Histogram columns (pane) | Chart-TF PPO − Signal; solid color = accelerating, faded = fading |
| Blue / orange lines (pane) | Chart-TF PPO / Signal |
| Pane background color | Current phase (green = bull family, red = bear family, orange = weakening, gray = chop) |
| ▲ / ▼ on the price chart | Timing markers — phase-gated momentum inflections |
| TF grid table | Phase per timeframe + ● dot in the L / S / H column |
| MAJOR row | Weighted consensus verdict + net % |
| Timing row | Timing status ("wait" / "TIMING NOW") |
| ⚠ row | Warns when chart TF ≥ Phase TF (view a lower TF, e.g. 1H) |
## 5 · Who This Is For / NOT For
**For:** traders studying trend-pullback structure who execute manually and use indicators as context filters; anyone who wants a one-glance answer to "is this market trending, correcting, weakening, or going nowhere?"
**NOT for:** scalpers far below the phase TF (higher-TF data updates too slowly to matter); anyone expecting a fully automatic buy/sell system (this is decision support, not a bot); extended sideways markets (it will mostly show CHOP — which is the correct reading: no trend phase exists).
## 6 · How to Use (Study Playbook)
1. Open the chart one or more steps **below the Phase TF** (e.g. 1H chart with a 4H phase TF).
2. Use the background color and phase label as context: trend-following ideas align with ESTABLISHED phases, continuation setups form during PULLBACK / RALLY phases, and WEAKENING or CHOP suggest standing aside.
3. Check the **MAJOR** row — study how often lower and higher timeframes agree before strong moves, and how disagreement resolves.
4. The ▲/▼ triangles mark where a counter-trend swing's momentum fades *while the higher timeframe still points with the trend* — the classic pullback-entry concept. Observe how these behave on your market before acting on any of them.
5. Momentum-inflection signals are, by nature, short-horizon events — they describe the next swing, not the next month. Re-evaluate whenever the phase changes.
6. Alerts: alert dialog → Condition = "MACD Phase" → choose "Phase changed", "Major bias changed", "Long timing" or "Short timing" → recommended trigger **Once per bar close**.
7. WEAKENING is best studied as a position-management state (momentum thinning), not a reversal signal.
## 7 · Common Mistakes
- ❌ Treating ESTABLISHED phases as entry signals — by the time everything is aligned, much of the move has often happened; the pullback phases are where continuation logic actually applies.
- ❌ Taking every triangle in both directions on every market — different markets have different structural drifts; study each side's behavior on your instrument first.
- ❌ Expecting momentum-inflection signals to define long swings — their information decays quickly.
- ❌ Viewing on a chart TF larger than the Phase TF (the ⚠ row will warn you).
- ❌ Reading MAJOR % as a probability — it is a weighted vote score (a structured prior), not a measured probability.
- ❌ Changing several inputs at once — you lose track of what actually changed the behavior.
## 8 · For Educational Purposes Only
This indicator is published **for educational purposes only**. It is a tool for studying how momentum, trend phase, and multi-timeframe structure interact — it is **not** a trading system, does not generate financial advice, and makes **no claim of profitability**. No performance figures are stated or implied; past behavior of any signal, on any market, does not guarantee future results. Before risking real capital on any concept illustrated here, do your own testing on your own market, timeframe, and cost structure, and consult a licensed financial professional where appropriate. You alone are responsible for your trading decisions.
## 9 · Disclosure Block
- **Pine version:** v6
- **Repaint:** NO on closed bars — every HTF value uses only fully closed bars (`security(expr , lookahead_on)` idiom); historical bars are never redrawn. Note: current-bar table values and signals update until the bar closes — use alerts set to "Once per bar close".
- **Chart type:** standard candles only (no Heikin Ashi / Renko / Range — synthetic prices distort PPO).
- **Originality:** fully original code — the phase state machine, leg-peak memory, and weighted MTF consensus were written from scratch, not adapted from any open-source script.
- **This indicator is create for educational purposes only — not investment advice or recommendation or professional advice, you are on your own risk **
---
Indikator

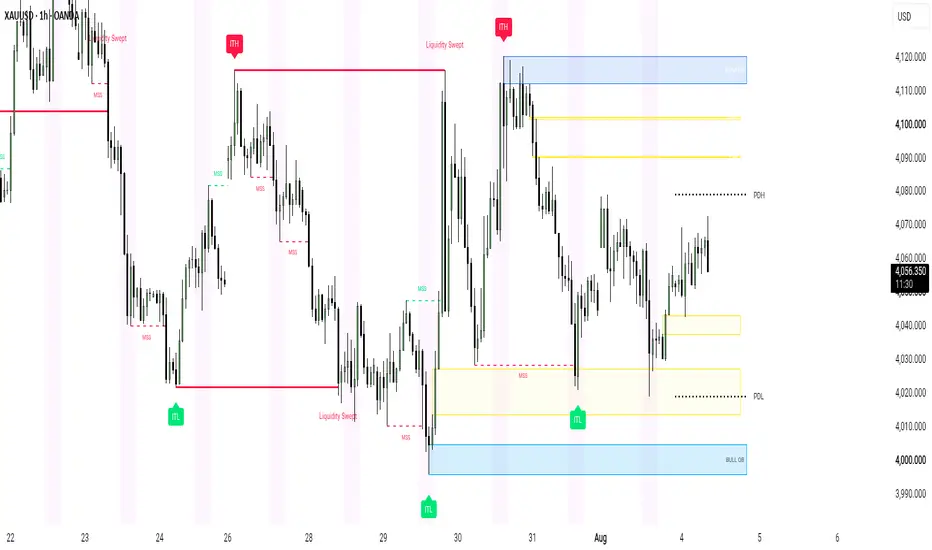
ICT Smart Money Execution Engine PROICT Smart Money Execution Engine PRO
ICT Smart Money Execution Engine PRO is an advanced, high precision technical analysis tool designed for traders practicing Inner Circle Trader and Smart Money Concepts methodologies. It automatically maps structural context, liquidity sweeps, macro price extremes, and key session windows while keeping your charting environment ultra clean.
Key Features Overview
1. Intermediate Term Highs and Lows Badge Labels
Identifies major market turning points with distinct solid badge style labels. Intermediate Term Highs are clearly displayed with red ITH badges above swing points, and Intermediate Term Lows are displayed with green ITL badges below swing points.
2. Auto Mitigating Previous Day High and Low
Projects active daily boundaries on your chart. To prevent visual clutter, Previous Day High and Previous Day Low lines automatically delete as soon as price touches or mitigates them.
3. Red Line Termination Liquidity Sweeps
Tracks high probability liquidity pools sitting above swing highs and below swing lows. When price sweeps liquidity, a solid 2x width red line connects the original swing point directly to the sweeping candle wick, terminating instantly with a clear Liquidity Swept label.
4. Dynamic Auto Mitigating Fair Value Gaps
Automatically identifies bullish and bearish price imbalances across all timeframes. Unmitigated FVG boxes dynamically clean up and vanish as soon as price returns to fill them.
5. Volume Validated Order Blocks
Detects key institutional order block zones using a customizable 50 bar lookback by default. Zones remain active until price firmly closes beyond their boundaries.
6. Clean New York Session Highlight
Provides a single, ultra light background overlay specifically for the New York Session window, eliminating the distraction of multiple overlapping global sessions.
7. Market Structure Shift Detection
Tracks momentum reversals in real time by drawing clean dashed structure lines and MSS labels when key structural pivots are broken by candle closes.
How to Use
Step 1: Determine Macro Bias
Use the red ITH and green ITL badges to locate institutional swing extremes and understand the broader market trend.
Step 2: Focus on New York Session
Analyze price action during the highlighted New York Session window when market volume and institutional volatility are highest.
Step 3: Identify Liquidity Sweeps
Watch for price to sweep an active Previous Day High, Previous Day Low, or recent swing level marked by the bold red Liquidity Swept line.
Step 4: Execute on Structural Confirmation
Wait for a Market Structure Shift signal following a liquidity sweep, then evaluate entries on retaps into active Order Blocks or Fair Value Gaps.
Settings Overview
ITH / ITL Settings
- Show ITH / ITL Badge Labels: Toggle visibility of intermediate swing badges.
- Lookback Sensitivity Length: Adjust pivot lookback sensitivity for detecting macro highs and lows.
- Colors: Customization options for ITH and ITL badge background colors.
Previous Day High and Low Settings
- Show Active PDH / PDL: Toggle display of auto disappearing daily levels.
- Line Width and Style: Choose between solid, dotted, or dashed line styles and adjust thickness.
Fair Value Gap Settings
- Show Active FVGs: Toggle dynamic imbalance box visibility.
- FVG Transparency: Adjust fill opacity for bullish and bearish boxes.
Order Block Settings
- OB Lookback Length: Customize the pivot length used for order block detection (default is set to 50).
Liquidity Sweep Settings
- Show Liquidity Sweeps: Toggle sweep lines and labels.
- Sweep Line Color: Customize the color of the 2x width sweep termination line.
Session Settings
- Show Only New York Session: Toggle visibility of the session background highlight.
- NY Session Window: Set exact session hours to match your local or UTC-4/5 preferences.
Disclaimer
This script is built strictly for educational, analytical, and charting enhancement purposes. It does not provide financial advice, automated trading signals, trade management, or guaranteed results. Trading financial markets involves substantial risk of capital loss. Always perform your own analysis and practice strict risk management.
Indikator

DNSE VN301!, MACD Cross Strategy"MACD Trend Following with SMA Trend Filter" is a momentum-based trend-following strategy designed to capture directional market moves as momentum begins to strengthen. The strategy uses the MACD indicator, with its standard parameters of Fast EMA(12), Slow EMA(26), and Signal EMA(9), to identify bullish signals when the MACD line crosses above the signal line and bearish signals when it crosses below.
To improve signal quality, the strategy incorporates an optional SMA(200) trend filter, allowing Long trades only when the SMA is rising and Short trades only when it is falling. By combining MACD momentum crossovers with long-term trend confirmation, the strategy seeks to reduce false signals during sideways market conditions while participating in sustained intraday trends. It also includes configurable stop loss, take profit, trading session filters, and automatic end-of-day position closure for disciplined risk management.
Strategy settings and configuration:
Chart timeframe: recommended 5-minute chart
Position size: 3 contracts
MACD fast length: 12
MACD slow length: 26
MACD signal length: 9
SMA length: 200
Stop loss: 10 points
Take profit: 30 points
SMA trend filter: On / Off
Take profit: On / Off
Time filter: On / Off
Trading session: 09:00 – 14:30
Trade direction: Long / Short / Both
Default script settings:
The strategy uses MACD(12,26,9). The MACD line is calculated from the difference between EMA(12) and EMA(26). The Signal line is the EMA(9) of the MACD line.
When MACD crosses above the Signal line, bullish momentum may be taking control. When MACD crosses below the Signal line, bearish momentum may be taking control.
When the SMA(200) trend filter is enabled, the script only allows Long trades when SMA(200) is rising and only allows Short trades when SMA(200) is falling. When the SMA filter is disabled, the strategy can trade both directions based only on MACD crossover signals.
Users can add the built-in MACD indicator on TradingView with settings 12, 26, 9 and source close to visually monitor the signal below the price chart.
Entry and exit rules:
Long entry:
MACD(12,26,9) crosses above the Signal line
AND SMA(200) is rising, if the SMA filter is enabled
AND the signal appears during the trading session
AND trade direction allows Long entries
Long exit:
Stop loss: 10 points from entry price
Take profit: 30 points from entry price, if enabled
MACD crosses below the Signal line
Reversal when a valid Short signal appears
Automatic position close at the end of the trading session
Short entry:
MACD(12,26,9) crosses below the Signal line
AND SMA(200) is falling, if the SMA filter is enabled
AND the signal appears during the trading session
AND trade direction allows Short entries
Short exit:
Stop loss: 10 points from entry price
Take profit: 30 points from entry price, if enabled
MACD crosses above the Signal line
Reversal when a valid Long signal appears
Automatic position close at the end of the trading session
Risk disclaimer:
Futures trading involves a high level of risk and prices can move sharply. This script is provided for reference, research, and backtesting purposes only. Users should fully understand derivatives trading, their own risk tolerance, and the strategy logic before applying it to live trading.
All investment decisions are the responsibility of the user. phaisinh.online is not responsible for any losses arising from the use of this strategy in real trading. Past performance does not guarantee future results.
___________________________________________________________________
"MACD Trend Following với Bộ lọc Xu hướng SMA" là một chiến lược giao dịch theo xu hướng dựa trên động lượng, được thiết kế nhằm nắm bắt các biến động giá theo một hướng khi động lượng thị trường bắt đầu gia tăng. Chiến lược sử dụng chỉ báo MACD với các tham số tiêu chuẩn gồm Fast EMA(12), Slow EMA(26) và Signal EMA(9) để xác định tín hiệu mua khi đường MACD cắt lên trên đường tín hiệu, và tín hiệu bán khi đường MACD cắt xuống dưới đường tín hiệu.
Để nâng cao chất lượng tín hiệu, chiến lược tích hợp bộ lọc xu hướng SMA(200) (có thể bật hoặc tắt), chỉ cho phép mở vị thế Long khi SMA đang dốc lên và vị thế Short khi SMA đang dốc xuống. Bằng cách kết hợp tín hiệu giao cắt động lượng của MACD với xác nhận xu hướng dài hạn, chiến lược hướng tới việc giảm thiểu các tín hiệu nhiễu trong giai đoạn thị trường đi ngang, đồng thời tận dụng các xu hướng intraday kéo dài. Ngoài ra, chiến lược còn bao gồm các tùy chọn Stop Loss, Take Profit, bộ lọc khung thời gian giao dịch, và cơ chế tự động đóng toàn bộ vị thế khi kết thúc phiên, nhằm đảm bảo quản trị rủi ro một cách chặt chẽ và có kỷ luật.
Cài đặt & cấu hình chiến lược:
Biểu đồ: khuyến nghị khung 5 phút
Khối lượng giao dịch: 3 hợp đồng
Chu kỳ nhanh MACD: 12
Chu kỳ chậm MACD: 26
Chu kỳ tín hiệu MACD: 9
Chu kỳ SMA: 200
Cắt lỗ: 10 điểm
Chốt lời: 30 điểm
Bộ lọc xu hướng SMA: Bật / Tắt
Dùng chốt lời: Bật / Tắt
Bộ lọc giờ: Bật / Tắt
Khung giờ giao dịch: 09:00 – 14:30
Chiều giao dịch: Mua / Bán / Cả hai
Cài đặt mặc định của script:
Chiến lược sử dụng MACD(12,26,9), trong đó đường MACD được tính từ chênh lệch giữa EMA(12) và EMA(26). Đường Signal là EMA(9) của chính đường MACD.
Khi MACD cắt lên đường Signal, động lượng tăng có thể đang chiếm ưu thế. Khi MACD cắt xuống đường Signal, động lượng giảm có thể đang chiếm ưu thế.
Khi bật bộ lọc xu hướng SMA(200), script chỉ cho phép lệnh Mua khi SMA(200) dốc lên và chỉ cho phép lệnh Bán khi SMA(200) dốc xuống. Khi tắt bộ lọc SMA, chiến lược có thể giao dịch cả hai chiều chỉ dựa trên tín hiệu giao cắt MACD.
Người dùng có thể thêm chỉ báo MACD có sẵn trên TradingView với tham số 12, 26, 9 và nguồn close để quan sát tín hiệu trực quan bên dưới biểu đồ giá.
Điều kiện vào và thoát lệnh:
Vào lệnh Mua:
MACD(12,26,9) cắt lên đường Signal
VÀ SMA(200) dốc lên, nếu bật bộ lọc SMA
VÀ tín hiệu xuất hiện trong khung giờ giao dịch
VÀ chiều giao dịch cho phép lệnh Mua
Thoát lệnh Mua:
Cắt lỗ: 10 điểm từ giá vào lệnh
Chốt lời: 30 điểm từ giá vào lệnh, nếu bật
MACD cắt xuống đường Signal
Đảo chiều khi xuất hiện tín hiệu Bán hợp lệ
Tự động đóng lệnh khi hết khung giờ giao dịch
Vào lệnh Bán:
MACD(12,26,9) cắt xuống đường Signal
VÀ SMA(200) dốc xuống, nếu bật bộ lọc SMA
VÀ tín hiệu xuất hiện trong khung giờ giao dịch
VÀ chiều giao dịch cho phép lệnh Bán
Thoát lệnh Bán:
Cắt lỗ: 10 điểm từ giá vào lệnh
Chốt lời: 30 điểm từ giá vào lệnh, nếu bật
MACD cắt lên đường Signal
Đảo chiều khi xuất hiện tín hiệu Mua hợp lệ
Tự động đóng lệnh khi hết khung giờ giao dịch
Tuyên bố rủi ro:
Giao dịch hợp đồng tương lai có mức độ rủi ro cao và giá có thể biến động mạnh. Script này chỉ phục vụ mục đích tham khảo, nghiên cứu và kiểm thử. Người dùng cần hiểu rõ giao dịch phái sinh, khẩu vị rủi ro cá nhân và logic của chiến lược trước khi áp dụng vào giao dịch thực tế.
Mọi quyết định đầu tư thuộc trách nhiệm của người dùng. phaisinh.online không chịu trách nhiệm cho bất kỳ khoản lỗ nào phát sinh từ việc sử dụng chiến lược này trong giao dịch thực tế. Hiệu quả trong quá khứ không đảm bảo kết quả trong tương lai.
Strategie

MACD with HTF Panels [theUltimator5]This indicator uses the standard MACD signal and displays it on multiple timeframes off to the side of the chart as separate panels. It allows you to view up to 5 (current + 4) separate timeframes at once without changing the chart timeframe.
The core of this indicator is a normal MACD. Line, signal, and histogram, fully adjustable lengths, four-way histogram coloring based on sign and slope so you can read momentum shifts at a glance.
Alongside it, the indicator draws up to four independent higher-timeframe panels directly in the pane. Each panel is a self-contained mini-chart: recent candles (if enabled) plus that timeframe's own MACD line, signal, and histogram.
The default settings show (4) HTF panels, that are automatically set based on what the current chart timeframe is. The HTF panels can be manually adjusted as desired.
The number of HTF panels can be adjusted between 0 and 4. 0 panels is set by disabling the "Show HTF panels" option in the settings. Disabling the HTF panels simply makes this indicator appear as a standard MACD, which isn't unique and can probably be found in 1000 other indicators elsewhere.
The uniqueness comes from the HTF panels on the side.
The panels settings will match for all timeframes.
When there are between 1 and 3 HTF panels enabled, they will appear vertically stacked on each other.
The following image shows (3) panels stacked.
When 4 panels (default) is selected, the stack is 2x2.
The chart price candles can be enabled in the settings to show the candles overlaid on the MACD signals for a complete picture. These are disabled by default to reduce visual clutter.
Here is an image showing (4) panels with chart candles enabled within the panels.
The scaling and position of the panels can be adjusted in the settings.
The vertical scaling is based on ATR, so the height of the candles is always proportional to the chart itself.
The horizontal position is calculated in bars, so it can be shifted left or right relative to the current bar.
Finally, there is a table (default position = bottom right)
The table shows the values of the MACD, Signal, and Histogram for all (4) HTF panels. The table position and size can be modified, but it will always show all (4) HTF panel values. If you have only one HTF panel enabled, it will still show you all values. The Histogram column changes color based on the color of the HTF histogram for that timeframe to give a better visual representation of the signal.
This indicator was made to showcase the method for converting custom signals into HTF side panels for custom and complex indicators. The logic used in this indicator can be used on any plotting indicator to display the signals off to the side. Indikator
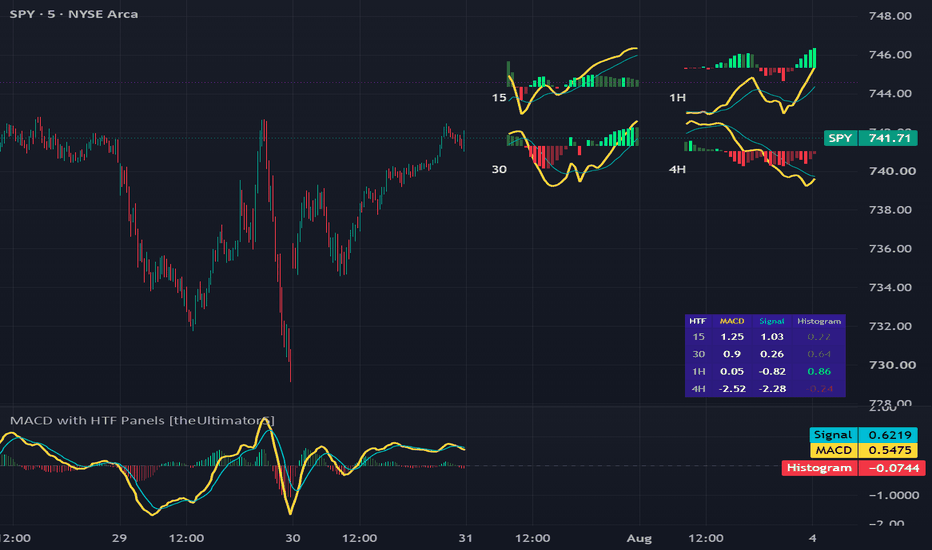
Zero-Lag MACD Divergence Pro Zero-Lag MACD Divergence Pro is a MACD-family oscillator that reduces the indicator's inherent lag using zero-lag exponential averaging, detects regular divergences directly inside the MACD pane, and optionally gates its buy/sell markers so they only appear when a divergence and a crossover confirm each other. It is designed for intraday timeframes but works on any chart.
What makes it original
This is not a standard MACD with cosmetic changes. Three elements work as one system: (1) all three components — fast line, slow line, and signal line — are rebuilt on zero-lag EMAs rather than standard EMAs, (2) divergence detection runs on the zero-lag MACD line itself and draws its lines and labels inside the oscillator pane, with an optional mirrored dashed line on the price chart, and (3) a combo-gating mode suppresses crossover markers unless a divergence was confirmed within a recent, user-defined window, which filters the many insignificant crossovers a MACD produces in ranging markets.
How it works
Zero-Lag Core: Each component uses the zero-lag EMA construction (2 × EMA − EMA of EMA), a public-domain technique attributed to John Ehlers' error-correction work. This roughly halves the effective lag of each average, so crossovers occur earlier than on a classic MACD. A faded classic MACD line can be displayed for side-by-side comparison and switched off in the settings.
Divergence Detection: Confirmed pivot highs/lows on the zero-lag MACD line are compared with price highs/lows at the same bars. A regular bullish divergence (price lower low, MACD higher low) or regular bearish divergence (price higher high, MACD lower high) draws a connecting line between the two MACD pivots with a label in the pane. Pivots confirm only after the lookback period elapses, so divergence lines appear with a delay by design and do not repaint.
Combo Signals: In the default mode, a buy/sell marker prints on the price chart only when a zero-lag crossover occurs while a same-direction divergence is still valid (within a user-defined number of bars). Turning combo mode off prints markers on every confirmed crossover instead. Signals respect a cooldown and a daily maximum.
Four-Color Histogram: The histogram distinguishes rising and fading momentum on both sides of the zero line.
Dashboard: A dark, movable panel (styled to stay readable on light-theme charts) summarizes MACD state, histogram direction, active divergence, zero-line position, and the day's signal count.
How to use it
Add the indicator to a lower-timeframe chart (5–15 min for intraday use). Watch for a divergence label in the pane, then wait for the crossover marker that confirms it — the combo mode automates exactly this sequence. The zero-line row on the dashboard helps grade signals: bullish setups above the zero line and bearish setups below it occur in the direction of the broader momentum. All lengths, the divergence window, signal limits, colors, and dashboard placement are adjustable.
Limitations
Divergence lines appear only after pivots confirm (default 5 bars), so they are visible later than the pivot itself; this is the unavoidable cost of non-repainting detection. Reduced lag also means the zero-lag lines are more sensitive than a classic MACD and can produce more crossovers in choppy conditions — the combo mode exists to filter these. This tool describes momentum conditions; it does not predict future price movement, and past behavior of any signal does not guarantee future results. Always combine with your own analysis and risk management. Indikator

Indikator

MACD Market Stage + Hybrid Divergence - TP## MACD Market Stage + Hybrid Divergence
This indicator is a customized version of the classic **MACD** concept commonly available on TradingView. Credit goes to TradingView and the original MACD indicator framework. This version adds simple table readings, momentum stages, custom histogram colors, and optional divergence lines to make MACD easier to interpret at a glance.
The goal of this tool is not to predict the future, but to help traders better understand the current momentum condition of the market.
## What This Indicator Shows
This indicator displays:
MACD line
Signal line
MACD histogram
Momentum reading table
Market stage reading
Optional bullish and bearish divergence lines
The histogram colors help show whether momentum is increasing or fading.
## How To Read It
When the histogram is above zero and growing, bullish momentum is expanding.
When the histogram is above zero but shrinking, bullish momentum is weakening.
When the histogram is below zero and moving lower, bearish momentum is expanding.
When the histogram is below zero but improving, bearish momentum is weakening.
## Table Readings
The table summarizes the MACD condition in simple terms.
**Signal** shows whether bullish or bearish momentum is currently leading.
**Market Stage** shows the broader momentum phase.
**Stage Bias** gives a plain-language interpretation of the current stage.
## Market Stages
**Stage 1 Momentum Base**
Bearish momentum is weakening and the market may be trying to recover.
**Stage 2 Bullish Momentum Expansion**
Bullish momentum is strengthening and buyers are currently leading.
**Stage 3 Momentum Distribution**
Bullish momentum is still present, but it is starting to fade.
**Stage 4 Bearish Momentum Expansion**
Bearish momentum is strengthening and sellers are currently leading.
**Market Transition**
Momentum is mixed or unclear.
## Divergence
The optional divergence feature compares price action with the MACD line.
A **bullish divergence** may appear when price makes a lower low, but MACD makes a higher low.
A **bearish divergence** may appear when price makes a higher high, but MACD makes a lower high.
Divergence should not be used alone. It is best used together with price structure, support and resistance, trend, and risk management.
## How To Use
Use this indicator to quickly check whether momentum is expanding, weakening, or transitioning.
It may be useful for:
Confirming trend momentum
Spotting possible momentum weakness
Reading MACD conditions faster
Finding possible divergence areas
Supporting a broader trading plan
## Important Note
This indicator is for educational and informational purposes only. It does not provide financial advice, buy signals, or sell signals. No indicator can guarantee future results. Always use proper risk management and your own analysis before making trading decisions.
Indikator

Indikator

Divergence Hunter [Proozac]# Divergence Hunter — RSI · MACD · OBV
**Pine Script v5 — Overlay Indicator**
---
## What It Does
Scans three oscillators simultaneously — RSI, MACD, and OBV — and draws labelled lines directly on the price chart whenever a divergence is detected between price action and oscillator momentum.
Two divergence types are covered per oscillator:
- **Regular divergence** — signals a potential trend reversal
- **Hidden divergence** — signals a potential trend continuation
---
## Divergence Types Explained
### Regular Bullish Divergence
```
Price: Lower Low (LL)
Oscillator: Higher Low (HL)
Signal: Potential reversal UP
```
Price is making lower lows but the oscillator is making higher lows — sellers are losing momentum. The downtrend is weakening.
### Regular Bearish Divergence
```
Price: Higher High (HH)
Oscillator: Lower High (LH)
Signal: Potential reversal DOWN
```
Price is making higher highs but the oscillator is making lower highs — buyers are losing momentum. The uptrend is weakening.
### Hidden Bullish Divergence
```
Price: Higher Low (HL) ← trend is up
Oscillator: Lower Low (LL)
Signal: Continuation UP
```
Price holds higher lows (uptrend structure intact) while the oscillator dips lower — a temporary oscillator pullback during a healthy uptrend. A continuation signal.
### Hidden Bearish Divergence
```
Price: Lower High (LH) ← trend is down
Oscillator: Higher High (HH)
Signal: Continuation DOWN
```
Price is making lower highs (downtrend structure intact) while the oscillator makes higher highs — a temporary oscillator bounce during a healthy downtrend.
---
## The Three Oscillators
| Oscillator | What it measures | Why it diverges |
|-----------|-----------------|-----------------|
| **RSI** | Relative momentum of closes | Classic divergence tool — very reliable at extremes |
| **MACD** | Trend + momentum combined | Useful in trending markets, less noise than RSI |
| **OBV** | Cumulative volume flow | Measures whether volume confirms the price move |
Each oscillator runs through the same `detect_divs()` function. You can enable or disable each one independently. When multiple oscillators show the same divergence simultaneously, that is a high-conviction signal.
---
## Detection Logic
The indicator uses `ta.pivothigh` and `ta.pivotlow` on the **price** series to find swing points, then reads the **oscillator value at that same bar** to compare:
```
For each new pivot high in price:
Compare price level vs previous pivot high price
Compare oscillator vs previous pivot high oscillator
→ Regular Bear: price HH + osc LH
→ Hidden Bear: price LH + osc HH
For each new pivot low in price:
Compare price level vs previous pivot low price
Compare oscillator vs previous pivot low oscillator
→ Regular Bull: price LL + osc HL
→ Hidden Bull: price HL + osc LL
```
When detected, a **line** is drawn connecting the two price pivot points and a **label** marks the divergence type and oscillator name.
---
## Inputs
| Input | Default | Description |
|-------|---------|-------------|
| **RSI Divergence** | true | Enable RSI divergence scanning |
| **RSI Length** | 14 | RSI calculation period |
| **MACD Divergence** | true | Enable MACD line divergence scanning |
| **MACD Fast** | 12 | MACD fast EMA length |
| **MACD Slow** | 26 | MACD slow EMA length |
| **MACD Signal** | 9 | MACD signal line length |
| **OBV Divergence** | true | Enable OBV divergence scanning |
| **Pivot Lookback (left bars)** | 5 | Bars to the left required to confirm a swing point |
| **Pivot Lookback (right bars)** | 5 | Bars to the right required to confirm a swing point |
| **Show Hidden Divergences** | true | Toggle hidden divergence lines on/off |
| **Bullish Regular** | Bright green | Line/label color for regular bullish divergences |
| **Bearish Regular** | Bright red | Line/label color for regular bearish divergences |
| **Bullish Hidden** | Faded green | Line/label color for hidden bullish divergences |
| **Bearish Hidden** | Faded red | Line/label color for hidden bearish divergences |
---
## Visual Output
| Element | Meaning |
|---------|---------|
| Solid bright green line + label `"RSI Bull Div"` | Regular bullish divergence on RSI |
| Solid bright red line + label `"RSI Bear Div"` | Regular bearish divergence on RSI |
| Dashed faded green line + label `"RSI Hid Bull"` | Hidden bullish divergence on RSI |
| Dashed faded red line + label `"RSI Hid Bear"` | Hidden bearish divergence on RSI |
| Same patterns with `"MACD"` or `"OBV"` prefix | Divergence from that oscillator |
| Green background flash | Any bullish regular divergence firing |
| Red background flash | Any bearish regular divergence firing |
Lines connect the **two price swing points** that form the divergence, making it immediately clear which highs or lows are being compared.
---
## How to Use
**Entry logic:**
- Regular divergence → look for a reversal entry after the divergence confirms (pivot right bars have closed).
- Hidden divergence → look for a continuation entry in the direction of the main trend.
- Always wait for the pivot to fully confirm — the signal appears `pivot_rb` bars after the actual swing point.
**Confluence filter:**
A divergence is most reliable when:
1. Two or more oscillators show the same divergence simultaneously
2. Price is at a key structural level (support/resistance, Order Block, session high/low)
3. The MTF Dashboard (indicator 02 in this suite) confirms the higher timeframe trend
**Reducing noise:**
- Increase `Pivot Lookback` (left/right bars) to 8–10 for cleaner, less frequent signals
- Disable OBV if trading Forex (OBV is volume-dependent and FX volume data is tick-based)
- Disable hidden divergences if you only want reversal signals
---
## Configuration Tips
| Scenario | Recommended settings |
|----------|---------------------|
| Fast scalping (1–5m) | Pivot: 3/3, RSI only |
| Day trading (15m–1H) | Pivot: 5/5, RSI + MACD |
| Swing trading (4H–D) | Pivot: 8/8, all three oscillators |
| Crypto (high volatility) | Pivot: 7/7 to filter noise |
---
## Alerts
Two built-in `alertcondition` entries:
- `Bullish Divergence` — fires when any enabled oscillator confirms a regular bullish divergence
- `Bearish Divergence` — fires when any enabled oscillator confirms a regular bearish divergence
Set up in TradingView: Alerts → Condition → Divergence Hunter → select the desired condition.
Indikator

MTF MA & MACD & StochRSI (pro)Multi-Timeframe MA & MACD & StochRSI (Pro)
The Multi-Timeframe MA & MACD & StochRSI (Pro) is a professional multi-timeframe confluence dashboard built to help traders quickly identify trend direction, momentum strength, and cross-timeframe alignment in one clean visual layout.
This tool combines Moving Averages, MACD logic, and StochRSI cross conditions across multiple timeframes, allowing traders to reduce chart clutter and improve decision-making without constantly switching between charts.
Designed for traders who rely on confluence, top-down analysis, and momentum confirmation.
Core Purpose
This indicator answers one key trading question:
Are my moving averages, momentum, and oscillator signals aligned across multiple timeframes?
By tracking multiple confirmations together, traders can identify stronger trend setups while filtering weaker or conflicting market conditions.
Multi-Timeframe Dashboard
The dashboard scans and displays data across:
1 Minute
5 Minute
15 Minute
1 Hour
4 Hour
1 Day
1 Week
This provides both short-term and higher-timeframe market alignment.
Core Features
1) Multi-Timeframe Moving Average Analysis
The indicator tracks:
20 EMA
50 EMA
For each timeframe it checks whether price is:
Above EMA → Bullish bias
Below EMA → Bearish bias
This gives a quick directional read of market structure.
2) MACD Confirmation Logic (Enhanced)
Unlike a basic MACD crossover, this version uses stricter logic for stronger confirmation.
Buy Condition
Histogram > 0
MACD Line > 0
Signal Line > 0
Sell Condition
Histogram ≤ 0
MACD Line ≤ 0
Signal Line ≤ 0
Neutral
If momentum is mixed, the dashboard displays Neutral.
This helps remove weaker crossover noise and improves momentum quality.
3) StochRSI Cross Confirmation
The dashboard tracks StochRSI cross alignment using:
RSI calculation
Stochastic range
Smoothed %K line
Smoothed %D line
Buy
%K > %D
Sell
%K < %D
Neutral
Flat or undefined conditions
This adds momentum confirmation beyond moving averages.
4) Non-Repainting Multi-Timeframe Logic
The script uses stable request.security() calls with completed timeframe bars to reduce repainting behaviour and improve consistency.
Useful for traders who want cleaner higher-timeframe confirmation.
5) On-Chart Moving Average Overlay
In addition to the dashboard, the indicator plots:
Current timeframe 20 EMA
Current timeframe 50 EMA
These allow traders to visually track trend support/resistance directly on price.
6) Weekly MA Overlay
Optional higher-timeframe moving averages can also be shown directly on the active chart:
Weekly 20 EMA
Weekly 50 EMA
This helps identify:
Macro trend direction
Dynamic support/resistance
Higher timeframe bias
Confluence zones
Can be toggled ON/OFF in settings.
7) Adjustable Table Text Size
The dashboard supports text scaling for cleaner viewing:
Tiny
Small
Normal
Large
Huge
Useful for different monitor sizes and chart layouts.
Colour Logic
Green
Bullish / Buy
Price above EMA
Positive MACD alignment
StochRSI Buy condition
Red
Bearish / Sell
Price below EMA
Negative MACD alignment
StochRSI Sell condition
Grey
Neutral / Mixed
No strong directional bias
This allows fast visual scanning across all timeframes.
Best Used For
This indicator is ideal for:
Multi-timeframe trend analysis
Momentum confirmation
Confluence trading
Swing trading
Intraday trading
Scalping
Breakout confirmation
Trend-following systems
Works well on:
Crypto
Forex
Indices
Stocks
Commodities
How to Use It
Step 1 – Check EMA Alignment
Look for price above or below the 20 and 50 EMA across multiple timeframes.
Step 2 – Confirm MACD Strength
Check whether MACD is fully aligned (not just crossing).
Step 3 – Confirm StochRSI Direction
Look for %K vs %D agreement.
Step 4 – Find Confluence
The strongest setups often occur when:
MA structure aligns
MACD aligns
StochRSI aligns
Higher timeframe bias supports the trade
Trading Framework Example
A strong bullish setup might show:
Price above 20 EMA
Price above 50 EMA
MACD Buy
StochRSI Buy
Weekly MA acting as support
A strong bearish setup may show the inverse.
Summary
Multi-Timeframe MA & MACD & StochRSI (Pro) is a high-confluence dashboard built for traders who want cleaner multi-timeframe trend analysis, stronger momentum confirmation, and faster market alignment in one professional workflow. Indikator

MACD & Stoch RSI Confluence S/RMACD & Stoch RSI Confluence S/R
MACD & Stoch RSI Confluence S/R draws horizontal support and resistance
levels from MACD and Stochastic RSI crossover points, then automatically
merges levels that cluster close together into a single confluence zone.
Instead of treating every crossover as an isolated signal, it highlights
the price areas where two independent momentum oscillators historically
agreed on a turning point.
━━━━━━━━━━━━━━━━━━━━━━━━━━━━━━━━
BACKGROUND — WHY CROSSOVER-BASED LEVELS?
━━━━━━━━━━━━━━━━━━━━━━━━━━━━━━━━
MACD and Stochastic RSI are both momentum oscillators, but they measure
momentum differently — MACD from the relationship between two EMAs,
Stochastic RSI from the position of RSI within its own recent range.
Because of this difference, the two oscillators don't always cross at the
same time or the same price, but when they do cross near the same price
level, it suggests that two independent calculations both detected a
shift in momentum at that point.
Traditional crossover indicators only mark the moment of the crossover
itself and then move on — the price level where it happened is rarely
preserved or revisited. This indicator instead treats every crossover
price as a potential support or resistance level going forward, on the
logic that price has already shown a reaction (a momentum shift) at that
level once, and may do so again if it returns there.
━━━━━━━━━━━━━━━━━━━━━━━━━━━━━━━━
HOW IT WORKS — TECHNICAL DETAIL
━━━━━━━━━━━━━━━━━━━━━━━━━━━━━━━━
CROSSOVER DETECTION
The indicator calculates a standard MACD (fast EMA, slow EMA, signal line)
and a standard Stochastic RSI (RSI smoothed through a Stochastic
calculation, then K/D smoothing) independently. Bullish crossovers occur
when MACD crosses above its signal line, or when Stochastic RSI's K line
crosses above its D line. Bearish crossovers are the inverse.
Each time a valid crossover occurs, the indicator looks back a
user-defined number of bars (How many bars before crossover?) and records
the low of that bar for bullish crossovers, or the high for bearish
crossovers. This offset exists because the actual turning point in price
often occurs slightly before the oscillator confirms it — anchoring the
line to the prior bar's extreme captures the reaction point more
accurately than the bar where the crossover is technically confirmed.
PROXIMITY FILTERING (PER OSCILLATOR)
Before a new level is recorded, it's checked against existing levels from
the same oscillator and same direction using an ATR-based distance
threshold. If a new crossover price falls too close to an already-recorded
level, it's discarded. This prevents a single trending move that triggers
several crossovers in quick succession from flooding the chart with
near-identical lines.
CONFLUENCE MERGING (ACROSS OSCILLATORS)
After proximity filtering, all surviving levels from both oscillators —
MACD support, MACD resistance, Stoch RSI support, Stoch RSI resistance —
are pooled together. Any levels within a percentage threshold of each
other are merged into a single line, positioned at their average price.
The merged line is labeled with the count of crossovers that contributed
to it, so a label showing "⬡3" indicates three separate crossover events —
potentially from different oscillators — all landed within the merge
threshold of one another.
This merge threshold is calculated automatically based on the chart's
timeframe: wider on higher timeframes (where price ranges are naturally
larger) and tighter on lower timeframes. A manual override is available if
you prefer a fixed percentage regardless of timeframe.
DYNAMIC COLORING
Every line — merged or single — is colored based on its position relative
to the current close. A line below price is colored as support; a line
above price is colored as resistance. Because lines extend forward in
time, a single line can change from resistance to support (or vice versa)
as price crosses through it, and the color updates automatically.
━━━━━━━━━━━━━━━━━━━━━━━━━━━━━━━━
INFO TABLE
━━━━━━━━━━━━━━━━━━━━━━━━━━━━━━━━
A table in the corner of your choice displays, for the most recent bar:
— The number of support and resistance lines currently shown for each
oscillator separately
— The nearest support and nearest resistance level to current price,
calculated from the same merged lines drawn on the chart — not a
separate calculation, so the table always matches what you see
— Whether the MACD zero-line filter and Stoch RSI overbought/oversold
filter are currently active
— Whether each oscillator is enabled
— The current merge threshold percentage and whether it was set
automatically or manually
━━━━━━━━━━━━━━━━━━━━━━━━━━━━━━━━
HOW TO USE
━━━━━━━━━━━━━━━━━━━━━━━━━━━━━━━━
1. CHOOSE WHICH OSCILLATORS TO USE
Both MACD and Stochastic RSI are enabled by default. You can disable
either one independently if you only want levels from a single
oscillator, or run both for confluence.
2. SET THE BAR OFFSET
How many bars before crossover? controls how far back from the
confirmed crossover the indicator anchors the level. Start with the
default and increase it if you find levels are consistently anchored
slightly too late relative to the actual price reaction.
3. TUNE THE PROXIMITY FILTER
The ATR Multiplier controls how close a new crossover has to be to an
existing level of the same type before it's discarded. Increase this on
choppy assets to reduce clutter; decrease it if you feel valid levels
are being filtered out.
4. APPLY OPTIONAL FILTERS IF NEEDED
The MACD Zero Line Filter restricts bullish crossovers to above the
zero line and bearish crossovers to below it, filtering out weaker
signals that occur against the broader momentum direction. The Stoch
RSI Overbought/Oversold Filter restricts crossovers to occur only in
oversold or overbought territory, focusing on reversal-type signals
rather than mid-range noise. Both are off by default — enable them if
you want fewer, more selective levels.
5. ADJUST THE MERGE THRESHOLD IF NEEDED
The automatic threshold works well across most timeframes, but if you
trade a single timeframe consistently and want more control, switch to
Manual Threshold and set a fixed percentage that matches your
instrument's typical price behavior.
6. READ THE LABELS
Single-oscillator lines are labeled "M" (MACD) or "S" (Stoch RSI).
Merged lines are labeled with a count (e.g. "⬡2", "⬡3") showing how many
crossovers — and potentially how many different oscillators — agreed on
that level. Higher counts represent stronger confluence.
━━━━━━━━━━━━━━━━━━━━━━━━━━━━━━━━
WHERE TO USE IT
━━━━━━━━━━━━━━━━━━━━━━━━━━━━━━━━
The indicator works on any asset class and any timeframe, since both
oscillators and the merge threshold are calculated directly from the
chart you have open. It's particularly useful for:
— Identifying support/resistance levels that are backed by momentum
shifts rather than purely price-action-based pivots
— Spotting confluence zones where MACD and Stoch RSI crossovers
historically aligned, which may carry more weight than a level
identified by either oscillator alone
— Confirming reactions at prior turning points — if price returns to a
level where a crossover previously occurred, the level provides context
for whether momentum may shift again
— Combining with other structure or volume-based tools as part of a
broader confluence-based approach, rather than as a standalone signal
generator
━━━━━━━━━━━━━━━━━━━━━━━━━━━━━━━━
SETTINGS REFERENCE
━━━━━━━━━━━━━━━━━━━━━━━━━━━━━━━━
MACD: Fast/Slow/Signal EMA lengths, source, bar offset, max support/
resistance lines kept, line width, colors, extend mode, ATR-based
proximity filter, zero-line filter
Stochastic RSI: RSI period, Stochastic period, K/D smoothing, source, and
the same set of line/extend/proximity/zone options as MACD
Merging: enable/disable, automatic or manual threshold, merged line color
and width
Table: show/hide, position
━━━━━━━━━━━━━━━━━━━━━━━━━━━━━━━━
ORIGINALITY
━━━━━━━━━━━━━━━━━━━━━━━━━━━━━━━━
MACD and Stochastic RSI crossovers are both well-established concepts
individually, but this script's specific contribution is treating
crossover prices as persistent support/resistance levels rather than
one-off signals, combined with a cross-oscillator confluence merge that
identifies where two independently-calculated momentum tools agreed on
the same price area. The ATR-based proximity filter and timeframe-adaptive
merge threshold are the author's own approach to keeping this practical
and readable on a live chart rather than producing chart clutter.
━━━━━━━━━━━━━━━━━━━━━━━━━━━━━━━━
DISCLAIMER
━━━━━━━━━━━━━━━━━━━━━━━━━━━━━━━━
This indicator is intended for educational and analytical purposes only.
No indicator can predict future market movements with certainty. Always
use proper risk management and combine multiple forms of analysis before
making trading decisions. Indikator

EMA MACD Trend Decision TableEMA MACD Decision Table v6
This Pine Script v6 overlay indicator summarizes trend, momentum, volume, higher-timeframe context, and ATR-based planning levels into one decision table.
The indicator uses EMA 9, EMA 21, EMA 50, EMA 100, EMA 200, MACD, RSI, ADX / DMI, volume confirmation, optional higher-timeframe EMA trend, and ATR risk planning.
It produces a numeric decision score on every bar. Bullish confirmations add points, bearish confirmations subtract points, and the final score is converted into Strong Buy, Buy, Neutral, Sell, or Strong Sell.
BUY labels appear only when the score first reaches Strong Buy territory. SELL labels appear only when the score first reaches Strong Sell territory.
This tool is designed for chart context and planning. It is not financial advice and does not guarantee trade results.
Scoring Logic
Condition | Score
--- | ---
EMA 9 above EMA 21 and price above EMA 50 | +2
EMA 9 below EMA 21 and price below EMA 50 | -2
Price above EMA 200 | +1
Price below EMA 200 | -1
MACD above signal and histogram above 0 | +2
MACD below signal and histogram below 0 | -2
MACD bullish crossover | +1
MACD bearish crossover | -1
RSI above 55 | +1
RSI below 45 | -1
ADX above threshold and +DI above -DI | +1
ADX above threshold and -DI above +DI | -1
Volume above average and candle closes above open | +1
Volume above average and candle closes below open | -1
Higher-timeframe close above its EMA when enabled | +1
Higher-timeframe close below its EMA when enabled | -1
Decision Output
Score Range | Decision
--- | ---
>= 5 | Strong Buy
2 to 4 | Buy
-1 to 1 | Neutral
-2 to -4 | Sell
<= -5 | Strong Sell
Decision Table Rows
Row | What It Shows | How To Read It
--- | --- | ---
Decision | Final decision and total score | Main summary of bullish, bearish, or mixed confirmation
Last Price | Latest close and price direction | Shows current price context
Bar Change | Close-to-close change and percent change | Positive is above prior close, negative is below prior close
O / H / L | Current open, high, and low | Shows current candle range
EMA 9 / EMA 21 | Short-term EMA relationship | EMA 9 above EMA 21 is bullish, below is bearish
EMA 50 / EMA 200 | Medium and long trend context | Price above EMA 200 supports bullish trend, below supports bearish trend
MACD | MACD state and histogram | Bullish when MACD is above signal and histogram is positive
RSI | RSI state and value | Above 55 bullish, below 45 bearish, above 70 overbought, below 30 oversold
ADX / DMI | Trend strength and direction | Strong +DI lead is bullish, strong -DI lead is bearish
Volume | Volume confirmation | Above-average bullish candle confirms buyers; bearish candle confirms sellers
HTF Trend | Optional higher-timeframe EMA trend | Bullish above HTF EMA, bearish below, Off when disabled
ATR | Current Average True Range | Risk planning unit
Long Plan | ATR-based long stop and target | Reference levels only
Short Plan | ATR-based short stop and target | Reference levels only
Candle Color Meaning
Score Range | Meaning | Candle Color
--- | --- | ---
>= 5 | Strong Buy | Lime
2 to 4 | Buy | Green
-1 to 1 | Neutral | Normal chart color
-2 to -4 | Sell | Maroon
<= -5 | Strong Sell | Red
ATR Planning Formulas
Plan | Formula
--- | ---
Long stop | close - ATR * stop multiplier
Long target | close + (close - long stop) * reward/risk
Short stop | close + ATR * stop multiplier
Short target | close - (short stop - close) * reward/risk
Data Window Values
Code | Meaning
--- | ---
2 | Strong Buy
1 | Buy
0 | Neutral
-1 | Sell
-2 | Strong Sell
Alert Logic
The script includes alerts for Strong Buy Decision, Strong Sell Decision, MACD Bullish Cross, and MACD Bearish Cross.
Strong decision alerts trigger when the score enters strong buy or strong sell territory. MACD alerts are based only on MACD line and signal line crossovers.
Reading The Output
Green output means bullish confirmations are stronger.
Red output means bearish confirmations are stronger.
Gray output means conditions are mixed or neutral.
The decision score is strongest when trend, momentum, volume, and higher-timeframe direction all agree.
Indikator

EFI & MACD Advanced Pro
Indicator Synopsis: EFI & MACD Advanced Pro
This custom TradingView indicator—created for Simon20cent—is a dual-momentum confirmation filter designed to isolate high-probability trend phases by synchronising a volume-weighted oscillator with a trend-following moving average cross.
It strips away chart noise by compressing two distinct indicator panels into a single, highly scannable visual pane.
Core Components & Logic
The system monitors the interaction between two classic technical metrics:
1. Elder’s Force Index (EFI): Measures the directional power of a move by multiplying price change by volume. It determines whether buyers or sellers dominate the volume profile (Value > 0 or < 0).
2. MACD vs. Signal Line: Tracks classic moving average momentum. A bullish state is triggered when the fast MACD line crosses above the slow Signal line (MACD > Signal).
Visual Matrix (How to Read the Pane)
The indicator renders exclusively as a zero-anchored Column Chart, utilizing four distinct conditions:
* 🟩 Bright Green Column (+1.0): Full Bullish Alignment. The EFI is above zero and accelerating upward, while the MACD line is securely above its signal line.
* 🟥 Bright Red Column (-1.0): Full Bearish Alignment. The EFI is below zero and accelerating downward, while the MACD line is securely below its signal line.
* 🟦 Light Blue Column (+0.5): Divergence / Market Out of Alignment. The indicators do not agree, but the EFI remains positive (>0), suggesting weak bullish underlying volume.
* 📘 Dark Navy Column (-0.5): Divergence / Market Out of Alignment. The indicators do not agree, but the EFI remains negative (<0), suggesting weak bearish underlying volume.
Advanced Institutional Features
* Momentum Grading (Two-Tone Gradients): The columns automatically shift to a darker shade of green or red if structural momentum begins to flatten, providing an early structural warning before a trend formally breaks.
* Trend Exhaustion Alerts (Orange Triangles): Small orange triangles automatically print above or below the columns the exact moment a strong green or red streak loses velocity, marking ideal profit-taking windows.
* Integrated Alert Engine: Features pre-built Pine Script hooks for Bullish Alignment, Bearish Alignment, and Trend Exhaustion, allowing you to link the indicator directly to TradingView phone push notifications or email alerts.
🟢 Long Exit Warning (Orange Triangle pointing Downward)
This prints at the top of the pane (+1.1) to signal it is time to scale out or close a long position. It triggers when you are in a valid long streak (Green columns), but the very next bar suffers a breakdown in power:
* The Math: The indicator checks if Elder's Force Index (EFI) starts falling compared to the previous bar, OR if the MACD Line slips back below the Signal Line.
* The Meaning: Buyers are running out of breath. Even though price might still be hovering near the highs, the volume-weighted power (EFI) is dropping, meaning institutional buying pressure has dried up.
🔴 Short Exit Warning (Orange Triangle pointing Upward)
This prints at the bottom of the pane (-1.1) to signal it is time to cover your short position. It triggers when you are in a valid short streak (Red columns), but seller momentum hits exhaustion:
* The Math: The indicator checks if EFI starts rising (climbing back toward zero), OR if the MACD Line crosses back above the Signal Line.
* The Meaning: Sellers are exhausted. The downward volume is thinning out, and profit-taking by larger players is likely about to cause a bullish bounce or a prolonged squeeze.
💡 Trading Strategy Tip
Do not use these orange triangles to open new trades. Treat them strictly as protective exit signals. When you see one appear while you are in profit, it means the high-velocity phase of that specific wave has ended, and the indicator is about to print unaligned blue columns.
Indikator

Momentum Conviction [HermesCore]WHAT THIS INDICATOR DOES
Momentum Conviction watches two things at the same moment: where price momentum turns, and how much agreement stands behind that turn. The turn is an EMA crossover — the fast EMA (Exponential Moving Average) crossing the slow one — but only when the MACD histogram (Moving Average Convergence Divergence, a standard momentum gauge) is leaning the same way. A LONG fires when the fast EMA crosses above the slow EMA while MACD momentum is positive; a SHORT is the exact mirror. A cross with no momentum behind it is ignored.
Every signal that does fire is then graded 0 to 5 by a conviction score, built from five independent checks the moment the signal prints. You decide how much conviction you require: show every signal, or raise the minimum and keep only the ones with weight behind them.
WHY IT IS DIFFERENT
Most moving-average tools print an arrow on every cross and leave you to separate the real ones from the noise by eye. My rules are:
A cross is not a signal on its own. It has to happen while MACD momentum agrees. A large share of the crosses that fail are crosses that fired into flat or opposing momentum; gating on the histogram removes them before they ever reach the chart.
The score is a filter, not decoration. It is not a confidence label added after the fact — it is five yes/no facts, known at signal time, summed. Set a minimum and the weak signals never appear.
The higher timeframe gets a vote, not the final word. One of the five points is HTF agreement, so you can weigh it without being ruled by it.
ADX is deliberately excluded. I tested it repeatedly on the charts this was built for and it did not earn a place.
Everything updates on confirmed bars only. No intrabar flicker, no repainting, and the higher-timeframe reads use no look-ahead.
HOW TO READ THE CHART
LONG bubble (green, below the bar) and SHORT bubble (red, above it) mark each qualifying signal. Bubble size is adjustable.
The gradient EMA cloud is aqua when the fast EMA sits above the slow one (uptrend lean) and magenta when below. The slow EMA carries a soft gold glow so the spine of the trend is always easy to find.
A faint background tint colours the whole pane in the trend colour — a peripheral regime cue, nothing to act on by itself.
A faint gold background band shows the previous day's and previous week's range, for context on where price sits inside the larger structure.
THE CONVICTION SCORE
Each check is worth one point, decided at signal time, and never changes afterwards:
Momentum strength — the MACD histogram is larger than its own 50-bar average: the push is bigger than this market's normal push. +1
Slope agreement — the fast EMA is itself moving in the signal's direction, not merely crossing. +1
Higher-timeframe trend — the chosen HTF (4H by default) is trending the same way; its price and 50/200 EMAs agree. +1
Not over-extended — price is within a set ATR (Average True Range, a volatility measure) distance of the slow EMA, so you are not entering after the move has already run. +1
RSI room — RSI (Relative Strength Index, 0–100) is not already at an extreme in the signal's direction; there is room left to travel. +1
Five of five is a cross with bigger-than-normal momentum, sloping the right way, aligned with the higher timeframe, entered near value, with room to run. Zero is a bare cross with nothing behind it. The minimum-score input is where you set your own bar.
HOW I USE IT
The defaults are deliberately fast (EMA 2/12) — a low-timeframe, many-signals setting. Slow the lengths down for swing work and you get fewer, heavier signals.
I treat a high-score signal that agrees with the higher timeframe as the one worth acting on, and a low-score signal as information about the tape rather than a trade. The honest part: this is trend and momentum logic. It earns its keep when the market trends and gives a good deal of it back in ranges. The regime tint and the HTF vote exist to keep you on the right side of that question, not to solve it — be honest with yourself about which regime you are actually in.
SETTINGS THAT MATTER
EMA fast/slow and MACD lengths — the engine. Defaults are fast; raise them for higher timeframes and fewer, heavier signals.
Minimum score (0) — your conviction bar. 0 shows everything; raise it to thin the chart to signals with agreement behind them.
Higher timeframe (4H) — the trend you check against. Match it to your horizon.
Max distance to slow EMA (2.0 ATR) — how far from value still counts as "not over-extended."
RSI overbought/oversold (72/28) — the "room left" thresholds.
Each score component can be switched off individually if you want to see what it contributes on its own.
ALERTS
Momentum Conviction LONG and Momentum Conviction SHORT, both firing on the confirmed close of the signal bar, with ticker and timeframe in the message.
CALCULATION DETAILS
All logic evaluates on confirmed bars. A signal cannot appear or disappear inside a forming candle.
The trigger is the fast/slow EMA cross; the gate is the sign of the MACD histogram on the same close.
The higher-timeframe trend uses that timeframe's prior-bar close and 50/200 EMAs, requested with no look-ahead, so it does not repaint.
The conviction score is computed once, at signal time, from the values listed above.
HONEST LIMITATIONS
This is trend-following momentum. In a range it will cross back and forth and hand gains back; no filter removes that, it only thins it.
The score is a hypothesis about signal quality, not a measured edge. This indicator does not keep score for you. If you want to know whether higher scores actually perform better on your symbol, run the matching strategy version in the Strategy Tester with realistic costs and read the result yourself.
The defaults trade often. On a live account, slippage and spread on frequent entries matter more than the chart suggests — cost everything before you believe anything.
Signals are evaluated at the close; real fills happen later and worse. Treat the chart as the ideal case.
It runs on any symbol and timeframe, but "runs" is not "has an edge" — whether it works on your market is yours to verify. Past behaviour is not the next signal.
Not financial advice. It manages no positions and places no orders.
ORIGINALITY
The ingredients — EMA crosses, MACD, RSI, ATR — are as old as charting. The momentum-gated trigger, the five-factor conviction score and its use as a hard filter, the regime-aware visual language and the non-repaint construction are my own work in Pine v6. Every value the script uses is recomputable from the rules above.
Questions and suggestions are welcome in the comments. Enjoy. Indikator