Volume-Weighted RSI with HMA SmoothingThis script combines a Volume-Weighted RSI, smoothed with a custom Hull Moving Average (HMA), with a modified MACD based on normalized net volume.
Volume-Weighted RSI: It is calculated by adjusting the closing price with a normalized On-Balance Volume (OBV) and then applying an RSI. This approach weights the RSI according to volume, providing a more accurate measure of the strength of the price movement.
Modified HMA: A Hull Moving Average (HMA) is used to smooth the Volume-Weighted RSI, enhancing the ability to identify market trend changes.
Possible Reversal from Oversold:
The Volume-Weighted RSI crosses above the oversold level.
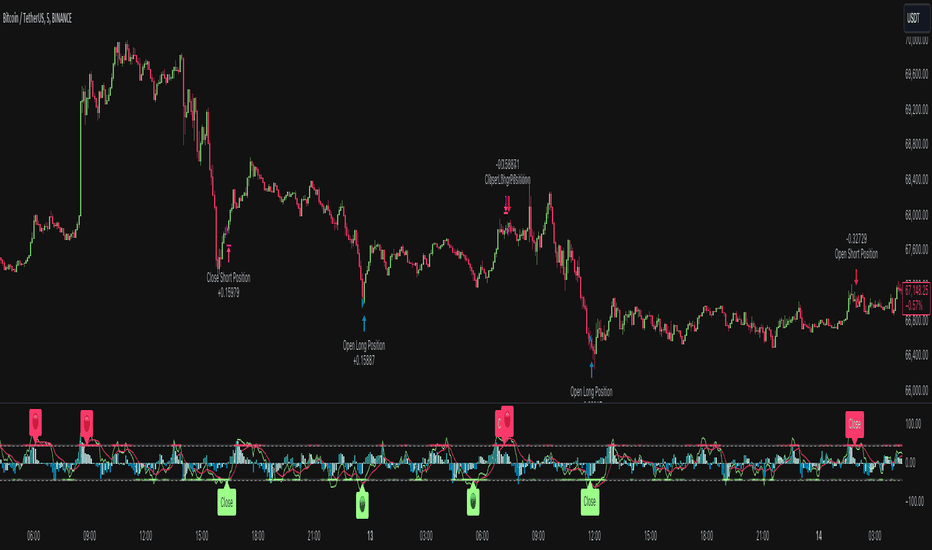
It is displayed as an upward green triangle at the bottom of the chart, indicating that the market might be exhausting its oversold conditions and potentially starting an upward reversal.
Possible Reversal from Overbought:
The Volume-Weighted RSI crosses below the overbought level.
It is displayed as a downward red triangle at the top of the chart, indicating that the market might be exhausting its overbought conditions and potentially starting a downward reversal.
Confirmation with the Modified MACD: For a more robust interpretation, the behavior of the modified MACD can be observed alongside the RSI cross.
The MACD is also modified, using normalized net volume (calculated as the cumulative change in the closing price multiplied by volume) as the input instead of the standard closing price.
The direction and color change of the MACD bars indicate the market's momentum.
Alerts: Alerts are set to trigger automatically when the modified RSI crosses the oversold or overbought levels.
Español:
Este script combina un RSI ponderado por volumen, suavizado con un Hull Moving Average (HMA) personalizado, con un MACD modificado basado en volumen neto normalizado.
RSI Ponderado por Volumen: Se calcula ajustando el precio de cierre con un OBV (On-Balance Volume) normalizado y luego aplicando un RSI. Este enfoque pondera el RSI según el volumen, proporcionando una medida más precisa de la fuerza del movimiento del precio.
HMA Modificado: Se utiliza un Hull Moving Average (HMA) para suavizar el RSI Ponderado por Volumen, mejorando la capacidad de identificar cambios en la tendencia del mercado.
Posible Reversión desde Sobreventa:
El RSI Ponderado por Volumen cruza por encima del nivel de sobreventa.
Se muestra como un triángulo verde hacia arriba en la parte inferior del gráfico, indicando que el mercado podría estar agotando las condiciones de sobreventa y comenzar una posible reversión al alza.
Posible Reversión desde Sobrecompra:
El RSI Ponderado por Volumen cruza por debajo del nivel de sobrecompra.
Se muestra como un triángulo rojo hacia abajo en la parte superior del gráfico, indicando que el mercado podría estar agotando las condiciones de sobrecompra y comenzar una posible reversión a la baja.
Confirmación con el MACD Modificado: Para una interpretación más robusta, se puede observar el comportamiento del MACD modificado junto con el cruce del RSI.
El MACD también está modificado, utilizando el volumen neto normalizado (calculado como el cambio acumulativo en el precio de cierre multiplicado por el volumen) como entrada en lugar del precio de cierre estándar.
La dirección y el cambio de color de las barras del MACD indican el impulso del mercado.
Alertas: Las alertas están configuradas para activarse automáticamente cuando el RSI modificado cruza los niveles de sobreventa o sobrecompra.
Indikator

[KVA] KMACDKMACD Indicator: Advanced Market Analysis Through Central Tendency Metrics
The KMACD (KAMVIA Moving Average Convergence Divergence) indicator is an advanced, multi-dimensional tool designed to provide traders and analysts with a deeper understanding of market dynamics. By integrating the classical MACD framework with statistical measures of central tendency, KMACD offers a sophisticated approach to identifying trends, reversals, and potential trading opportunities.
Key Features of the KMACD Indicator:
1. Enhanced MACD Calculation :
- The KMACD employs dual moving averages (fast and slow) of user-defined types (SMA, EMA, WMA) to calculate the MACD line, which represents the difference between these moving averages. This traditional approach is further enhanced by customizable signal smoothing, allowing users to fine-tune the sensitivity of the indicator.
2. Central Tendency Metrics :
- The indicator integrates additional statistical measures, such as Mean, Median, Mode, Standard Deviation, and Variance, calculated over a rolling window. These metrics provide insights into the central tendencies of the MACD values, helping traders understand the overall trend direction and the dispersion of price movements around the trend.
3. RSI-Like Oscillator :
- A unique RSI-like value derived from the MACD line is included to highlight overbought and oversold conditions. This offers a dual-layered perspective, combining the power of MACD and RSI methodologies, to signal potential market extremes with greater precision.
4. Customizable Visual Elements :
- KMACD allows users to toggle the visibility of the MACD line, Signal line, and Histogram, providing flexibility in how the data is presented. The histogram dynamically changes color—green when above zero, indicating bullish momentum, and red when below zero, indicating bearish momentum.
5. Horizontal Line Customization :
- The indicator includes customizable horizontal lines for the zero level, overbought, and oversold thresholds. These lines serve as visual cues to identify key price levels and market conditions.
6. Adaptive to Various Market Conditions :
- KMACD's comprehensive features make it adaptable to various market conditions, from trending markets to sideways consolidations. Whether you're looking to capture momentum shifts or identify potential reversal points, KMACD provides the analytical power needed to make informed trading decisions.
How to Use KMACD:
- Trend Identification : Use the MACD line in conjunction with central tendency measures (Mean, Median, Mode) to gauge the overall market trend and its strength. A rising MACD line, supported by higher mean and median values, typically indicates an uptrend.
- Momentum Analysis : The histogram and RSI-like value help in identifying the momentum behind price movements. Positive histogram bars suggest increasing bullish momentum, while negative bars suggest increasing bearish momentum.
- Overbought/Oversold Conditions : Monitor the RSI-like oscillator and the overbought/oversold levels to detect when the market may be poised for a reversal.
- Divergence Detection : Look for divergences between the MACD line and price action, supported by the central tendency measures, to spot potential reversal points.
Conclusion
The KMACD indicator is more than just a traditional MACD; it’s a comprehensive tool designed to cater to both novice and experienced traders. By incorporating central tendency metrics and customizable features, KMACD stands out as a versatile and powerful indicator that enhances market analysis and trading strategies. Whether you're navigating volatile markets or steady trends, KMACD offers the precision and depth needed to stay ahead. Indikator

MACD with 1D Stochastic Confirmation Reversal StrategyOverview
The MACD with 1D Stochastic Confirmation Reversal Strategy utilizes MACD indicator in conjunction with 1 day timeframe Stochastic indicators to obtain the high probability short-term trend reversal signals. The main idea is to wait until MACD line crosses up it’s signal line, at the same time Stochastic indicator on 1D time frame shall show the uptrend (will be discussed in methodology) and not to be in the oversold territory. Strategy works on time frames from 30 min to 4 hours and opens only long trades.
Unique Features
Dynamic stop-loss system: Instead of fixed stop-loss level strategy utilizes average true range (ATR) multiplied by user given number subtracted from the position entry price as a dynamic stop loss level.
Configurable Trading Periods: Users can tailor the strategy to specific market windows, adapting to different market conditions.
Higher time frame confirmation: Strategy utilizes 1D Stochastic to establish the major trend and confirm the local reversals with the higher probability.
Trailing take profit level: After reaching the trailing profit activation level scrip activate the trailing of long trade using EMA. More information in methodology.
Methodology
The strategy opens long trade when the following price met the conditions:
MACD line of MACD indicator shall cross over the signal line of MACD indicator.
1D time frame Stochastic’s K line shall be above the D line.
1D time frame Stochastic’s K line value shall be below 80 (not overbought)
When long trade is executed, strategy set the stop-loss level at the price ATR multiplied by user-given value below the entry price. This level is recalculated on every next candle close, adjusting to the current market volatility.
At the same time strategy set up the trailing stop validation level. When the price crosses the level equals entry price plus ATR multiplied by user-given value script starts to trail the price with EMA. If price closes below EMA long trade is closed. When the trailing starts, script prints the label “Trailing Activated”.
Strategy settings
In the inputs window user can setup the following strategy settings:
ATR Stop Loss (by default = 3.25, value multiplied by ATR to be subtracted from position entry price to setup stop loss)
ATR Trailing Profit Activation Level (by default = 4.25, value multiplied by ATR to be added to position entry price to setup trailing profit activation level)
Trailing EMA Length (by default = 20, period for EMA, when price reached trailing profit activation level EMA will stop out of position if price closes below it)
User can choose the optimal parameters during backtesting on certain price chart, in our example we use default settings.
Justification of Methodology
This strategy leverages 2 time frames analysis to have the high probability reversal setups on lower time frame in the direction of the 1D time frame trend. That’s why it’s recommended to use this strategy on 30 min – 4 hours time frames.
To have an approximation of 1D time frame trend strategy utilizes classical Stochastic indicator. The Stochastic Indicator is a momentum oscillator that compares a security's closing price to its price range over a specific period. It's used to identify overbought and oversold conditions. The indicator ranges from 0 to 100, with readings above 80 indicating overbought conditions and readings below 20 indicating oversold conditions.
It consists of two lines:
%K: The main line, calculated using the formula (CurrentClose−LowestLow)/(HighestHigh−LowestLow)×100 . Highest and lowest price taken for 14 periods.
%D: A smoothed moving average of %K, often used as a signal line.
Strategy logic assumes that on 1D time frame it’s uptrend in %K line is above the %D line. Moreover, we can consider long trade only in %K line is below 80. It means that in overbought state the long trade will not be opened due to higher probability of pullback or even major trend reversal. If these conditions are met we are going to our working (lower) time frame.
On the chosen time frame, we remind you that for correct work of this strategy you shall use 30min – 4h time frames, MACD line shall cross over it’s signal line. The MACD (Moving Average Convergence Divergence) is a popular momentum and trend-following indicator used in technical analysis. It helps traders identify changes in the strength, direction, momentum, and duration of a trend in a stock's price.
The MACD consists of three components:
MACD Line: This is the difference between a short-term Exponential Moving Average (EMA) and a long-term EMA, typically calculated as: MACD Line=12-period EMA−26-period
Signal Line: This is a 9-period EMA of the MACD Line, which helps to identify buy or sell signals. When the MACD Line crosses above the Signal Line, it can be a bullish signal (suggesting a buy); when it crosses below, it can be a bearish signal (suggesting a sell).
Histogram: The histogram shows the difference between the MACD Line and the Signal Line, visually representing the momentum of the trend. Positive histogram values indicate increasing bullish momentum, while negative values indicate increasing bearish momentum.
In our script we are interested in only MACD and signal lines. When MACD line crosses signal line there is a high chance that short-term trend reversed to the upside. We use this strategy on 45 min time frame.
ATR is used to adjust the strategy risk management to the current market volatility. If volatility is low, we don’t need the large stop loss to understand the there is a high probability that we made a mistake opening the trade. User can setup the settings ATR Stop Loss and ATR Trailing Profit Activation Level to realize his own risk to reward preferences, but the unique feature of a strategy is that after reaching trailing profit activation level strategy is trying to follow the trend until it is likely to be finished instead of using fixed risk management settings. It allows sometimes to be involved in the large movements.
Backtest Results
Operating window: Date range of backtests is 2023.01.01 - 2024.08.01. It is chosen to let the strategy to close all opened positions.
Commission and Slippage: Includes a standard Binance commission of 0.1% and accounts for possible slippage over 5 ticks.
Initial capital: 10000 USDT
Percent of capital used in every trade: 30%
Maximum Single Position Loss: -4.79%
Maximum Single Profit: +20.14%
Net Profit: +2361.33 USDT (+44.72%)
Total Trades: 123 (44.72% win rate)
Profit Factor: 1.623
Maximum Accumulated Loss: 695.80 USDT (-5.48%)
Average Profit per Trade: 19.20 USDT (+0.59%)
Average Trade Duration: 30 hours
These results are obtained with realistic parameters representing trading conditions observed at major exchanges such as Binance and with realistic trading portfolio usage parameters.
How to Use
Add the script to favorites for easy access.
Apply to the desired timeframe between 30 min and 4 hours and chart (optimal performance observed on 45 min BTC/USDT).
Configure settings using the dropdown choice list in the built-in menu.
Set up alerts to automate strategy positions through web hook with the text: {{strategy.order.alert_message}}
Disclaimer:
Educational and informational tool reflecting Skyrex commitment to informed trading. Past performance does not guarantee future results. Test strategies in a simulated environment before live implementation
Strategie

Indikator

Uptrick: MACD Slope Buy/Sell SignalsThe "Uptrick: MACD Slope Buy/Sell Signals" indicator is an advanced technical analysis tool meticulously crafted to provide traders with precise buy and sell signals derived from the slope changes of the Moving Average Convergence Divergence (MACD) signal line. This indicator integrates user-defined parameters for the MACD calculation, including the fast length, slow length, and signal smoothing period. These parameters allow traders to customize the indicator according to their specific trading strategies and timeframes, ensuring adaptability across various market conditions.
The primary function of this indicator is to monitor the slope of the MACD signal line and detect significant shifts that indicate potential changes in market momentum. The indicator calculates the slope by comparing the current value of the signal line to its previous value, and further determines the change in slope to identify acceleration or deceleration in the trend. A buy signal is generated when the slope of the signal line transitions from negative to positive, signaling an upward momentum, while a sell signal is triggered when the slope moves from positive to negative, indicating a downward trend. To enhance signal accuracy, the indicator distinguishes between regular and strong signals. A strong buy signal requires the slope change to be greater than the simple moving average (SMA) of recent slope changes, whereas a strong sell signal necessitates the slope change to be less than the negative SMA of recent slope changes.
A unique feature of this indicator is its dynamic and intuitive visualization. When a strong buy or sell signal is identified, it plots labels ('B' for buy and 'S' for sell) directly on the price chart. These labels are strategically positioned below or above the respective bars to ensure clear visibility and reduce chart clutter. The indicator also includes an option to connect consecutive signals with lines, which enhances the visual tracking of signal sequences and provides a coherent view of the trend's progression. The color intensity of the plotted signals varies based on the absolute value of the slope, offering an immediate visual cue on the strength of the detected trend changes. A steeper slope results in a darker color, signaling a stronger trend.
To facilitate comprehensive analysis, the indicator also plots the MACD and signal lines on the chart, providing traders with a reference to the underlying data that drives the buy and sell signals. These lines are color-coded for easy differentiation: the MACD line is typically blue, and the signal line is orange. This visual aid ensures that traders have a clear understanding of the indicator's basis and can cross-reference the generated signals with the MACD behavior.
The calculation of this indicator is grounded in well-established technical analysis principles. It employs the MACD function to derive the MACD line and signal line based on the user-defined parameters. The slope of the signal line is then computed, followed by the calculation of the slope change. The buy and sell signals are determined by comparing the current and previous slopes, and the strong signals are filtered through an additional layer of slope change analysis relative to its moving average.
The accuracy and reliability of the "Uptrick: MACD Slope Buy/Sell Signals" indicator stem from its thorough and methodical approach to signal generation. By combining user customization, detailed slope analysis, and robust visual elements, this indicator serves as a powerful tool for traders seeking precise entry and exit points in the market. Its ability to adapt to different trading styles and market conditions, coupled with its clear visual cues, makes it a valuable addition to any trader's toolkit, enhancing decision-making and improving trading outcomes. Indikator

Uptrick: Bullish/Bearish Signal DetectorDetailed Explanation of the "Uptrick: Bullish/Bearish Signal Detector" Script
The "Uptrick: Bullish/Bearish Signal Detector" script is a sophisticated tool designed for the TradingView platform, leveraging Pine Script version 5. This script is crafted to enhance traders' ability to identify bullish (buy) and bearish (sell) signals directly on their trading charts. By combining the power of the MACD (Moving Average Convergence Divergence) and RSI (Relative Strength Index) indicators, this script provides a unique and efficient method for detecting potential trading opportunities. Below is an in-depth exploration of its purpose, features, and functionality.
Purpose
The primary purpose of this script is to assist traders in identifying potential entry and exit points in the market by signaling bullish and bearish conditions. This automated detection helps traders make more informed decisions without the need to manually analyze complex indicators. By overlaying signals directly on the price chart, the script allows for quick visual identification of market trends and reversals.
Uniqueness
What sets this script apart is its dual use of MACD and RSI indicators. While many trading strategies might rely on a single indicator, combining MACD and RSI enhances the reliability of the signals by filtering out false positives. The script not only identifies trends but also adds a layer of confirmation through the RSI, which measures the speed and change of price movements.
Inputs and Features
Customizable Label Appearance:
The script allows users to customize the appearance of the labels that indicate bullish and bearish signals. Users can set their preferred colors for the labels and the text, ensuring that the signals are easily distinguishable and aesthetically pleasing on their charts.
MACD Calculation:
The script calculates the MACD line and signal line using user-defined input values for the fast length, slow length, and signal length. The MACD histogram, which is the difference between the MACD line and the signal line, is used to determine the momentum of the market.
RSI Calculation:
The RSI is calculated using a user-defined input length. The RSI helps in identifying overbought or oversold conditions, which are crucial for confirming the strength of the trend detected by the MACD.
Bullish and Bearish Conditions:
The script defines bullish conditions as those where the MACD histogram is positive and the RSI is above 50. Bearish conditions are defined where the MACD histogram is negative and the RSI is below 50. This combination of conditions ensures that signals are generated based on both momentum and relative strength, reducing the likelihood of false signals.
Label Plotting:
The script plots labels on the chart to indicate bullish and bearish signals. When a bullish condition is met, and the previous signal was not bullish, a "LONG" label is plotted. Similarly, when a bearish condition is met, and the previous signal was not bearish, a "SHORT" label is plotted. This feature helps in clearly marking the points of interest for traders, making it easier to spot potential trades.
Tracking Previous Signals:
To avoid repetitive signals, the script keeps track of the last signal. If the last signal was bullish, it avoids plotting another bullish signal immediately. The same logic applies to bearish signals. This tracking ensures that signals are spaced out and only significant changes in market conditions are highlighted.
How It Works
The script operates in a loop, processing each bar (or candlestick) on the chart as new data comes in. It calculates the MACD and RSI values for each bar and checks if the current conditions meet the criteria for a bullish or bearish signal. If a signal is detected and it is different from the last signal, a label is plotted on the chart at the current bar's price level. This real-time processing allows traders to see the signals as they form, providing timely insights into market movements.
Practical Application
For practical use, a trader would add this script to their TradingView chart. They can customize the input parameters for the MACD and RSI calculations to fit their trading strategy or preferred settings. Once added, the script will automatically analyze the price data and start plotting "LONG" and "SHORT" labels based on the detected signals. Traders can then use these labels to make decisions on entering or exiting trades, adjusting their strategy as necessary based on the signals provided.
Conclusion
The "Uptrick: Bullish/Bearish Signal Detector" script is a powerful tool for any trader looking to leverage technical indicators for better trading decisions. By combining MACD and RSI, it offers a robust method for detecting market trends and potential reversals. The customizable features and real-time signal plotting make it a versatile and user-friendly addition to any trading toolkit. This script not only simplifies the process of technical analysis but also enhances the accuracy of trading signals, thereby potentially increasing the trader's success rate in the market. Indikator

Moving Average Crossover Swing StrategyMoving Average Crossover Swing Strategy
**Overview:**
The basic concept of this strategy is to generate a signal when a faster/shorter length moving average crosses over (for Longs) or crosses under (for Shorts) a medium/longer length moving average. All of which are customizable. This strategy can work on any timeframe, however the daily is the timeframe used for the default settings and screenshots, as it was designed to be a multi-day swing strategy. Once a signal has been confirmed with a candle close, based on user options, the strategy will enter the trade on the open of the next candle.
The crossover strategy is nothing new to trading, but what can make this strategy unique and helpful, is the addition of further confirmation points, ATR based stop loss and take profit targets, optional early exit criteria, customizable to your needs and style, and just about everything visual can be toggled on/off. This strategy is based on a Trend (MA) indicator and a Momentum (MACD) indicator. While a Volume-based indicator is not shown here, one could consider using their favorite from that category to further compliment the signal idea.
It should be noted that depending on the time frame, direction(s) chosen, the signal options, confirmation options, and exit options selected, that a ticker may not produce more than 100 trades on the back test. Depending on your style and frequency, one could consider adjusting options and/or testing multiple tickers. It should also be noted that this strategy simply tests the underlying stock prices, not options contracts. And of course, testing this strategy against historical data does not assume that the same results will occur in future price action.
Shoutout given to Ripster's Clouds Indicator as pieces of that code were taken and modified to create both the Cloud visualization effects, and the Moving Average Pair Plots that are implemented in this strategy.
BASIC DEFAULTS
All can be changed as normal
Initial capital = 10,000
Order Sizing = 25% of equity (use the "Inputs" tab to modify this)
Pyramiding = 0
Commission = 0.65 USD per order
Price Verification = 1 tick
Slippage = 1 tick
RISK MANAGMENT
You will notice two different percentage options and ATR multipliers. This strategy will adjust position sizing by not exceeding either one of those % values based on the ATR (Average True Range) of the symbol and the multipliers selected, should the stock hit the stop loss price.
For Example, lets assume these values are true:
Account size = $10,000,
Max Risk = 1% of account size
Max Position Size = 25% of the account size
Stock Price = 23.45
ATR = 3.5
ATR Stop Loss Multiplier = 1.4
Then the formulas would be:
ACCT_SIZE * MaxRisk_% = 10000 * .01 = $100 (MaxCashRisk)
-----
MaxCashRisk / (ATR * ATR_SL_MULTIPLIER) = 100 / (3.5 * 1.4) = 20.4 Shares based on Max Cash Risk
-----
(ACCT_SIZE * MaxEquity_%) / STOCK_PRICE = (10000 * .25) / 23.45 = 106.61 Shares based on Max Equity Allocation
The minimum value of each of those options is then used, which in this case would be to purchase 20 shares so as not to exceed the max dollar risk should the stock reach the stop loss target. Likewise, if the ATR were to be much lower, say 0.48 cents, and all else the same, then the strategy would purchase the 106 shares based on Max Equity Allocation because the Max Cash Risk would require 149.25 shares.
MOVING AVERAGE OPTIONS
Select between and change the length & type of up to 5 pairs (10 total) of moving averages
The "Show Cloud-x" option will display a fill color between the "a" and "b" pairs
All moving averages lines can be toggled on/off in the "Style" tab, as well as adjusting their colors.
Visualization features do not affect calculations, meaning you could have all or nothing on the chart and the strategy will still produce results
SIGNAL CHOICES
Choose the fast/shorter length MA and the medium/longer length MA to determine the entry signal
CONFIRMATION OPTIONS
Both of these have customizable values and can be toggled on/off
A candle close over a slower/much longer length moving average
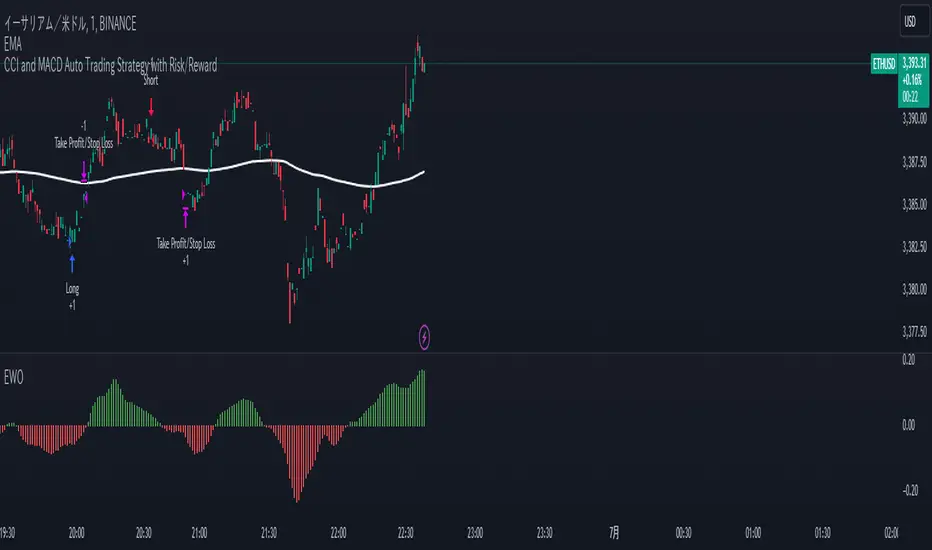
An additional cross-over (cross-under for Shorts) on the MACD indicator using default MACD values. While the MACD indicator is not necessary to have on the chart, it can help to add that for visualization. The calculations will perform whether the indicator is on the chart or not.
EARLY EXIT CRITERIA
Both can be toggled on/off with customizable values
MA Cross Exit will exit the trade early if the select moving averages cross-under (for longs) or cross-over (for shorts), indicating a potential reversal.
Max Bars in Trades will act as a last-resort exit by simply calculating the amount of full bars the trade has been open, and exiting on the opening of the next bar. For example: the default value is 8 bars, so after 8 full bars in the trade, if no other exit has been triggered (Stop Loss, Take Profit, or MA Cross(if enabled)), then the trade will exit at the opening of the 9th bar.
Finally, there is a table displaying the amount of trades taken for each side, and the amount & percent of both early exits. This table can be turned off in the "Style" tab
ADDITIONAL PLOTS
MACD (Moving Average Convergence/Divergence):
- The MACD is an optional confirmation indicator for this strategy.
- Plotting the indicator is not necessary for the strategy to work, but it can be helpful to visually see the status and position of the MACD if this feature is enabled in the strategy
- This helps to identify if there is also momentum behind the entry signal
Strategie

Biquad MACDThis indicator reimagines the traditional MACD by incorporating a biquad band pass filter, offering a refined approach to identifying momentum and trend changes in price data. The standard MACD is essentially a band pass filter, but often it lacks precision. The biquad band pass filter addresses this limitation by providing a more focused frequency range, enhancing the quality of signals.
The MACD Length parameter determines the length of the band pass filter, influencing the frequency range that is isolated. Adjusting this length allows you to focus on different parts of the price movement spectrum.
The Bandwidth (BW) setting controls the width of the frequency band in octaves. It affects the smoothness of the MACD line. A larger bandwidth results in less smooth output, capturing a broader range of frequencies, while a smaller bandwidth focuses on a narrower range, providing a smoother signal.
The Signal Length parameter sets the period for the exponential moving average of the MACD line, which acts as a signal line to identify potential buy and sell points.
Key Features of the Biquad MACD
The MACD is a well-known momentum indicator used to identify changes in the strength, direction, momentum, and duration of a trend in a stock's price. By applying a biquad band pass filter, this version of the MACD provides a more refined and accurate representation of price movements.
The biquad filter offers smooth response and minimal phase distortion, making it ideal for technical analysis. The customizable MACD length and bandwidth allow for flexible adaptation to different trading strategies and market conditions. The signal line smooths the MACD values, providing clear crossover points to indicate potential market entry and exit signals.
The histogram visually represents the difference between the MACD and the signal line, changing colors to indicate rising or falling momentum, which helps in quickly identifying trend changes.
By incorporating the Biquad MACD into your trading toolkit, you can enhance your chart analysis with clearer insights into momentum and trend changes, leading to more informed trading decisions. Indikator

2 MA Cross Cvg Dvg Slope Overview
This indicator combines the Moving Average Convergence Divergence (MACD) and two Moving Averages (MAs) to assess market momentum and trend direction. It aims to provide insights into the strength and direction of price movements by analyzing the MACD line, MAs slopes, and MA crossovers. Instead of eyeballing the exact MA crossovers and MAs slope steepness on the chart and MACD line changes on separate panes, this indicator pixelate the overloaded information or multiple indicators interpretation into a KISS "boolean" decision making.
Key Components
MACD Line
This line represents the difference between the fast MA and slow MA. It reflects short-term price momentum relative to the long-term trend.
Moving Averages (MAs)
Two types of MAs are utilized in this indicator:
Fast MA (short-term): Often a 9-period MA or similar, which reacts quickly to price changes.
Slow MA (long-term): Typically a 21-period MA or similar, which smooths out price fluctuations and identifies the longer-term trend.
Indicator Logic
MA Crossover: The crossover of the fast MA above the slow MA suggests a bullish trend, while a crossover below indicates a bearish trend.
MA Slope Analysis: The indicator also considers the slopes of both the fast and slow MAs to determine the direction:
Both MA Positive Slope: Indicates upward momentum or bullish trend.
Both MA Negative Slope: Indicates downward momentum or bearish trend.
One MA Positive Slope, the other Negative Slope: Indicates indecision.
MACD Line: MACD Line consecutively increase means increasing positive momentum, vice versa.
Interpretation
Uptrend: When fast MA cross over slow MA. Indicator show "+" symbol at top zone with value 0.5.
Additional Uptrend Confirmation: When both MAs have positive slope. Indicator show only green bar.
Uptrend Upward Momentum: MACD Line increase when fast MA above slow MA. Indicator show "." symbol value 0.75.
Uptrend Downward Momentum: MACD Line decrease when fast MA above slow MA. Indicator show "." symbol value 0.25.
Indecision: When one of the MA has positive slope, but another MA has negative slope. Indicator showing both red and green bar.
Downtrend: When fast MA cross under slow MA. Indicator show "+" symbol at bottom zone with value 0.5.
Additional Downtrend Confirmation: When both MAs have negative slope. Indicator show only red bar.
Downtrend Upward Momentum: MACD Line increase when fast MA below slow MA. Indicator show "." symbol value -0.25.
Uptrend Downward Momentum: MACD Line decrease when fast MA below slow MA. Indicator show "." symbol value -0.75.
Combination of above multiple interpretation can further derive different signal for Trend Starts, Trend Continuous, and Trend Reversals.
Usage
This indicator is valuable for traders seeking to:
Identify entry and exit points based on single or multiple combination of MAs and MACD Line signals.
Confirm trend direction using MAs cross over or cross under spotted easily with the "+" symbol above 0 or below 0.
Double confirm the trend based on two MAs align slope direction.
Understand momentum shifts and potential trend reversals with an easy 4 different dots at -0.75, -0.25, 0.25, and 0.75.
Conclusion
By combining MACD Line analysis with Moving Average slopes and crossovers, this indicator offers a comprehensive approach to assessing market momentum and trend direction. It provides clear signals for traders to make informed decisions on when to enter or exit positions, enhancing overall trading strategy effectiveness without the need of referring to multiple chart or zoom in and out of the price chart to identify the crossover and slope direction. Indikator

Strategie

Chande Momentum Oscillator (CMO) Buy Sell Strategy [TradeDots]The "Chande Momentum Oscillator (CMO) Buy Sell Strategy" leverages the CMO indicator to identify short-term buy and sell opportunities.
HOW DOES IT WORK
The standard CMO indicator measures the difference between recent gains and losses, divided by the total price movement over the same period. However, this version of the CMO has some limitations.
The primary disadvantage of the original CMO is its responsiveness to short-term volatility, making the signals less smooth and more erratic, especially in fluctuating markets. This instability can lead to misleading buy or sell signals.
To address this, we integrated the concept from the Moving Average Convergence Divergence (MACD) indicator. By applying a 9-period exponential moving average (EMA) to the CMO line, we obtained a smoothed signal line. This line acts as a filter, identifying confirmed overbought or oversold states, thereby reducing the number of false signals.
Similar to the MACD histogram, we generate columns representing the difference between the CMO and its signal line, reflecting market momentum. We use this momentum indicator as a criterion for entry and exit points. Trades are executed when there's a convergence of CMO and signal lines during an oversold state, and they are closed when the CMO line diverges from the signal line, indicating increased selling pressure.
APPLICATION
Since the 9-period EMA smooths the CMO line, it's less susceptible to extreme price fluctuations. However, this smoothing also makes it more challenging to breach the original +50 and -50 benchmarks.
To increase trading opportunities, we've tightened the boundary ranges. Users can customize the target benchmark lines in the settings to adjust for the volatility of the underlying asset.
The 'cool down period' is essentially the number of bars that await before the next signal generation. This feature is employed to dodge the occurrence of multiple signals in a short period.
DEFAULT SETUP
Commission: 0.01%
Initial Capital: $10,000
Equity per Trade: 80%
Signal Cool Down Period: 5
RISK DISCLAIMER
Trading entails substantial risk, and most day traders incur losses. All content, tools, scripts, articles, and education provided by TradeDots serve purely informational and educational purposes. Past performances are not definitive predictors of future results. Strategie
Indikator

Indikator

Multi Timeframe Moving Average Convergence Divergence {DCAquant}Overview
The MTF MACD indicator provides a unique view of MACD (Moving Average Convergence Divergence) and Signal Line dynamics across various timeframes. It calculates the MACD and Signal Line for each selected timeframe and aggregates them for analysis.
Key Features
MACD Calculation
Utilizes standard MACD calculations based on user-defined parameters like fast length, slow length, and signal smoothing.
Determines the difference between the MACD and Signal Line to identify convergence or divergence.
Multiple Timeframe Analysis
Allows users to select up to six different timeframes for analysis, ranging from minutes to days, providing a holistic view of market trends.
Calculates MACD and Signal Line for each timeframe independently.
Aggregated Analysis
Combines MACD and Signal Line values from multiple timeframes to derive a consolidated view.
Optionally applies moving average smoothing to aggregated MACD and Signal Line values for better clarity.
Position Identification
Determines the trading position (Long, Short, or Neutral) based on the relationship between MACD and Signal Line.
Considers the proximity of MACD and Signal Line to identify potential trading opportunities.
Visual Representation
Plots MACD and Signal Line on the price chart for visual analysis.
Utilizes color-coded backgrounds to indicate trading conditions (Long, Short, or Neutral) for quick interpretation.
Dynamic Table Display
Displays trading position alongside graphical indicators (rocket for Long, snowflake for Short, and star for Neutral) in a customizable table.
Offers flexibility in table placement and size for user preference.
How to Use
Parameter Configuration
Adjust parameters like fast length, slow length, and signal smoothing to fine-tune MACD calculations.
Select desired timeframes for analysis based on trading preferences and market conditions.
Interpretation
Monitor the relationship between MACD and Signal Line on the price chart.
Pay attention to color-coded backgrounds and graphical indicators in the table for actionable insights.
Decision Making
Consider entering Long positions when MACD is above the Signal Line and vice versa for Short positions.
Exercise caution during Neutral conditions, as there may be uncertainty in market direction.
Risk Management
Combine MTF MACD analysis with risk management strategies to optimize trade entries and exits.
Set stop-loss and take-profit levels based on individual risk tolerance and market conditions.
Conclusion
The Multi Timeframe Moving Average Convergence Divergence (MTF MACD) indicator offers a robust framework for traders to analyze market trends across multiple timeframes efficiently. By combining MACD insights from various time horizons and presenting them in a clear and actionable format, it empowers traders to make informed decisions and enhance their trading strategies.
Disclaimer
The Multi Timeframe Moving Average Convergence Divergence (MTF MACD) indicator provided here is intended for educational and informational purposes only. Trading in financial markets involves risk, and past performance is not indicative of future results. The use of this indicator does not guarantee profits or prevent losses.
Please be aware that trading decisions should be made based on your own analysis, risk tolerance, and financial situation. It is essential to conduct thorough research and seek advice from qualified financial professionals before engaging in any trading activity.
The MTF MACD indicator is a tool designed to assist traders in analyzing market trends and identifying potential trading opportunities. However, it is not a substitute for sound judgment and prudent risk management.
By using this indicator, you acknowledge that you are solely responsible for your trading decisions, and you agree to indemnify and hold harmless the developer and distributor of this indicator from any losses, damages, or liabilities arising from its use.
Trading in financial markets carries inherent risks, and you should only trade with capital that you can afford to lose. Exercise caution and discretion when implementing trading strategies, and consider seeking independent financial advice if necessary. Indikator

Velocity And Acceleration with Strategy: Traders Magazine◙ OVERVIEW
Hi, Ivestors and Traders... This Indicator, the focus is Scott Cong's article in the Stocks & Commodities September issue, “VAcc: A Momentum Indicator Based On Velocity And Acceleration”. I have also added a trading strategy for you to benefit from this indicator. First of all, let's look at what the indicator offers us and what its logic is. First, let's focus on the logic of the strategy.
◙ CONCEPTS
Here is a new indicator based on some simple physics concepts that is easy to use, responsive and precise. Learn how to calculate and use it.
The field of physics gives us some important principles that are highly applicable to analyzing the markets. In this indicator, I will present a momentum indicator. Scott Cong developed based on the concepts of velocity and acceleration this indicator. Of the many characteristics of price that traders and analysts often study, rate and rate of change are useful ones. In other words, it’s helpful to know: How fast is price moving, and is it speeding up or slowing down? How is price changing from one period to the next? The indicator I’m introducing here is calculated using the current bar (C) and every bar of a lookback period from the current bar. He named the indicator the VAcc since it’s based on the average of velocity line (av) and acceleration line (Acc) over the lookback period. For longer periods, the VAcc behaves the same way as the MACD, only it’s simpler, more responsive, and more precise. Interestingly, for shorter periods, VAcc exhibits characteristics of an oscillator, such as the stochastics oscillator.
◙ CALCULATION
The calculation of VAcc involves the following steps:
1. Relatively weighted average where the nearer price has the largest influence.
weighted_avg (float src, int length) =>
float sum = 0.0
for _i = 1 to length
float diff = (src - src ) / _i
sum += diff
sum /= length
2. The Velocity Average is smoothed with an exponential moving average. Now it get:
VAcc (float src, int period, int smoothing) =>
float vel = ta.ema(weighted_avg(src, period), smoothing)
float acc = weighted_avg(vel, period)
3. Similarly, accelerations for each bar within the lookback period and scale factor are calculated as:
= VAcc(src, length1, length2)
av /= (length1 * scale_factor)
◙ STRATEGY
In fact, Scott probably preferred to use it in periods 9 and 26 because it was similar to Macd and used the ratio of 0.5. However, I preferred to use the 8 and 21 periods to provide signals closer to the stochastic oscillator in the short term and used the 0.382 ratio. The logic of the strategy is this
Long Strategy → acc(Acceleration Line) > 0.1 and av(Velocity Average Line) > 0.1(Long Factor)
Short strategy → acc(Acceleration Line) < -0.1 and av(Velocity Average Line) < -0.1(Long Factor)
Here, you can change the Short Factor and Long Factor as you wish and produce more meaningful results that are closer to your own strategy.
I hope you benefits...
◙ GENEL BAKIŞ
Merhaba Yatırımcılar ve Yatırımcılar... Bu Gösterge, Scott Cong'un Stocks & Emtia Eylül sayısındaki “VAcc: Hız ve İvmeye Dayalı Bir Momentum Göstergesi” başlıklı makalesine odaklanmaktadır. Bu göstergeden faydalanabilmeniz için bir ticaret stratejisi de ekledim. Öncelikle göstergenin bize neler sunduğuna ve mantığının ne olduğuna bakalım. Öncelikle stratejinin mantığına odaklanalım.
◙ KAVRAMLAR
İşte kullanımı kolay, duyarlı ve kesin bazı basit fizik kavramlarına dayanan yeni bir gösterge. Nasıl hesaplanacağını ve kullanılacağını öğrenin.
Fizik alanı bize piyasaları analiz etmede son derece uygulanabilir bazı önemli ilkeler verir. Bu göstergede bir momentum göstergesi sunacağım. Scott Cong bu göstergeyi hız ve ivme kavramlarına dayanarak geliştirdi. Yatırımcıların ve analistlerin sıklıkla incelediği fiyatın pek çok özelliği arasında değişim oranı ve oranı yararlı olanlardır. Başka bir deyişle şunu bilmek faydalı olacaktır: Fiyat ne kadar hızlı hareket ediyor ve hızlanıyor mu, yavaşlıyor mu? Fiyatlar bir dönemden diğerine nasıl değişiyor? Burada tanıtacağım gösterge, mevcut çubuk (C) ve mevcut çubuktan bir yeniden inceleme döneminin her çubuğu kullanılarak hesaplanır. Göstergeye, yeniden inceleme dönemi boyunca hız çizgisinin (av) ve ivme çizgisinin (Acc) ortalamasına dayandığı için VAcc adını verdi. Daha uzun süreler boyunca VACc, MACD ile aynı şekilde davranır, yalnızca daha basit, daha duyarlı ve daha hassastır. İlginç bir şekilde, daha kısa süreler için VAcc, stokastik osilatör gibi bir osilatörün özelliklerini sergiliyor.
◙ HESAPLAMA
VAcc'nin hesaplanması aşağıdaki adımları içerir:
1. Yakın zamandaki fiyatın en büyük etkiye sahip olduğu göreceli ağırlıklı ortalamayı hesaplatıyoruz.
weighted_avg (float src, int length) =>
float sum = 0.0
for _i = 1 to length
float diff = (src - src ) / _i
sum += diff
sum /= length
2. Hız Ortalamasına üstel hareketli ortalamayla düzleştirme uygulanır. Şimdi bu şekilde aşağıdaki kod ile bunu şöyle elde ediyoruz:
VAcc (float src, int period, int smoothing) =>
float vel = ta.ema(weighted_avg(src, period), smoothing)
float acc = weighted_avg(vel, period)
3. Benzer şekilde, yeniden inceleme süresi ve ölçek faktörü içindeki her bir çubuk için fiyattaki ivmelenler yada momentum şu şekilde hesaplanır:
= VAcc(src, length1, length2)
av /= (length1 * scale_factor)
◙ STRATEJİ
Aslında Scott muhtemelen Macd'e benzediği ve 0,5 oranını kullandığı için 9. ve 26. periyotlarda kullanmayı tercih etmişti. Ancak kısa vadede stokastik osilatöre daha yakın sinyaller sağlamak için 8 ve 21 periyotlarını kullanmayı tercih ettim ve 0,382 oranını kullandım. Stratejinin mantığı şu
Uzun Strateji → acc(İvme Çizgisi) > 0,1 ve av(Hız Ortalama Çizgisi) > 0,1(Uzun Faktör)
Kısa strateji → acc(İvme Çizgisi) < -0,1 ve av(Hız Ortalama Çizgisi) < -0,1(Uzun Faktör)
Burada Kısa Faktör ve Uzun Faktör' ü dilediğiniz gibi değiştirip, kendi stratejinize daha yakın, daha anlamlı sonuçlar üretebilirsiniz.
umarım faydasını görürsün...
Indikator

Indikator
RSI and MACD Composite ScoreComponents of the Indicator
RSI Settings:
The RSI is set with a length parameter, which can be adjusted by the user but defaults to 14. This measures the speed and change of price movements.
MACD Settings:
The MACD is composed of two lines: the MACD line and the signal line, which are calculated from exponential moving averages (EMAs) of different lengths (fast and slow). The default settings are 9 for the fast length, 26 for the slow length, and 3 for the signal length.
The MACD histogram, which is the difference between the MACD line and the signal line, is also calculated.
Normalization and Combination
RSI Normalization : The RSI values are normalized around 0 by subtracting 50 from the RSI and then dividing by 50. This scaling adjusts the RSI to fluctuate around 0, where positive values indicate strength and negative values indicate weakness relative to the median RSI value of 50.
MACD Normalization : The MACD histogram is normalized by dividing it by the highest absolute value of the histogram over the slow length period. This adjustment scales the MACD histogram to fall between -1 and 1, making it comparable in magnitude to the normalized RSI.
Composite Score Calculation
The composite score is simply the sum of the normalized RSI and the normalized MACD histogram. This results in a combined score that reflects both momentum (from RSI) and trend (from MACD), providing a multifaceted view of market dynamics.
Visualization
The composite score is plotted as an oscillator, with a horizontal zero line that helps identify when the score shifts from positive to negative or vice versa.
The background color changes based on the trend: green if the composite score is above zero (bullish trend) and red if below zero (bearish trend). Indikator

Indikator

Neutral State MACD {DCAquant}The Neutral State MACD {DCAquant}
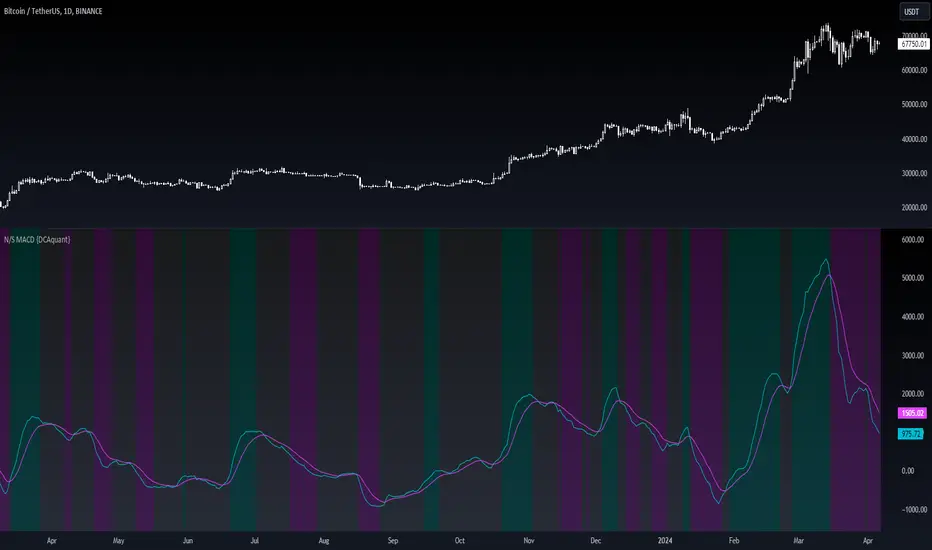
The Neutral State MACD {DCAquant} offers a nuanced interpretation of the classic MACD (Moving Average Convergence Divergence) indicator. By focusing on the neutrality of price movements, it serves to identify periods where the market lacks a defined directional bias, often seen as potential phases of accumulation or distribution before a new trend emerges.
Characteristics of the Neutral State MACD {DCAquant}:
Enhanced MACD Formula: Incorporates a neutral zone detection system into the traditional MACD framework to spotlight periods of market equilibrium.
Neutral Zone Threshold: A user-defined parameter that establishes a range within which the MACD and the signal line convergence is considered indicative of a neutral state.
Color-Coded Visualization: Utilizes color variations to illustrate the relationship between the MACD line and the signal line, accentuating the detection of neutral states, bullish crossovers, and bearish crossovers.
Functionality:
MACD and Signal Line Calculation: Employs fast and slow EMA inputs to generate the MACD line, contrasted against a signal line to capture momentum shifts.
Neutral State Detection: Assesses the proximity between the MACD and signal lines relative to the neutral zone threshold, identifying periods where neither bullish nor bearish momentum is dominant.
Background Highlighting: Modifies the chart's background color to reflect the current state of the market—neutral (gray), bullish divergence (teal), or bearish divergence (purple).
Interpretation and Trading Strategy:
Market Phases Identification: Traders can spot periods of equilibrium that may precede significant market moves, aiding in the timing of entry and exit points.
Momentum Analysis: The MACD line's cross above the signal line suggests increasing bullish momentum, whereas a cross below may signal growing bearish momentum.
Trend Confirmation: Acts as a confirmation tool when aligned with trend-following strategies, providing additional validation for trade setups.
Customization and User Guidance:
Adjustable Parameters: Allows for fine-tuning of length settings and the neutral zone threshold to match different trading styles and market conditions.
Complementary Indicator: Can be paired with volume indicators, price action patterns, or other oscillators to form a comprehensive trading system.
Disclaimer:
The Neutral State MACD {DCAquant} is a sophisticated tool meant for educational and strategic development. Traders should integrate it within a broader analytical framework and consider additional market factors. It is not a standalone signal for trades and should be used with caution and proper risk management. Trading decisions should always be made in the context of well-researched strategies and responsible investment practices. Indikator

Indikator

Indikator

Divergence Detector [TradingFinder] RSI + MACD + AO Oscillator 🔵 Introduction
🟣 Understanding Divergence
As mentioned, divergence occurs in technical analysis when a stock's price behaves contrary to indicators on the price chart. Divergence can signify either a reversal of the stock's trend or a continuation of the previous trend correction.
Divergences can act as reversal patterns or continuation patterns. Moreover, divergences can be utilized to identify potential support and resistance levels.
For instance, when an indicator is trending upwards and positive, but the price is declining and trending downwards, divergence occurs. Divergence in a stock indicates trader indecision in buying and selling and warns traders to reconsider their decisions regarding buying or holding the stock.
Divergence aids analysts in identifying critical price points. In indicator divergences, it serves as a potent signal in the realm of technical analysis.
🟣 Types of Divergence
1.Regular Divergence
o Positive Regular Divergence (RD+)
o Negative Regular Divergence (RD-)
2.Hidden Divergence
o Positive Hidden Divergence (HD+)
o Negative Hidden Divergence (HD-)
3.Time Divergence
Key Note : This indicator is specifically designed to identify "Regular Divergence" only. Therefore, the following explanation pertains to this type of divergence.
🔵 Regular Divergence/Convergence
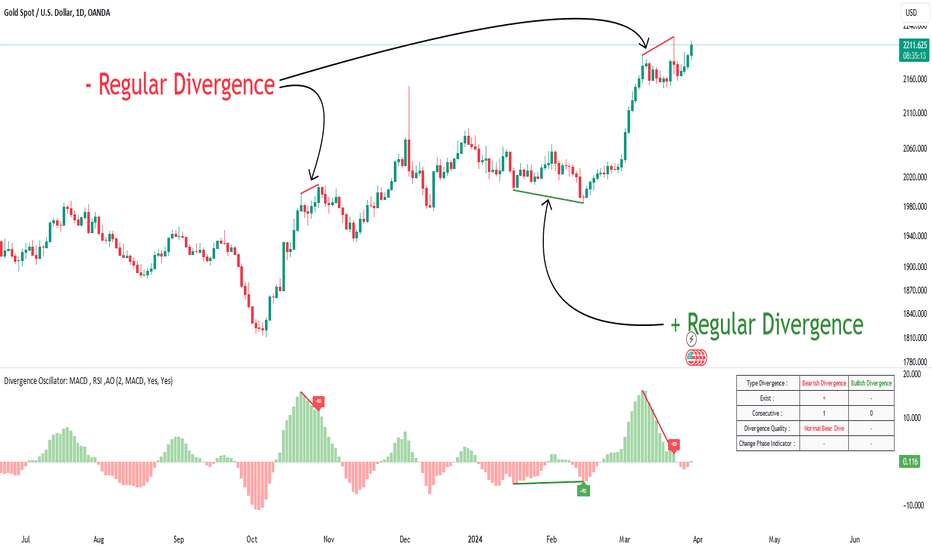
Regular Divergence(Convergence) occurs due to conflicting behavior between the indicator and the price chart, typically at the end of a trend. Recognizing Regular Divergence suggests an anticipation of a trend reversal or a pattern resembling a reversal.
🟣 Positive Regular Divergence (RD+)
In contrast to negative divergence, positive Regular Divergence occurs at the end of a downtrend and between two price lows. It manifests when the price forms a new low on the price chart, but the indicator fails to recognize it.
Positive Regular Divergence indicates strong buying pressure and weak selling pressure. Following the identification of positive divergence on the chart, one can anticipate a price increase for the examined stock.
🟣 Negative Regular Divergence (RD-)
This type of Regular Divergence emerges between two price highs during an uptrend. A new high is formed on the price chart, but the indicator fails to acknowledge it. This scenario indicates negative Regular Divergence.
The likelihood of a subsequent market downturn is high. Negative divergence signifies strong selling pressure and weak buying pressure, suggesting an unfavorable future for the stock.
🔵 How to use
By utilizing the "Fractal Period" input, you can specify your desired periods for identifying divergences.
Additionally, through the "Divergence Detect Method" feature, you can choose which oscillators (MACD, RSI, or AO) to base divergence identification on.
Divergence in MACD Oscillator :
Divergence in the MACD indicator occurs when the price chart and the MACD line form a noticeable opposing pattern, meaning the price moves contrary to the MACD line. In this scenario, one expects a reversal in price direction.
Divergence in RSI Oscillator :
If divergence occurs during a downtrend on the price chart (two consecutive lows, with the second low being lower) and on the corresponding RSI point (two consecutive lows, with the second low being higher), it signifies positive Regular Divergence and implies a buying signal.
Conversely, if divergence occurs during an uptrend on the price chart (two consecutive highs, with the second high being higher) and on the corresponding RSI point (two consecutive highs, with the second high being lower), it indicates negative Regular Divergence, signaling a selling opportunity.
Divergence in AO Oscillator :
The AO indicator calculates histograms similar to the AO base. It calculates the difference between the simple moving averages of 5 and 34 periods based on the median of each bar. Then, it plots the bars based on the difference.
It then compares the histograms to detect peaks and troughs in the AO histograms and compares the identified peaks and troughs to the price. Whenever divergence is detected, it plots lines and arrows.
🔵 Table
The table contains information on the functional features of this oscillator that you can utilize. Four categories of information are presented in the table: "Exist," "Consecutive," "Divergence Quality," and "Change Phase Indicator."
Exist :
If divergence exists, you'll see "+" in this row.
Consecutive :
Divergences may occur consecutively. If same-type divergences form within short intervals, you can observe the count in this row.
Divergence Quality : Based on the number of consecutive divergences, their quality can be evaluated. If one divergence exists, its quality is considered "Normal." If two divergences exist, the quality is "Good," and if three or more divergences exist, the quality is considered "Strong."
Change Phase Indicator : If a phase change occurs between two oscillation peaks formed based on divergence, this change is identified and displayed in this row.
Indikator
Indikator