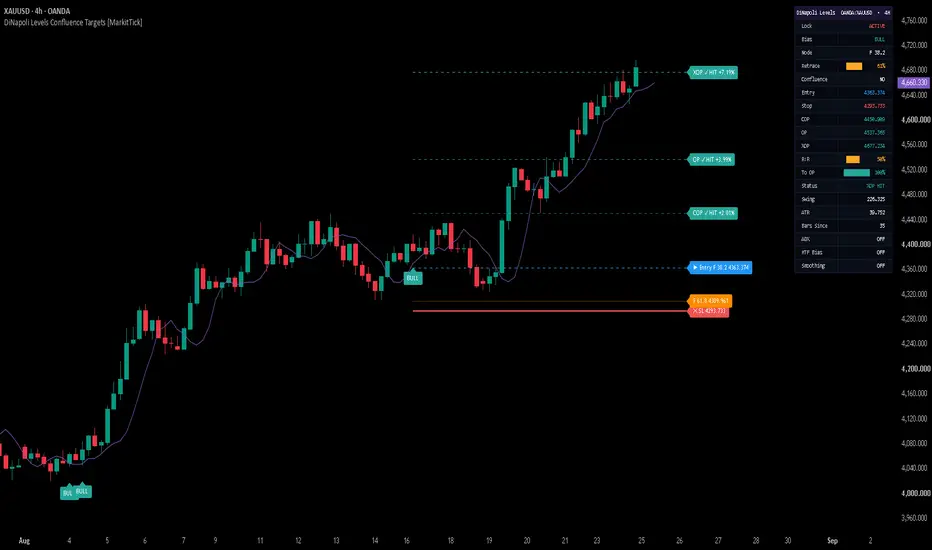
DiNapoli Levels Confluence Targets [MarkitTick]💡 This script automates the complete DiNapoli-style Fibonacci workflow on any symbol and timeframe: it locates confirmed swing pivots, measures the resulting impulse leg, selects an appropriate Fibonacci retracement entry from that leg, projects a three-tier set of Fibonacci profit objectives from the pullback point, cross-checks a second independent swing for confluence, filters everything through a displaced-average trend context, and then tracks the resulting trade in real time through on-chart levels and a live dashboard.
Rather than requiring a trader to manually draw retracement and expansion tools on every fresh swing, cross-reference two different Fibonacci grids by eye, and mentally track a displaced moving average's bias, the script performs all of that detection, labeling, and state-tracking automatically, and exposes the resulting signals through webhook-ready alert payloads for automation.
✨ Originality and Utility
This is not a rehash of a single built-in Pine tool or a simple retracement drawing utility. It implements the full, interdependent DiNapoli Levels sequence as one coherent system, where each stage consumes the output of the previous one:
Confirmed fractal pivot detection builds the swing skeleton the entire tool depends on.
The most recent three-to-five pivots are used to define both a primary swing (for entries and objectives) and a secondary, older swing (used only for confluence cross-checking).
Retracement depth of the pullback determines which of two Fibonacci entry levels is actually referenced, rather than relying on a single fixed ratio for every setup.
Profit objectives are geometric extensions of the very same swing used to derive the entry, not independent, arbitrarily chosen levels.
The displaced-average trend filter, ATR-based stop, and confluence check all read from the same pivot/swing state, so removing any one of them would break the internal logic rather than simply "simplify" the script.
Because the entry, stop, and all three objectives are all mathematically derived from the same confirmed swing, the tool gives traders a single, internally consistent read on a setup instead of several disconnected indicators layered on top of one another. The value is in the integration and automation of a documented, multi-step methodology, the live tracking of trade state once a signal fires, and the structured webhook output for downstream automation — not in inventing a new mathematical formula.
🔬 Methodology and Concepts
• Pivot and Swing Detection
Swing highs and lows are identified using a standard confirmed-fractal method: a candidate high (or low) is only accepted once it is verified to be the extreme point across a window of Pivot Left bars before it and Pivot Right bars after it. Confirmed pivots are stored in a rolling, alternating high/low sequence (capped at the eight most recent) that forms the script's live market-structure map.
• Swing Classification
The three most recent pivots are labeled, oldest to newest, A, B, and C. A bullish structure requires the sequence low → high → low (A low, B high, C low), representing an upward impulse leg from A to B followed by a pullback into C. A bearish structure is the mirror image. The distance from A to B defines the primary swing used for every subsequent calculation.
• Retracement Measurement
The pullback's depth is expressed as a percentage of the A–B swing: how far price has travelled back from B toward A by the time pivot C is confirmed. This retracement percentage drives both setup validity and entry-level selection.
• Fibonacci Retracement Entry Zone
Two retracement levels of the A–B swing are calculated, at 38.2% and 61.8%. If the confirmed pullback has already reached 61.8% or deeper, the script references the 61.8% level as the entry; otherwise it references the shallower 38.2% level. This dynamic selection reflects the idea that the appropriate entry reference depends on how deep the actual retracement has gone, rather than committing to one ratio for every swing.
• Fibonacci Objective Targets
Three profit objectives are projected from pivot C using the primary swing magnitude, following the classic three-tier DiNapoli objective-point structure:
COP (Contracted Objective Point) — C plus 0.618 times the swing.
OP (Objective Point) — C plus 1.000 times the swing.
XOP (Expanded Objective Point) — C plus 1.618 times the swing.
These represent successively less conservative price projections derived from the same impulse leg used for the entry.
• Setup Validation
A setup is only considered valid when all of the following hold: the alternating high/low pattern is intact, the retracement sits between 38.2% and the user-defined Max Retrace ceiling (filters out pullbacks that have gone too deep to be a valid retracement), the swing's magnitude is at least the Min Swing × ATR threshold (filters out insignificant, noise-driven swings), the swing direction is consistent with the claimed bias, the trend filter (if enabled) agrees, and a confluence zone exists (if Confluence Required is enabled).
• Dual-Swing Confluence Detection
A second, independent swing is measured from an older pivot (A2) to B, and the same 38.2%/61.8% retracement math is applied to it. The script then compares all four combinations of the primary and secondary retracement levels and, if the two closest levels fall within Confluence Tolerance × ATR of each other, marks the midpoint between them as a confluence zone. This reflects agreement between two independently measured Fibonacci grids rather than a single grid taken in isolation, which is the basis of the confluence concept in DiNapoli's original methodology.
• Displaced Moving Average Trend Filter
A short simple moving average (DMA Length) is calculated, and the internal trend comparison uses that average's value from DMA Displace bars earlier, effectively lagging the filter by that many bars. The same average is plotted on the chart with a forward visual offset equal to the same displacement, so the line drawn on the chart lines up with the value actually being compared against price. When enabled, only setups where price sits on the correct side of this displaced average are accepted.
• Stop and Objective Placement Logic
The stop is placed a user-defined multiple of ATR beyond pivot C, giving the stop room proportional to the instrument's own recent volatility rather than a fixed distance. All targets are recalculated fresh each time a new, valid setup fires and remain fixed for the life of that trade.
• Signal Firing and State Tracking
A new signal fires only on a confirmed (closed) bar, and only once per underlying pivot, preventing duplicate or repeated firing on the same structure. Once fired, the script tracks live high/low crosses against the stop and each objective; a stop hit takes priority over a same-bar target hit, and each hit updates the relevant level's on-chart label and color permanently for that trade. The Lock Signal input can freeze the presently tracked setup on the real-time bar so that a fresh pivot does not override an open position mid-trade.
⏱️ Confirmation Lag Notice
Because a pivot cannot be confirmed until Pivot Right bars have elapsed past it, both the pivot itself and any signal built from it only become visible on the chart after that many bars have passed — the resulting lines and labels are drawn retroactively onto a swing that has already formed. This is a structural characteristic of any confirmed-pivot Fibonacci tool rather than a flaw, but it does mean a signal never appears exactly at the live turning point; it appears with a short, deliberate confirmation delay.
The script contains no request.security() calls and references no higher-timeframe or future data, so outside of this inherent pivot-confirmation delay there is no forward-looking bias in the setup logic. Entry signals fire only on confirmed, closed bars, and once a signal and its levels are drawn they do not later shift to a different bar or disappear — they are only replaced outright when a new, opposite setup fires.
The DMA line's forward visual offset is a display convention matching the traditional presentation of a displaced moving average: the values plotted are ordinary trailing averages, simply drawn shifted to the right so the line visually tracks price with the same lag the trend filter itself uses internally. It is not a projection or forecast of future price.
🎨 Visual Guide
• Trade Level Lines and Labels
When a setup fires, five horizontal lines and their accompanying labels extend from the signal bar: the Stop (solid, thicker line), Entry (dashed), and the COP, OP and XOP objectives (dashed, drawn in progressively fuller shades of the same bullish or bearish color to reflect their increasing distance). All five lines automatically extend to the current bar while the trade remains open, and extend up to the closing bar once the trade is stopped out or reaches XOP.
• Fibonacci Node Reference Line
A dotted line marks whichever of the two retracement levels (38.2% or 61.8%) was not selected as the entry, shown for reference so the alternate level remains visible alongside the chosen one.
• Confluence Line
When a confluence zone is detected and the Confluence Line option is enabled, a dashed line marks the midpoint between the two agreeing Fibonacci levels from the primary and secondary swing grids.
• Merged Labels
When two or more levels land at the same price, their labels are merged into a single combined label (separated by a middle dot) instead of stacking overlapping duplicate labels, keeping the chart readable.
• Signal Markers
A "BULL" or "BEAR" label is plotted at the low or high of the firing bar respectively, colored to match the configured bullish or bearish color.
• Displaced Moving Average Line
The DMA is plotted in its configured color, shifted forward on the chart by the DMA Displace setting, matching the internal trend-filter reference described above.
• Live Dashboard Table
An on-chart table (position configurable to any corner) shows, row by row: symbol and timeframe, Lock status, current bias, which Fibonacci node is active, retracement depth as a ten-block progress bar with percentage, whether confluence was present, the Entry/Stop/COP/OP/XOP price levels, risk-to-reward expressed as a block bar scaled to 5R, progress toward OP as a block bar, current trade status (open, or which level was hit), the swing size, the current ATR value, and the number of bars elapsed since the last signal.
📖 How to Use
Wait for a "BULL" or "BEAR" marker and its accompanying level lines to appear; remember these will appear with the short pivot-confirmation delay described above rather than exactly at the swing extreme.
On a bullish setup, price will already be sitting in the retracement zone of the prior up-leg; the Entry line marks the DiNapoli-selected reference level, the Stop sits an ATR-buffered distance beyond the swing low, and COP/OP/XOP are staged, increasingly distant profit levels. Bearish setups mirror this on the downside.
Enable Confluence Required to restrict signals to setups where two independently measured Fibonacci grids agree — this produces fewer but more selectively filtered setups.
Leave the DMA Filter enabled to only take setups aligned with the displaced-average trend context, or disable it to see every structurally valid swing regardless of that bias.
Use Lock Signal on the real-time bar if you are already in a tracked trade and do not want a newly forming pivot to override the current levels mid-position.
Watch the dashboard's Status row and block-bar visualizations for a fast read of retracement depth, risk-to-reward, and progress toward the OP objective without needing to read exact prices.
Configure the Alerts group's action strings to match the JSON keys your webhook or automation platform expects, then use TradingView's "Any alert() function call" option to route long, short, close, objective-hit, and stop-hit events.
Treat the Stop, COP, OP and XOP levels as a structured framework for planning risk and staged exits, not as a guarantee that price will reach any particular level — always size positions according to your own risk tolerance.
⚙️ Inputs and Settings
• Core
Pivot Left / Pivot Right — number of bars required on each side of a candidate swing point before it is confirmed; larger values confirm more significant but slower-appearing swings.
Min Swing × ATR — minimum size, in ATR multiples, an A–B swing must have to be considered valid, filtering out noise-sized structures.
Max Retrace — the deepest retracement (as a fraction of the swing) still accepted as a valid pullback.
ATR Len — lookback period for the Average True Range used throughout the stop, minimum-swing, and confluence-tolerance calculations.
• Filters
DMA Filter — toggles the displaced-average trend requirement on entries.
DMA Len / DMA Displace — period and forward displacement of the trend-filter average.
Confluence Required — toggles whether a confluence zone is mandatory for a setup to fire.
Confluence Tol × ATR — maximum distance, in ATR multiples, between two Fibonacci levels for them to be treated as confluent.
• Trade Tools
Lock Signal — freezes the currently tracked setup on the real-time bar, blocking new signals from overriding it.
Stop Buffer × ATR — distance, in ATR multiples, the stop is placed beyond pivot C.
• Visuals
Fibnodes — shows or hides the unused Fibonacci reference node line.
Confluence Line — shows or hides the confluence-zone line.
Signal Markers — shows or hides the BULL/BEAR labels.
DMA Line — shows or hides the displaced moving average plot.
• Dashboard
Show Dashboard — toggles the on-chart table.
Position — selects which chart corner hosts the dashboard.
• Alerts
Long / Short Action, Close Long / Close Short Action — the "action" values sent in the JSON payload for entries and exits.
COP / OP / XOP Action, Stop Action — the "action" values sent when each objective or the stop is hit.
• Colors
Individual color controls are provided for the bullish and bearish themes, stop, entry, each of the three objectives, both Fibonacci nodes, the confluence line, the DMA line, label text, the dashboard's three-tier progress-bar shading, and the dashboard's header, background, and text colors, allowing the full visual theme to be adapted to any chart background.
🔍 Deconstruction of the Underlying Scientific and Academic Framework
The core methodology follows Joe DiNapoli's published approach from "Trading with DiNapoli Levels" (1998), which combines a displaced moving average for trend context with Fibonacci retracement levels for entry timing and a three-tier set of Fibonacci expansion objectives — the Contracted, standard, and Expanded Objective Points — for profit projection. The script's DMA filter and COP/OP/XOP target structure are direct implementations of that framework.
The use of Fibonacci ratios in price analysis traces back to the Fibonacci sequence itself (Leonardo of Pisa, 13th century) and its adoption into market analysis through Ralph Nelson Elliott's wave theory and W.D. Gann's work on proportional price relationships, later formalized by DiNapoli into a discrete, rules-based entry and objective framework.
Swing-point identification via a confirmed left/right bar window reflects the standard swing-high/swing-low definition used broadly across technical analysis, closely related to the fractal concept popularized by Bill Williams, and provides an objective, repeatable substitute for discretionary chart reading.
Average True Range, developed by J. Welles Wilder, supplies the volatility-normalized basis for the stop distance and minimum-swing filter, allowing the same input values to scale automatically across instruments and volatility regimes rather than relying on fixed point or pip distances.
The confluence-detection logic reflects the broader "cluster" or "confluence zone" concept found throughout Fibonacci-based technical analysis: treating agreement between two independently derived retracement grids as a stronger signal than either grid considered alone, a filtering approach explicitly discussed within DiNapoli's own writings on Fibonacci analysis.
⚠️ Disclaimer
All provided scripts and indicators are strictly for educational exploration and must not be interpreted as financial advice or a recommendation to execute trades. We expressly disclaim all liability for any financial losses or damages that may result, directly or indirectly, from the reliance on or application of these tools. Market participation carries inherent risk where past performance never guarantees future returns, leaving all investment decisions and due diligence solely at your own discretion. Indikator
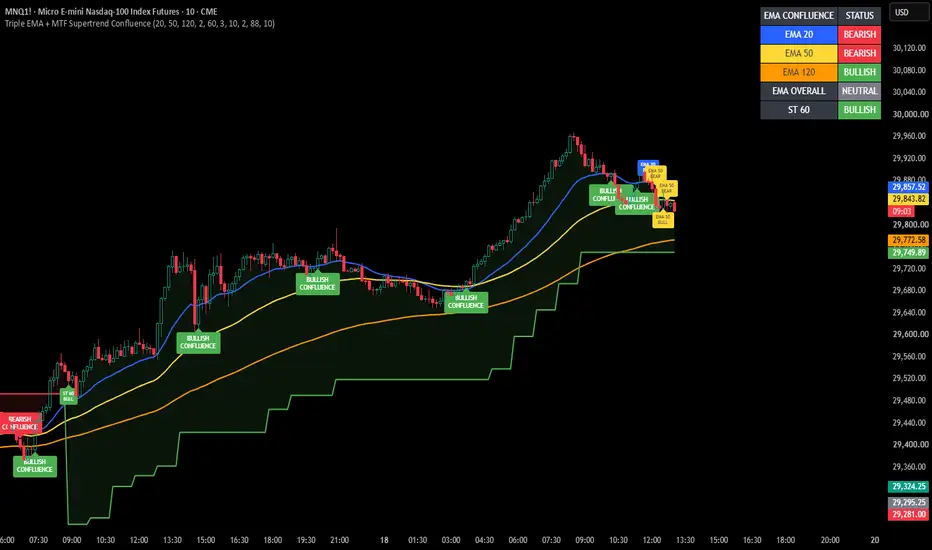
Triple EMA MTF Supertrend ConfluenceTriple EMA & Multi-Timeframe Supertrend Confluence is a technical analysis indicator designed to help traders identify market direction, trend changes, and potential areas of alignment across multiple moving averages.
The indicator features three fully adjustable Exponential Moving Averages (EMAs), with default settings of 20, 50, and 200. Each EMA is displayed using a distinct colour and generates individual bullish and bearish flip labels when price moves across the respective EMA.
The indicator also includes a configurable Multi-Timeframe Supertrend, allowing traders to monitor higher-timeframe trend direction while analysing lower-timeframe price action. The Supertrend is displayed with colour-coded bullish and bearish lines, together with optional shaded areas extending between the Supertrend line and the candles.
A confluence dashboard provides a clear overview of each EMA's current direction, overall EMA alignment, and Supertrend status. When all three EMAs align bullishly or bearishly, the indicator displays a confluence label and provides corresponding alert conditions.
Individual EMA flip labels include an optional expiry feature, allowing traders to automatically remove older labels after a selectable number of candles. This helps maintain a cleaner and more organised chart.
Key Features:
• Three adjustable EMAs with individual colour coding
• Bullish and bearish EMA flip labels
• Configurable Multi-Timeframe Supertrend
• Bullish green and bearish red Supertrend shading
• EMA confluence detection
• Real-time trend status dashboard
• Optional Supertrend flip labels
• Selectable individual EMA label expiry
• Alert conditions for EMA flips, Supertrend flips, and EMA confluence
This indicator is intended as a visual decision-support tool. It does not guarantee trading results and should be used alongside appropriate risk management and independent market analysis. Indikator
THMATHMA MTF
This indicator plots the Triangular Hull Moving Average (THMA), a smooth and responsive moving average based on the Hull concept. The formula follows the standard THMA definition used across multiple public TradingView scripts and libraries:
THMA = WMA( 3*WMA(src, L/3) - WMA(src, L/2) - WMA(src, L), L )
The idea behind THMA comes from the broader Hull Moving Average family, adapted with a triangular weighting scheme to reduce lag while keeping the line smooth. This implementation is my own Pine Script version, built from publicly available documentation and open-source THMA scripts on TradingView.
Features:
- Source and length are configurable (default length: 21).
- Line color changes depending on price position:
- Green when close is above THMA.
- Red when close is below THMA.
- Optional higher timeframe mode: you can calculate THMA on a higher timeframe (e.g., 5 min, 15 min, 1h) and display it on your current chart.
Use it as a trend filter or dynamic support/resistance level. As with any indicator, it’s best combined with your own price action and risk management rules. Indikator

Smart AVWAPs## Smart AVWAPs
Smart AVWAPs is a multi-anchored VWAP indicator designed for swing traders who want to identify areas where several important volume-weighted price levels converge.
Instead of anchoring VWAPs to every minor swing, the indicator automatically creates AVWAPs from selected high-importance events:
* High relative volume swing highs and lows
* Earnings gaps
* 52-week highs and lows
* Major reversal candles with elevated volume
The indicator keeps the most recent active AVWAPs on the chart, making it easier to visually identify price zones where multiple anchored VWAPs overlap or compress.
### How to Use
AVWAP convergence can highlight areas where participants anchored to different market events have similar volume-weighted cost bases.
For swing trading, these areas can be monitored as potential support, resistance, consolidation, or breakout zones.
A typical workflow is:
1. Look for several AVWAPs converging within a narrow price range.
2. Observe how price behaves around the convergence area.
3. Wait for confirmation such as a strong breakout, reclaim, increased relative volume, or successful retest.
4. Use broader trend, market structure, and risk management before taking a position.
AVWAP convergence itself is not intended to be an automatic buy or sell signal.
### Inputs
**Active AVWAPs**
Controls the maximum number of recent AVWAP anchors displayed.
**Pivot Left / Right**
Controls the sensitivity of swing-high and swing-low detection.
**Minimum RVOL**
Requires a swing or reversal candle to have elevated volume relative to its recent average.
**Earnings Gap %**
Defines the minimum price gap required for an earnings event to create an anchor.
**Reversal ATR**
Controls how large a reversal candle must be relative to ATR before it qualifies as a significant anchor.
### Intended Use
The indicator is primarily designed for daily-chart swing trading, but the settings can be adjusted for other timeframes and trading styles.
It is best used as a visual confluence tool rather than as a standalone trading system.
For research and educational purposes only. This indicator does not provide financial advice or guarantee future mar
Indikator

Indikator

Indikator

PipSchool What it does
PipSchool marks the London and New York trading sessions on the chart and overlays three moving averages with a trend-bias reading, so a beginner can see when the market is active and which way it is leaning from a single script instead of loading four separate ones.
Sessions
London and New York toggle on and off independently.
Two display modes: background shading across the full session, or a filled box bounded by the session's high and low. Switch with the Activate High/Low View checkbox.
Session highs and lows build live — the first bar of a session resets the level, and every bar after that extends the running high or low. No repainting of closed bars.
Session times are editable. Defaults are 03:00–12:00 for London and 08:00–17:00 for New York, anchored to the America/New_York timezone, so they hold through daylight-saving shifts without manual adjustment.
Moving averages
EMA 9 and EMA 21 — short-term momentum and the faster of the two crossover signals.
SMA 200 — the longer-term trend filter.
Each has its own Length, Source and Offset inputs plus an on/off switch, and its own colour, width and line style in the Style tab.
Trend bias label
A small on-chart panel reads the moving averages and summarises the picture in plain language: price above or below the SMA 200, the current EMA 9 / EMA 21 relationship, and a combined structure read — Bullish structure, Bearish structure, or Mixed structure — coloured green, red or grey.
How to use it
Use the sessions to decide when you look for trades. The London and New York windows carry most of the day's volume, and a session high or low is a natural reference for a stop or a break level. Use the moving averages to decide which direction you look. The bias label is a summary of what the MAs already show — it is a structure read, not an entry signal, and there are deliberately no buy/sell arrows.
Notes
The SMA 200 needs 200 bars of history before it plots, so it will be blank at the left edge of short intraday charts. That is expected.
Indikator

PipSchoolWhat it does
PipSchool marks the London and New York trading sessions on the chart and overlays three moving averages with a trend-bias reading, so a beginner can see when the market is active and which way it is leaning from a single script instead of loading four separate ones.
Sessions
London and New York toggle on and off independently.
Two display modes: background shading across the full session, or a filled box bounded by the session's high and low. Switch with the Activate High/Low View checkbox.
Session highs and lows build live — the first bar of a session resets the level, and every bar after that extends the running high or low. No repainting of closed bars.
Session times are editable. Defaults are 03:00–12:00 for London and 08:00–17:00 for New York, anchored to the America/New_York timezone, so they hold through daylight-saving shifts without manual adjustment.
Moving averages
EMA 9 and EMA 21 — short-term momentum and the faster of the two crossover signals.
SMA 200 — the longer-term trend filter.
Each has its own Length, Source and Offset inputs plus an on/off switch, and its own colour, width and line style in the Style tab.
Trend bias label
A small on-chart panel reads the moving averages and summarises the picture in plain language: price above or below the SMA 200, the current EMA 9 / EMA 21 relationship, and a combined structure read — Bullish structure, Bearish structure, or Mixed structure — coloured green, red or grey.
How to use it
Use the sessions to decide when you look for trades. The London and New York windows carry most of the day's volume, and a session high or low is a natural reference for a stop or a break level. Use the moving averages to decide which direction you look. The bias label is a summary of what the MAs already show — it is a structure read, not an entry signal, and there are deliberately no buy/sell arrows.
Notes
The SMA 200 needs 200 bars of history before it plots, so it will be blank at the left edge of short intraday charts. That is expected.
Open-source. Read the code, change the defaults, build on it.
Indikator

Indikator

Indikator

Fib Grid Bias & BreakoutBuilds a supply/demand grid from the overnight session rather than from swing structure. The idea is that the 18:00–00:00 ET window is where the market sets its reference range for the next day — the levels that matter are the ones institutions established overnight, not the ones a swing detector happens to pick up.
The three phases.
Building — from 18:00 ET, the indicator tracks the running high and low of every bar in the window. The range expands as the night goes.
Freeze — at midnight ET the range locks. Those two prices become the anchor for the whole next session.
Hold — through the following day, the frozen range is projected forward as a level grid.
Weekends. Friday 18:00 through Sunday 18:00 the grid stays blank. Carrying Friday's levels into a Sunday open is worse than having none — the gap invalidates them.
Thin-range padding. If the overnight range is too narrow to be useful (a quiet holiday session, say), the indicator pads it symmetrically to a minimum span around the midpoint. This keeps the grid from collapsing into a single line.
Reload robustness. If you load the chart mid-session — after the freeze has already happened — the indicator scans back through history to recover the overnight range instead of falling back to swing levels. Without this, a reload during the day would silently give you a different grid than the one you had open overnight.
Reading the row. The status line tells you which state you're in: Building, Frozen, or blank (weekend). If it says Frozen and the levels sit near the overnight range, it's working.
Example for students
Scenario. It's 18:00 ET on a Tuesday. ES is trading at some price P.
18:00–00:00 — Building. Price drifts between P − 8 and P + 11. The indicator's running high is P + 11, running low is P − 8. The row reads Building.
00:00 — Freeze. The range locks at P − 8 / P + 11. A 19-point range. The row flips to Frozen.
Wednesday session — Hold. The grid projects P − 8 and P + 11 forward. Price opens at P − 2, rallies to P + 9 — stalls just under the frozen high. That stall is the tradeable information: the overnight high is acting as resistance.
Why this beats a swing detector. A swing-based indicator would have drawn resistance at whatever the last local peak happened to be — maybe P + 6, maybe P + 14, depending on the lookback. The overnight anchor gives you one specific, non-arbitrary number that every participant watching the same session can see. That's what makes it a level rather than a line.
The teaching point. Levels aren't magic prices — they're places where a shared reference exists. The overnight range is shared because everyone watched the same window. That's the whole thesis. Indikator

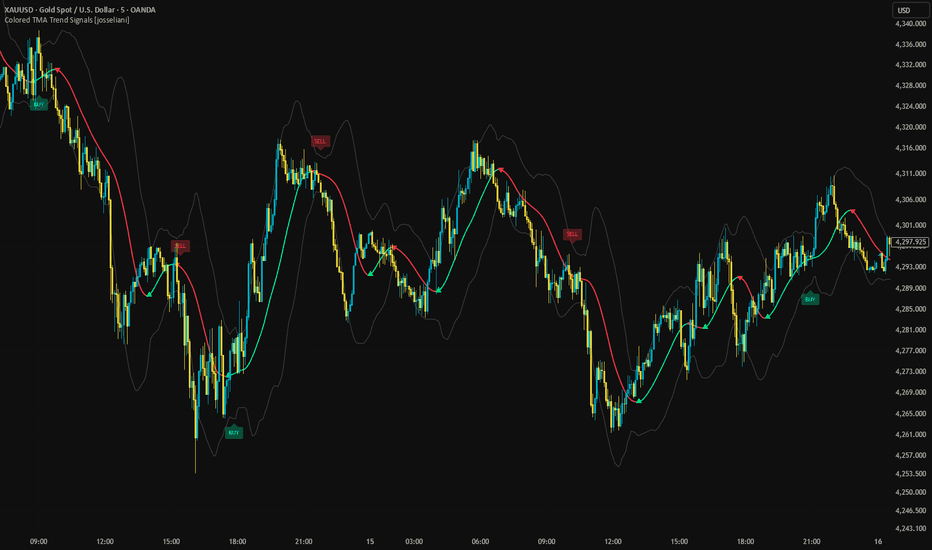
Colored TMA Trend Signals [josseliani]This is a very simple indicator for beginners in trading, based on the popular Triangular Moving Average.
I wanted to keep it simple: minimal settings, clear visuals, and easy-to-understand trade logic.
TMA color-change signals are popular, but there is one thing I wanted to improve. Sometimes, by the time TMA changes direction, price has already moved quite far away from the average. The turn is there, but entering is already uncomfortable: price is stretched, and the potential stop becomes too large.
So I added a simple candle-close confirmation engine instead of using every color change as an entry.
→ THE TMA
TMA is a Triangular Moving Average, calculated here using two consecutive simple moving averages of the same length.
Green → TMA is rising.
Red → TMA is falling.
A basic standard-deviation channel surrounds it. Optional EMA smoothing can be applied to the price source.
Small triangles mark confirmed changes between rising and falling TMA direction. They show the turn itself; BUY/SELL uses a separate confirmation.
→ BUY/SELL CONFIRMATION
For BUY, the indicator counts consecutive candle closes above the selected level. For SELL, it counts consecutive closes below it.
The default is three candles, with TMA as the confirmation level.
You can also select Bands:
• BUY → closes above the upper band.
• SELL → closes below the lower band.
Each close is compared with the level calculated on that candle.
The important detail is that the candle counters run independently of the TMA color change.
Confirmation is checked exactly on the selected Nth close — the third close by default. If the direction and signal-limit conditions do not allow a signal then, that confirmation is not reused on later candles.
The sequence must reset and form again.
For example, if price has already closed above TMA for more than three consecutive candles before TMA turns green, the earlier confirmation is not reused. Price must first close at or below TMA, then form three consecutive closes above it again.
If TMA turns green on the third close, BUY can appear together with the triangle. SELL follows the same logic in the opposite direction.
This was my simple way of skipping some entries where the move had already started before TMA turned. The script does not measure the distance from price to TMA, so a fresh confirmation can still appear far from the average.
→ ONE SIGNAL PER COLOR
With the default settings:
• A confirmed turn to green unlocks one BUY and blocks SELL.
• A confirmed turn to red unlocks one SELL and blocks BUY.
The first eligible confirmation produces the signal.
After BUY, another BUY is blocked until TMA turns red and then green again. After SELL, another SELL is blocked until it turns green and then red again.
A color section can also have no signal if the conditions are not met.
Disabling One Trade Per Color allows further signals after new confirmation sequences form. Its directional restrictions remain active while it is enabled, even if Only With TMA Trend is disabled.
→ HOW I USE IT
For me, the small triangle is simply information: TMA has changed direction.
BUY/SELL is a separate trade signal.
I made this mainly for people who are just starting to work with the market and do not want to immediately dive into complicated strategies and lots of settings.
It is basically ordinary trading with a moving average, just visualized a little more conveniently.
You can leave the default settings and watch the TMA direction and the confirmed BUY/SELL signals.
This is not a complete trading system. The trader still decides whether an entry makes sense at the current price and determines the stop, target, position size and risk management.
→ INPUTS
• Half Length → TMA smoothing length. Default: 12. The double-SMA calculation has an effective length of 2 × Half Length − 1, or 23 by default.
• Price Source → selects the calculation price. The default Weighted Price is (High + Low + 2 × Close) / 4.
• Band Deviation → standard-deviation multiplier controlling channel width. Default: 2.0. Standard deviation uses the selected source and the effective TMA length.
• Use Source Smoothing → optional EMA smoothing before calculating TMA and the channel. Disabled by default.
• Smoothing Period → optional EMA length. Default: 12.
• Show Bands → shows or hides the channel.
• Show TMA Color-Change Signals → shows or hides the triangles without disabling their alerts.
• TMA Line Width → adjusts line thickness.
• Show BUY/SELL Labels → shows or hides trade labels without disabling trade calculations or alerts.
• Break Level → selects TMA or Bands for confirmation.
• Confirm Bars → required consecutive closes, from 1 to 10. Default: 3. Confirmation is checked exactly on the selected Nth close.
• Only With TMA Trend → allows BUY only while TMA is rising and SELL only while it is falling. Enabled by default.
• One Trade Per Color → applies the directional signal limits explained above. Enabled by default.
Label spacing uses ATR and the candle range. It is only visual and does not change the signal candle or trading logic.
→ WHAT I ADDED AND WHY
TMA and standard-deviation bands are established calculations. My addition is the confirmation and signal-handling logic around them:
• Separate markers for TMA turns and BUY/SELL confirmations.
• Candle-close counters independent of color changes.
• Confirmation checked on the exact Nth close, without reusing a blocked confirmation later.
• One eligible signal per matching color turn.
• A choice of TMA or bands as confirmation levels.
• Separate alerts independent of marker visibility.
The purpose is to distinguish a moving-average turn from a confirmed price sequence while keeping the visual presentation and trading logic simple.
→ ALERTS
• TMA Bullish Color Change
• TMA Bearish Color Change
• Any TMA Color Change
• Trade Long
• Trade Short
• Any Trade Signal
All signal conditions require a closed candle. Select Once Per Bar Close when creating alerts.
→ CONFIRMATION AND LIMITATIONS
Triangles and BUY/SELL signals appear on the confirmation candle after it closes. They are not shifted into the past. The first established TMA direction does not produce a turn triangle, and unchanged TMA values preserve the last direction for turn detection.
The line, its color and the channel can change while the current candle is open. The calculation uses no future bars or higher-timeframe requests.
TMA and candle confirmation introduce delay. Signals can arrive late, sideways markets can produce unsuccessful signals, and a sequence reset does not guarantee an entry close to TMA.
Use standard time-based candles. This is an indicator, not a backtested strategy; it does not calculate trade results or a verified win rate.
Indikator
EWMAC Trend Signals [QuantAlgo]🟢 Overview
The EWMAC Trend Signals is a trend-following indicator built on exponentially weighted moving average crossovers (EWMAC), a staple trend rule in systematic futures trading. In that setting, the rule typically runs across many markets at several speeds at once. Each reading is divided by volatility, so a trend's strength, not just its direction, sets how much exposure to take. That design is why it anchors this indicator: fast speeds respond to new trends sooner, slow speeds stay with longer ones, and volatility scaling keeps readings comparable from quiet stock indices to volatile crypto. Up to six EWMAC speeds blend into one trend score that drives bullish, bearish, and neutral signals through a hysteresis band, so traders can follow established trends through shallow pullbacks on any asset and any interval.
🟢 How It Works
Each EWMAC rule compares a fast EMA with a slow EMA spanning four times as many bars, so the gap between them widens as a trend develops and narrows as it fades. To give that gap the same meaning on any market, it is divided by a volatility unit built from the standard deviation of log returns, blended with a share of its long-run average. The result is rescaled to target an average absolute score of 10, either adaptively from the rule's own recent history or from a fixed factor based on its span. It is then capped to limit how far any single speed can pull the blend:
ewmacRule(float src, simple int fastLen, float riskUnit, simple int scaleLen, bool adaptive, float cap) =>
float fastMa = ta.ema(src, fastLen)
float slowMa = ta.ema(src, fastLen * 4)
float raw = (fastMa - slowMa) / math.max(riskUnit, 0.0000000001)
float avgAbs = ta.sma(math.abs(raw), scaleLen)
float fixedScale = 15.0 / math.sqrt(fastLen)
float scaleFactor = adaptive and not na(avgAbs) ? 10.0 / math.max(avgAbs, 0.0000000001) : fixedScale
float score = math.max(math.min(raw * scaleFactor, cap), -cap)
float midpoint = (fastMa + slowMa) / 2.0
Up to six rules run at geometrically spaced speeds, from 2/8 through 64/256 bars by default, and their scores are combined by weight into a single trend score. Averaging partially correlated rules shrinks the result, so a diversification multiplier restores the scale based on how many rules are active, or a manual value. The same weights average each rule's EMA midpoint into the trend line plotted on price:
float divMultiplier = multiplierIn > 0.0 ? multiplierIn : multiplierTable
float trendScoreRaw = weightSum > 0.0 ? scoreSum / weightSum * divMultiplier : 0.0
float trendScore = math.max(math.min(trendScoreRaw, scoreCap), -scoreCap)
float trendLine = weightSum > 0.0 ? lineSum / weightSum : srcSafe
The trend score then drives the signals. A bullish signal confirms when the score rises above the entry threshold, and a bearish signal confirms when it falls below the negative threshold. The exit level sits at a fraction of the entry threshold, forming a hysteresis band. With the neutral state enabled, a signal holds while trend strength eases and releases to neutral only once the score fades back through that level:
float exitTh = entryTh * exitFrac
var int signalState = 0
if barstate.isconfirmed
if trendScore > entryTh and signalState != 1
signalState := 1
else if trendScore < -entryTh and signalState != -1
signalState := -1
else if useNeutral and signalState == 1 and trendScore < exitTh
signalState := 0
else if useNeutral and signalState == -1 and trendScore > -exitTh
signalState := 0
🟢 Signal Interpretation
▶ Bullish Trend (Green/Bullish palette): When the trend score rises above the entry threshold on a confirmed bar, the indicator enters bullish mode. Bullish coloring applies across the trend line, neon glow, signal readout, price bars, and optional background. The signal holds while the score stays above the exit level, so pullbacks that only ease trend strength pass without releasing it. With the neutral state disabled, it holds until a bearish signal confirms. Trend traders can read the turn into bullish as a long bias or continuation cue, with the trend line as a dynamic reference for the prevailing trend.
▶ Bearish Trend (Red/Bearish palette): When the trend score falls below the negative entry threshold on a confirmed bar, the indicator enters bearish mode with bearish coloring across all visual elements. The signal holds while the score stays below the negative exit level. With the neutral state disabled, it holds until a bullish signal confirms. Trend traders can read the turn into bearish as a short bias or a cue to exit long exposure.
▶ Neutral (Gray/Neutral palette): With Use Neutral State enabled, a bullish or bearish signal releases to neutral once the trend score fades back through the exit level. This marks a trend that has lost strength without a confirmed reversal. Neutral also covers the warm-up period before the first signal confirms. Trend traders can use neutral phases to stand aside or manage open positions until the score commits to a direction again.
🟢 Features
▶ Preconfigured Presets: Three parameter sets cover different trading approaches. "Default" uses the manual settings, starting with Rules 2 to 5 active and a moderate entry threshold for swing trading on 4-hour and daily charts. "Fast Response" activates Rules 1 to 4, shortens the volatility and scaling windows, lowers the entry threshold, and narrows the hysteresis band. It suits intraday charts from 5-minute to 1-hour, where earlier signals matter more than fewer flips. "Smooth Trend" activates Rules 4 to 6, lengthens the volatility and scaling windows, raises the entry threshold, and widens the hysteresis band. It suits position trading on daily and weekly timeframes, where false signals are more costly than delayed ones. Selecting a preset overrides the active rules along with the corresponding volatility, scaling, and signal inputs.
▶ Built-in Alerts: Four alert conditions cover every signal change. "Bullish Trend Signal" fires on the confirmed bar where the signal turns bullish. "Bearish Trend Signal" fires on the confirmed bar where it turns bearish. "Neutral Trend Signal" fires when a bullish or bearish signal releases to neutral. "Trend Signal Changed" combines all three into a single condition for traders who want one notification for any change. Alerts continue to work even when the signal readout is hidden.
▶ Visual Customization: Six color presets (Classic, Aqua, Cosmic, Cyber, Neon, and Custom) apply coordinated bullish and bearish color schemes across the trend line, neon glow, signal readout, and bar and background coloring. Custom also lets you set the neutral color. The trend line offers an adjustable width and an optional neon glow effect. The signal readout labels the active signal as Bullish, Bearish, or Neutral at the end of the trend line in a selectable text size. Bar coloring tints price candles with the active signal color at a configurable transparency level, and background coloring extends that tint across the full chart pane.
Indikator

Indikator

ATR Percentile Bands [TradingFinder] Dynamic Extremes🔵 Introduction
Financial markets constantly move between calm conditions and periods of rapid price expansion. A market may trade close to its average for several sessions and then suddenly move into an extreme price zone as volatility increases. In these moments, traders need more than a fixed channel or a standard volatility indicator.
The ATR Percentile Bands indicator combines Average True Range (ATR), historical price deviation, and percentile analysis to identify dynamic upper and lower bands directly on the price chart. By adapting to both current volatility and historical market behavior, the ATR Percentile Bands indicator helps traders recognize normal price movement, unusual price extensions, and potential reversal zones more clearly.
Unlike traditional ATR bands that calculate band width using only current volatility, this dynamic volatility indicator compares the smoothed ATR distance with the 95th percentile of price deviations from a selected moving average. The indicator then uses the larger value to create adaptive price bands that respond to changing market conditions. A customizable EMA, SMA, RMA, WMA, or HMA forms the central moving average, while multi-layer upper and lower ribbons highlight bullish and bearish extreme zones.
When price approaches the upper percentile band, the market may be experiencing unusually strong buying pressure; when price reaches the lower percentile band, selling pressure may have pushed the market into a historically extended area. These volatility bands do not define guaranteed overbought or oversold levels, but they provide a structured framework for analyzing price extremes, mean-reversion opportunities, trend continuation, and volatility expansion.
Imagine price falling sharply toward the lower ATR Percentile Band. The first touch may attract attention, but the indicator does not immediately display a Buy Signal. Instead, its three-stage confirmation engine waits for a bullish candle to reject the lower inner band and then monitors the following candles for continued bullish confirmation. The same process works in reverse for a potential Sell Signal near the upper band. This confirmation-based logic helps filter weak reactions and reduces signals created by simple band contact.
A live information dashboard also displays the current Signal, Price Zone, Trend, Nearest Band, Volatility, and Next Action, allowing traders to understand the complete market context at a glance. As a result, ATR Percentile Bands can support forex trading, cryptocurrency analysis, stock trading, indices, commodities, scalping, day trading, and swing trading across different markets and timeframes.
🔵 How to Use
This volatility-based trading indicator helps traders understand where price is positioned relative to its moving average, current market volatility, and historical price deviations. After adding the indicator to the chart, traders should first examine the central moving average and the upper and lower percentile bands. Price movement between the two inner bands represents a relatively normal market condition, while movement inside the upper or lower ribbon indicates that price is entering an extended zone.
A close above the outer upper band is displayed as Above Upper Band, while a close below the outer lower band is classified as Below Lower Band. These extreme price zones can highlight increased buying or selling pressure, but touching an ATR Percentile Band does not automatically create a Buy Signal or Sell Signal.
Before evaluating a trading signal, traders should review the live dashboard and combine Price Zone, Trend, Nearest Band, and Volatility information. The Trend column shows whether price and the moving average currently support a Bullish, Bearish, or Sideways condition. Nearest Band indicates which inner ATR band is closer to price, while Volatility compares the current ATR with its historical range.
After price reaches an extreme band, the Signal and Next Action columns can be used to follow the confirmation process. The indicator requires a three-stage candle sequence before publishing a Long or Short Signal, helping separate a simple band touch from a confirmed price reaction. All signal decisions are registered after candle closure, so traders should wait for the active candle to close before interpreting the final signal.
🟣 Buy Signal
A potential Buy Setup begins when price moves down to the Lower Inner Band and then shows a valid bullish rejection. The first candle must satisfy three conditions simultaneously: its low must touch or move below the Lower Inner Band, its closing price must return above the Lower Inner Band, and it must close as a bullish candle with the Close above the Open.
The initial Buy Setup conditions are : A valid Buy Setup requires the candle’s low to touch or move below the Lower Inner Band. The price must then recover and close above the Lower Inner Band, while the closing price must also remain above the opening price to confirm that the candle is bullish.
When these conditions are confirmed at candle close, the ATR Percentile Bands indicator does not immediately display a Long Signal. Instead, it saves the bullish setup and sets the confirmation counter to one. At this stage, the dashboard displays Buy Setup, while the Next Action column changes to Wait for Buy. This tells the trader that a bullish reaction has been detected near the lower percentile band, but the complete three-candle confirmation sequence has not yet formed.
The second confirmation candle does not need to touch the Lower Inner Band again. It only needs to remain bullish and close above the Lower Inner Band. If these conditions are satisfied, the confirmation counter advances from one to two. The third candle must repeat the same continuation conditions: it must close above its opening price and remain above the Lower Inner Band. Once the third bullish confirmation is completed, the indicator publishes the Long Signal on the third candle.
After confirmation, the Signal column displays Buy Signal, and Next Action changes to Buy Confirmed. The final Long marker may appear several candles away from the original contact with the lower band because only the first candle must directly reject the extreme zone. The second and third candles are continuation confirmations and are not required to interact with the band again.
A pending Buy Setup is cancelled if a following candle is not bullish and does not remain above the Lower Inner Band. If a valid bearish setup forms while the indicator is waiting for bullish confirmation, the signal engine switches direction, cancels the previous Buy Setup, and begins counting the new Sell Setup from one. After a Long or Short Signal is published, the Signal Gap setting prevents another setup from beginning until the selected number of candles has passed. The default Signal Gap is 10 candles.
For a more structured bullish analysis, traders can combine the Buy Signal with the following conditions :
Price has reacted from the Lower Inner Band or Lower Outer Band;
Price Zone shows Lower Band or Below Lower Band;
Trend is Bullish or begins shifting from Bearish toward Sideways or Bullish;
Volatility is suitable for the trader’s strategy and risk tolerance;
The bullish reaction occurs near support, demand, liquidity, or a significant market structure level;
The completed Long Signal provides an acceptable stop-loss distance and risk-to-reward ratio.
A Buy Signal represents a confirmed bullish reaction within the indicator’s internal logic. It does not guarantee that the market has reached its final low or that an upward trend will continue. In a strong bearish market, price can repeatedly interact with the lower ATR bands. Traders should therefore evaluate the Long Signal together with market structure, volume, trend direction, higher-timeframe context, and risk management.
🟣 Sell Signal
A potential Sell Setup begins when price moves up to the Upper Inner Band and then produces a valid bearish rejection. The first candle must meet three conditions at the same time: its high must touch or move above the Upper Inner Band, its closing price must return below the Upper Inner Band, and it must close as a bearish candle with the Close below the Open.
The initial Sell Setup conditions are : The bearish sequence starts when price pushes into or beyond the Upper Inner Band but fails to hold at that level. If sellers regain control before the candle closes, price returns below the band and finishes beneath its opening value. This rejection activates the initial Sell Setup and starts the confirmation process.
Once these conditions are confirmed after candle closure, the indicator saves the bearish setup and sets the confirmation counter to one. It does not publish a Short Signal on the first rejection candle. During this stage, the dashboard displays Sell Setup, while the Next Action column shows Wait for Sell. The first rejection identifies a possible bearish response from the upper extreme zone, but two additional confirmations are still required.
The second confirmation candle must be bearish and must close below the Upper Inner Band. It does not need to touch the upper band again. When both continuation conditions are satisfied, the bearish counter increases from one to two. The third candle must also close below its opening price and remain below the Upper Inner Band. After the third bearish confirmation closes, the indicator displays the final Short Signal.
At confirmation, the Signal column changes to Sell Signal, and Next Action displays Sell Confirmed. Because the final Short marker belongs to the third confirmation candle, it may not appear directly at the original upper-band rejection. This distance is a normal result of the three-stage confirmation model and does not indicate delayed calculation or repainting.
The Sell Setup is cancelled when the following candle fails to maintain the required bearish continuation and no valid opposite setup is created. If a valid bullish rejection develops while the indicator is waiting for bearish confirmation, the existing Sell Setup is cancelled, the signal direction changes to Buy, and the bullish confirmation counter begins from one. The configured Signal Gap is applied after every published signal to reduce clusters of nearby Long and Short signals.
For a more complete bearish analysis, traders can evaluate the Sell Signal alongside these conditions :
Price has rejected the Upper Inner Band or Upper Outer Band;
Price Zone displays Upper Band or Above Upper Band;
Trend is Bearish or begins changing from Bullish toward Sideways or Bearish;
The upper band overlaps resistance, supply, liquidity, or an important market structure level;
Market volatility is compatible with the selected stop loss and position size;
The confirmed Short Signal offers a reasonable risk-to-reward structure.
A Sell Signal confirms a bearish reaction according to the ATR Percentile Bands signal engine, but it should not be interpreted as proof that price has formed a permanent top. During powerful bullish trends, price may remain close to the upper volatility band or repeatedly move beyond it. Traders should use the Short Signal as analytical confirmation and assess the wider trend, market structure, volume, news conditions, stop loss, and capital management before making a trading decision.
🔵 Settings
Moving Average Type : Defines the calculation method used for the central moving average. Traders can select EMA, SMA, RMA, WMA, or HMA. EMA is selected by default and responds relatively quickly to recent price changes, while smoother average types can create a more stable band structure.
Moving Average Period : Determines how many candles are included in the central moving average calculation. The default value is 50. A shorter period makes the moving average and dynamic bands react faster to price movement, while a longer period creates a smoother structure with slower changes.
ATR Period : Sets the number of candles used to calculate the Average True Range. The default ATR Period is 14. Lower values respond more quickly to short-term volatility, whereas higher values provide a smoother measurement of market volatility.
ATR Multiplier : Controls the ATR-based distance between the central moving average and the outer volatility bands. Its default value is 2.8. Increasing the ATR Multiplier moves the bands farther from price and can reduce the number of band interactions. Decreasing it creates tighter bands and may produce more frequent setups in volatile or fast-moving markets.
Smooth Period : Specifies the smoothing period applied to the ATR and the final band distance. The default value is 5. A lower Smooth Period makes the ATR Percentile Bands more responsive, while a higher value reduces sudden changes and creates smoother upper and lower ribbons.
Signal Gap : Determines the minimum number of candles required between two published signals. The default Signal Gap is 10 bars. Increasing this value creates more separation between Long and Short Signals, while setting it to zero removes the mandatory waiting period.
Moving Average : Shows or hides the central moving average on the price chart. Disabling this option removes the line from view without changing the calculations of the upper and lower ATR Percentile Bands.
Signals : Controls the visibility of Long and Short markers on the chart. Turning this setting off only hides the signal symbols; the internal signal engine and configured TradingView alerts continue to operate normally.
Show Table : Displays or hides the live information dashboard. The table summarizes the current Signal, Price Zone, Trend, Nearest Band, Volatility, and Next Action.
Table Size : Changes the text size of the dashboard. Available options include Tiny, Small, Normal, and Large, allowing the table to fit different chart layouts and screen sizes.
Table Position : Selects the dashboard location on the chart. The table can be placed in any of the nine standard positions: Top Left, Top Center, Top Right, Middle Left, Center, Middle Right, Bottom Left, Bottom Center, or Bottom Right.
Alert : Enables or disables the dynamic alert messages generated by the indicator. When this option is active, traders can create TradingView alerts for confirmed Long and Short Signals.
Message Frequency : Determines how frequently the indicator is allowed to send an alert message. All sends every valid event, Once Per Bar limits notifications to one event per candle, and Once Per Bar Close sends the alert only after the candle has closed. Once Per Bar Close is the default option and is the most consistent choice for the confirmed-candle signal logic.
🔵 Conclusion
The ATR Percentile Bands indicator combines current market volatility with historical price deviation to create adaptive upper and lower bands around a customizable moving average. By comparing the smoothed ATR distance with the 95th percentile of recent price deviations, the indicator adjusts its band width as market conditions change. The multi-layer ribbons highlight normal price movement, extended price zones, and unusually strong deviations, while the live dashboard summarizes Signal, Price Zone, Trend, Nearest Band, Volatility, and Next Action in one view.
Its three-stage confirmation system separates a simple band interaction from a confirmed bullish or bearish reaction. Long and Short Signals are published only after the required candle sequence is completed, helping traders evaluate price rejection with greater context. These signals should be combined with market structure, trend direction, volume, support and resistance, higher-timeframe analysis, and risk management. As an adaptive volatility and price-extreme analysis tool, the indicator can support forex, cryptocurrency, stock, index, and commodity traders across scalping, intraday, and swing-trading strategies.
Indikator

XGBoost Mini Strategy [The Quant Science]This strategy implements a predictive XGBoost machine learning system using our proprietary XGBoostMini library. It's a simple test to demonstrate how to use the library within a strategic framework. Notably, with just a few lines of Pine Script, it was possible to develop an algorithm that learns in real time from recent historical data to decide when to enter the market.
👉 XGBoostMini:
🔷 Key Features Extraction
Before making decisions, the system calculates six normalized features metrics to describe the current market state:
14-period RSI on a scale from zero to one
Percentage distance between the price and the 50-period Exponential Moving Average (EMA)
5-period Rate of Change (ROC)
Normalized ATR relative to the price to estimate volatility
Volume variation compared to its 20-period moving average
Current price position relative to the highs and lows of the last 14 bars
🔷 Dynamic Model Training
Starting from bar 300 onwards, every 50 bars the code collects a historical sample consisting of 50 past observations. For each observation, the system checks whether the price increased or decreased two bars later, generating a binary target variable. Based on this recent data, a mini decision tree is trained using the XGBoost model.
🔷 Real-Time Prediction
On every bar following the training, the model analyzes the 6 current indicators and calculates a numerical probability between 0 and 1, representing the estimated likelihood of a future bullish market movement.
🔷 Order and Risk Management
A Long position entry is triggered if the model's estimated probability exceeds the configured reference threshold, set by default to 51%. The position is closed as soon as the probability falls below the opposite threshold. Finally, for capital protection, a safety exit system based on a percentage-based dynamic trailing stop is activated.
🔷 Key Stats & Profitability
Total PnL: +2,010 USDT (+20.10%). A positive return, though it must be evaluated relative to the time horizon visible in the charts (2018 to 2026).
Profit Factor: 1.36. This is a solid value above 1, indicating that gross profits exceed gross losses.
Profitable Trades Percentage: Approximately 54.88%. Over half of the operations close in profit, a robust percentage for a medium-to-high frequency algorithmic trading system.
🔷 Risk Management and Drawdown
Max Drawdown: 361.87 USDT, equal to 3.34%.
This is an exceptionally positive metric. A drawdown of less than 3.50% over such an extensive historical dataset demonstrates outstanding capital protection and very tight risk management driven by the dynamic trailing stop.
🔷 Trades Analysis & Distribution
Expectancy: +0.20% per trade.
This means that, on average, each operation has a positive expected return of 0.20%.
🔷 Risk/Reward Ratio:
Average loss: -0.78%.
Average profit: +1.21%.
Positive Note: The average profit exceeds the average loss, which helps keep the strategy profitable even with a win rate of around 55%.
🔷 Outliers and Extremes
Largest loss: 94.60 USDT.
Largest profit: 169.25 USDT.
It's worth noting that the maximum single loss exceeds the maximum single profit, which means that the strategy's profitability does not rely on isolated "lucky shots," but rather on the consistency of many small profits.
🔷 Equity Curve Analysis
Cumulative PnL Curve: Observing the cumulative PnL chart, a steady and gradual growth phase is visible, especially from 2020 onwards, accompanied by strong stability during sideways or bear market phases (such as in 2022).
Commission Load: The commission load is very low at 0.08%, indicating that transaction costs have a minimal impact on the final result.
🔷 Overall Assessment
The strategy demonstrates solid quantitative metrics: a low drawdown, a good profit factor and a favorable risk/reward ratio. However, as this strategy was developed to test the features of the XGBoost library, it should be considered exclusively for research purposes. Do not treat this strategy as ready for live deployment, but rather as a starting point for your experiments. Strategie

Mizan Thrust Oscillator (P-RMA vs P-VWMA)Title: Mizan Thrust Oscillator: Adaptive Momentum & Volume Dynamics
Description:
Classic moving averages and traditional oscillators often fall short because they treat the market as a static entity, relying purely on fixed lookback periods. However, the market is never truly static; it is a continuous flow shifting from one probability space to another.
Developed by Mizan Lab, the Mizan Thrust Oscillator is built on the philosophy of dynamic adaptation. It abandons rigid time-based calculations to measure the true "thrust" of the market by calculating the divergence between a momentum-backed volume average and an adaptive rolling moving average.
⚙️ Core Logic & Mathematics
This indicator does not rely on standard price data alone. Instead, it introduces PSI (Scaled RSI Momentum) as the core gravitational pull for its calculations.
It is powered by two distinct hybrid averages (calculated under the hood):
P-VWMA (PSI-Volume Weighted Moving Average): Unlike a standard VWMA that only weights price by volume, the P-VWMA requires both high volume and high momentum (PSI) to move the needle. It tracks the true footprint of institutional flow.
P-RMA (PSI-Adaptive RMA): This moving average dynamically changes its length based on the deviation of current momentum from the "Equilibrium Center". When the trend is explosive, the length decreases to hug the price (reducing lag). When the market is flat, the length expands to filter out the noise.
The lower-panel histogram visualizes the mathematical difference (the Thrust) between the fast-adapting P-RMA and the volume-anchored P-VWMA.
📊 How to Read the Oscillator
The histogram is color-coded to instantly communicate shifts in momentum entropy and trend exhaustion:
Zero Line (Equilibrium) Crossovers: When the histogram crosses above the zero line, it signals a bullish structural shift. Crossing below indicates bearish control.
Dark Blue (Growing Bull): Strong, expanding upward momentum. The adaptive average is pulling away from the volume baseline.
Light Blue (Fading Bull): Bullish momentum is losing entropy. The thrust is weakening, serving as an early warning for potential pullbacks or profit-taking.
Dark Red (Growing Bear): Strong, expanding downward momentum. Sellers are aggressively in control.
Orange (Fading Bear): Bearish momentum is exhausted. The downward thrust is shrinking, indicating a potential bottom or reversal.
Yellow Signal Line: A 5-period WMA applied directly to the histogram to smooth out micro-fluctuations. Crossovers between the histogram bars and this yellow line can be used as secondary confirmation for localized entries/exits.
💡 Why Use the Mizan Thrust Oscillator?
Zero-Lag Responsiveness: By dynamically shortening its internal lookback periods during volatile moves, it catches sharp reversals much faster than traditional MACD or fixed oscillators.
Fakeout Filtration: A move requires both volume and momentum validation to register as a strong thrust, naturally filtering out low-volume traps.
No Repainting: The script is strictly calculated on confirmed bars and historical data without utilizing forward-looking functions.
This script is for educational and analytical purposes only. It is designed to be a supplementary tool for market structure and volume-momentum analysis. Indikator

VWAP + EMAs + Levels (ATR / Premarket / Yesterday)Two questions decide every intraday trade: where is fair value, and where is price likely to react? This indicator answers both on one clean chart — no bands, no clutter, no redundant plots.
What it draws
Session VWAP — hairline green, anchorable to session, week, month, quarter, year, or even earnings, dividends and splits. The line institutions trade around, and nothing else around it.
EMA stack 5 / 9 / 21 / 50 / 200 — white, blue, yellow, red, gray. Trend, pullback zones and the long-term line at a single glance.
Daily ATR envelope — yesterday's close ± today's ATR, in red. The statistical ceiling and floor of the day: where continuation gets expensive and fades get interesting.
Yesterday's High & Low — yellow. The levels every desk is already watching.
Premarket High & Low — green. Auto-tracked from 04:00 to 09:30 NY, locked in at the bell.
What makes it different
Levels don't run off to infinity. Each one spans the regular session from open to close, tagged with a muted gray label that reads on dark charts without fighting your candles for attention. Turn the span off and they extend right, classic style.
Built for opening-range breaks, VWAP reclaims and rejections, fades into ATR extremes, and premarket-range plays.
Fully configurable — every color, line width, ATR length and MA type (RMA, EMA, SMA, Hull), premarket and regular session windows, time zone, label offset, and independent toggles for each level group.
Pine Script v6. Requires extended-hours data for premarket levels.
Credit: built on TradingView's built-in VWAP and the Day ATR H/L script by divinechartist, unified and rewritten for v6 Indikator

Momentum Core [MasterTonyTA]# Momentum Core — Publish Description
---
## WHAT IT IS
Momentum Core is a composite momentum oscillator that blends four non-redundant momentum sources into a single normalized reading, then layers on a MACD-derived wave, a volatility/participation regime gate, and health zones that separate tradeable momentum from both chop and exhaustion.
Most momentum oscillators measure the same thing twice. MACD is essentially rate-of-change on EMAs. Stochastic and RSI both measure position within range. CCI overlaps normalized ROC. Stacking those gives you four confirmations of one idea and a false sense of confluence.
This indicator deliberately selects sources that measure **different** things: smoothed directional force, volatility-adjusted velocity, thrust acceleration, and participation. Each is z-scored against its own recent history before being weighted, so no single component can dominate simply because it has a larger raw scale.
---
## HOW TO READ IT
### The Momentum Line (main plot)
The line is the composite reading, squashed to a **-100 to +100** range. Its color encodes two things at once:
| Color | Meaning |
|---|---|
| **Solid green** | Momentum rising, above signal line — clean bullish impulse |
| **Faded green** | Momentum rising, below signal line — early turn, not yet confirmed |
| **Faded red** | Momentum falling, above signal line — exhaustion; the move is decaying while still reading positive |
| **Solid red** | Momentum falling, below signal line — clean bearish impulse |
| **Grey / dimmed** | Regime gate failed — ADX or relative volume too low to trust the reading |
The key read is the **faded states**. A faded red above the signal line is the earliest exit tell in the indicator: price may still be making highs, but the force behind it is already draining. A faded green below the signal is the mirror — the turn has started before the crossover confirms it.
Direction is set by the **slope** of momentum, not by its position. A deadzone input prevents flicker during flat patches — the last direction holds until slope decisively flips.
### The Signal Line (orange)
A 9-period EMA of the composite. It is not a trade trigger on its own; it defines conviction. The wider the gap between momentum and signal, the stronger the current state. Crossovers matter most when they happen **inside a good zone** rather than in chop.
### The Momentum Wave (area fill)
A MACD histogram, z-scored and squashed onto the same scale as the main line. This is the cycle-rhythm layer — it shows you the breathing pattern of impulses.
- **Green** above zero, **red** below zero — always, regardless of the main line's state
- **Transparency scales with magnitude** — solid means a strong impulse, faded means a decaying one
By default the wave carries **zero weight** in the composite, so it is purely visual. This is intentional: MACD overlaps TSI, and scoring both double-counts the same signal. The weight input exists if you want it, but keep it at or below 0.5.
The wave's most useful read is **disagreement with the main line**. When the line is green and the wave is fading toward zero, the impulse is losing its engine.
### The Zones
Four regions, defined by two boundaries per side:
- **Bull good zone (+15 to +60)** — shaded green. Momentum is meaningfully positive but not stretched. This is where trends actually run.
- **Bear good zone (-15 to -60)** — shaded red. Same logic, downside.
- **Chop zone (-15 to +15)** — shaded neutral. Momentum lacks conviction. Signals here have the worst expectancy in the entire indicator.
- **Overextended (beyond ±60)** — unshaded. Momentum is stretched; continuation still happens, but reward-to-risk on new entries is poor and mean reversion risk is elevated.
Treat zones as a filter, not a signal. A crossover in the good zone and the identical crossover in chop are not the same event.
### Divergence Labels
**D** labels mark divergence between the composite and price, detected on confirmed pivots. A bullish divergence prints when price makes a lower low while momentum makes a higher low; bearish is the inverse. Labels are offset back to the pivot bar, so they confirm with a lag equal to the right-pivot setting — this is by design, since unconfirmed pivots repaint.
---
## THE CALCULATIONS
### Step 1 — Component extraction
**TSI (True Strength Index)** — double-smoothed momentum, default 13/25. Chosen over MACD because the double smoothing removes most whipsaw while keeping the zero-line cross meaningful.
**ATR-Normalized ROC** — `(close - close ) / ATR(n)`. Dividing by ATR is what makes this portable: a 2% move in a quiet tape and a 2% move in a volatile one produce very different readings, which is correct. Raw ROC would treat them identically.
**RSI Velocity** — the *change* in RSI over a short window, not the RSI level itself. Level tells you where you are in the range; velocity tells you how hard you are moving through it. Velocity turns first.
**OBV Slope** — change in OBV over n bars, normalized by average volume so it scales across instruments. This is the participation check. Momentum without volume behind it is a fade waiting to happen.
### Step 2 — Normalization
Each component is converted to a **z-score** against its own trailing mean and standard deviation over the lookback window:
```
z = (value - SMA(value, len)) / STDEV(value, len)
```
This is the step that makes the blend legitimate. Without it, TSI (roughly ±100 scale) would swamp OBV slope (unbounded, instrument-dependent) regardless of the weights you set. After z-scoring, every component speaks the same language: standard deviations from its own normal.
### Step 3 — Weighted composite and squash
Z-scores are combined as a weighted average, then compressed through a logistic function:
```
raw = Σ(zᵢ × wᵢ) / Σ(wᵢ)
mom = 100 × (2 / (1 + e^(-raw × 0.9)) - 1)
```
The sigmoid squash bounds the output to ±100 while preserving resolution in the middle of the range, where most trading decisions actually happen. A hard clamp would flatten all extreme readings into an identical value and destroy the distinction between "strong" and "absurd." The sigmoid compresses the tails smoothly instead.
Default weights: TSI 1.2, ROC 1.0, RSI velocity 0.8, OBV slope 0.7, wave 0.0.
### Step 4 — Signal and acceleration
```
signal = EMA(mom, 9)
accel = EMA(Δmom, 3)
```
`accel` is the second derivative of momentum — the rate of change of the rate of change. It drives the line's directional coloring and the exhaustion alerts. This is the component most oscillators omit entirely, and it is what lets the indicator flag a decaying impulse before any crossover occurs.
### Step 5 — Regime gate
```
gateOK = ADX ≥ threshold AND relativeVolume ≥ threshold
```
When the gate fails, the momentum line dims to grey. Nothing is hidden or suppressed — you still see the full reading — but the visual weight drops, because momentum readings during low-ADX, low-participation conditions are mostly noise. Relative volume is current volume against its 20-period average.
---
## SETTINGS THAT MATTER MOST
**Z-Score Lookback (default 100)** — the single most impactful input. This is the window that defines "normal." For intraday and short-dated options work, drop it to **50**; the 100-bar window is too slow to adapt within a session. For daily and swing timeframes, leave at 100 or extend to 150.
**ROC Length (default 14)** — pair with the lookback. Intraday, drop to **7**.
**Slope Deadzone (default 0.15)** — raise toward 0.3 if the line flips color more often than you want. This trades responsiveness for stability.
**Wave Sensitivity** — the divisor in the wave transparency calculation. Lower it to 35 if the wave rarely reaches full opacity on your instrument; raise to 70 if everything saturates.
**Weights** — the defaults are a reasonable starting point, not a result of optimization. If you trade a volume-thin instrument, cut the OBV weight. If you trade something gappy, lean harder on the ATR-normalized ROC.
---
## ALERTS INCLUDED
- Momentum Flip Bull / Bear — zero cross with the regime gate passing
- Bull / Bear Exhaustion — momentum at an extreme while decelerating
- Bullish / Bearish Divergence
- Wave Flip Bull / Bear — momentum wave crossing zero
- Wave Stalling — wave rolling over without crossing
- Enter Bull Zone / Enter Bear Zone
- Overextended
---
## NOTES AND LIMITATIONS
Divergence labels confirm on a lag equal to the right-pivot setting. This is unavoidable in honest pivot detection — anything faster repaints.
The z-score normalization means readings are **relative to recent history**, not absolute. A +70 reading in a quiet regime and a +70 in a volatile one represent different raw moves. This is the intended behavior, but it means you should not port threshold settings between instruments without checking them.
This is an indicator, not a system. It has no position sizing, no stop logic, and no backtest attached. Zones and gates are filters that improve signal quality; they do not create an edge on their own.
---
*Author: MasterTonyTA* Indikator

Daily Swing Trader PRO v3.2 # Daily Swing Trader PRO
**Daily Swing Trader PRO** is a rules-based swing-trading indicator designed primarily for traders who use the **daily chart** and want a simple way to combine trend, momentum, volume, volatility, entry quality, and risk management into one TradingView script.
The indicator is built around a **trend + pullback/breakout + confirmation** approach. Instead of relying on a single indicator, it combines several commonly used technical tools to identify higher-quality swing-trading setups.
## Main Features
Daily Swing Trader PRO includes:
* 10 EMA
* 21 EMA
* 50 SMA
* 200 SMA
* SuperTrend
* RSI
* Relative Volume (RVOL)
* ATR and ATR %
* Bullish pullback detection
* Bullish breakout detection
* Bearish breakdown detection
* Bearish failed-rally detection
* BUY signals
* STRONG BUY signals
* SELL signals
* STRONG SELL signals
* Automatic entry level
* Automatic stop-loss level
* Configurable reward/risk target
* TAKE PROFIT signals
* STOP LOSS signals
* Detailed TradingView alerts
* Daily Swing dashboard
* Signal notification panel
* Automatic light/dark chart theme support
## Trading Philosophy
The indicator follows a simple principle:
**Trend first → Price action second → Volume and momentum confirmation → Risk/reward → Trade**
Indicators are used as confirmation rather than as standalone reasons to enter a trade.
The goal is to avoid weak setups, avoid chasing extended stocks, and focus on trades where multiple technical factors are aligned.
# How to Use Daily Swing Trader PRO
## Recommended Timeframe
The indicator is designed primarily for the:
**1-Day / Daily chart**
The default settings are optimized around daily-chart swing trading.
## Bullish Trend Requirements
The script looks for a bullish environment when:
* Price is above the 50 SMA
* Price is above the 200 SMA
* Price is above the 21 EMA
* 10 EMA is above the 21 EMA
* 21 EMA is rising
* SuperTrend is bullish
* RSI is above 50
* Relative volume meets the selected minimum
* ATR volatility meets the minimum requirement
* Price is not excessively extended above the 21 EMA
These conditions help reduce signals that occur during weak or sideways trends.
## BUY Signal
A **BUY** signal can occur when the bullish trend requirements are satisfied and one of the following setups appears:
### Pullback Setup
Price pulls back toward the 10 EMA or 21 EMA and then shows bullish confirmation.
Typical confirmation includes:
* Price holding the EMA support area
* Bullish daily candle
* Close above the previous day's high
* Price closing back above the 10 EMA and 21 EMA
* Adequate relative volume
This setup attempts to enter an existing trend after a controlled pullback instead of chasing price.
### Breakout Setup
A breakout setup occurs when price closes above the highest price of the selected breakout lookback period.
The indicator also requires bullish trend, momentum, volume, and volatility conditions before generating the signal.
## STRONG BUY Signal
A **STRONG BUY** requires the normal BUY conditions plus stronger confirmation.
Default requirements include:
* Bullish trend
* Valid pullback or breakout
* RSI approximately 55–70
* RVOL of at least 1.20
* Strong bullish candle close
* Price not excessively extended
* Bullish SuperTrend
STRONG BUY is intended to identify the highest-quality bullish setups produced by the system.
## SELL Signal
SELL is the bearish counterpart to BUY.
The script looks for:
* Price below the 50 SMA
* Price below the 200 SMA
* Price below the 21 EMA
* 10 EMA below the 21 EMA
* Falling 21 EMA
* Bearish SuperTrend
* RSI below 50
* Adequate relative volume and volatility
A SELL signal may occur after either a bearish breakdown or a failed rally into resistance.
For traders who only trade long positions, SELL can also be used as a warning that bullish conditions have deteriorated.
## STRONG SELL Signal
A **STRONG SELL** requires additional bearish momentum and volume confirmation.
It is designed to identify the strongest bearish setups and may be useful for traders evaluating short positions or long-put option setups.
# Entry, Stop and Take Profit
When a new trade signal appears, the script automatically calculates:
**Entry:** Signal candle closing price
**Stop Loss:** Based on the recent swing high or swing low plus an ATR buffer
**Take Profit:** Based on the selected reward/risk multiple
The default target is:
**2R — approximately 2:1 reward/risk**
Example:
Entry: $100
Stop: $95
Risk: $5
2R Take Profit: $110
The reward/risk target can be adjusted in the indicator settings.
## Stop-Loss Logic
For long trades, the stop is placed below a recent swing low.
For bearish trades, the stop is placed above a recent swing high.
An ATR buffer is added to reduce the chance of being stopped out by normal price movement.
## Take-Profit Logic
When price reaches the calculated target, the indicator produces a:
**TAKE PROFIT**
signal.
The script also tracks STOP LOSS events.
Because a daily candle only provides open, high, low, and close information, if both the stop and profit target are touched on the same daily candle, the script uses the conservative assumption that the stop was reached first.
# Avoiding Extended Trades
One of the most important filters in Daily Swing Trader PRO is the **maximum extension from the 21 EMA**.
The default is:
**2 ATR**
If price becomes too extended above or below the 21 EMA, new entries are filtered out.
This is designed to reduce late entries after unusually large price moves.
# Relative Volume
Relative Volume compares current volume with average recent volume.
Default values:
Normal signal: **RVOL ≥ 1.00**
Strong signal: **RVOL ≥ 1.20**
Higher RVOL generally indicates stronger participation behind the move.
# RSI
RSI is used as a momentum filter rather than simply as an overbought/oversold indicator.
For bullish trades, the script generally looks for RSI above 50.
STRONG BUY signals typically require RSI in the stronger momentum zone of approximately:
**55–70**
Bearish signals use the opposite momentum structure.
# ATR
ATR is used for several purposes:
* Measuring volatility
* Preventing trades in stocks with insufficient movement
* Measuring price extension
* Calculating stop buffers
* Helping evaluate swing-trading opportunity
The dashboard displays both ATR and ATR as a percentage of price.
# Dashboard
The **Daily Swing Dashboard** appears in the top-right corner of the chart.
It displays information such as:
* Current trend
* Trade status
* Last signal
* Setup type
* RSI
* RVOL
* ATR
* ATR %
* Entry
* Stop
* Profit target
The **Signal Notification Panel** appears in the bottom-right corner and displays the most recent trading event.
# TradingView Alerts
The indicator includes individual alert conditions for:
* STRONG BUY
* BUY
* STRONG SELL
* SELL
* TAKE PROFIT
* STOP LOSS
Detailed alerts can include:
* Ticker
* Current price
* Entry
* Stop
* Take-profit target
* Reward/risk
* RSI
* RVOL
* ATR
* ATR %
For daily swing trading, alerts are best evaluated after the daily candle has closed so that the setup is confirmed.
# Suggested Workflow
A practical workflow is:
1. Start with stocks already showing a strong trend.
2. Use the daily chart.
3. Wait for BUY or STRONG BUY rather than chasing large candles.
4. Check nearby support and resistance.
5. Confirm that the profit target has enough room before major resistance.
6. Review earnings and major market-event risk.
7. Enter only if the chart still offers acceptable reward/risk.
8. Use the calculated stop rather than widening the stop after entering.
9. Take profit at the target or manage the position with your own trailing-stop rules.
For conservative use, traders may choose to treat:
**STRONG BUY / STRONG SELL = potential trade signals**
and
**BUY / SELL = watchlist or early-warning signals**
# Default Settings
The default settings are intended as a starting point:
10 EMA: 10
21 EMA: 21
50 SMA: 50
200 SMA: 200
SuperTrend ATR: 10
SuperTrend Factor: 3.0
RSI: 14
RVOL Lookback: 20
Normal RVOL: 1.00
Strong RVOL: 1.20
ATR: 14
Maximum Extension: 2 ATR
Swing Stop Lookback: 5 bars
Take Profit: 2R
Different securities and market conditions may require different settings.
# Important Notes
Daily Swing Trader PRO is not designed to predict the market.
No technical indicator can guarantee profitable trades. Signals should be combined with proper position sizing, risk management, market context, support and resistance, earnings awareness, and individual trading judgment.
Historical signals do not guarantee future performance.
This indicator is provided for educational and informational purposes only and should not be considered financial or investment advice.
Indikator

Adaptive Ehlers Filtered PercentileAdaptive Ehlers Filtered Percentile is a trend-regime indicator that combines a volatility-adaptive moving average, a displacement-weighted nonlinear filter, and percentile-based price-deviation bands.
The indicator is designed to separate three tasks: adapt the baseline response to changing price variability, further filter that baseline according to historical displacement, and derive regime thresholds from the observed distribution of price-to-trend deviations rather than from a fixed percentage or standard-deviation multiplier.
🟣How It Works
The first stage measures the standard deviation of one-bar price changes.
That volatility measurement is compared with a rolling reference range. The resulting position inside the range determines the effective moving-average period between the user-defined Minimum MA Period and Maximum MA Period.
Higher volatility favors the shorter period, while lower volatility favors the longer period.
The adaptive period is converted into a smoothing coefficient and applied recursively to produce the Adaptive MA.
🟣Displacement-Weighted Filter
The Adaptive MA is then processed through a nonlinear weighted filter.
For each observation in the filter window, the script compares the current Adaptive MA value with another Adaptive MA value separated by the Momentum Length.
The absolute displacement between those observations becomes the weighting coefficient.
Observations associated with larger displacement therefore contribute more heavily to the final filtered trend value, while observations with little displacement contribute less.
If valid weighting coefficients are unavailable, a simple moving average of the Adaptive MA is used as a fallback.
🟣Percentile Bands
The indicator measures the absolute distance between price and the filtered trend:
Absolute Deviation = |Price - Filtered Trend|
These deviations are ranked over the selected Percentile Length.
The chosen Percentile Level determines the historical deviation used as the base band distance.
Unlike standard-deviation bands, this approach does not assume a particular distribution of deviations. The band width instead comes directly from the ranked historical observations.
Separate upper and lower multipliers allow the two sides of the structure to be adjusted independently.
🟣Regime Logic
A bullish regime begins when the selected source moves above the upper percentile band.
A bearish regime begins when the selected source moves below the lower percentile band.
When price remains between the two bands, the previous regime is retained.
LONG and SHORT markers are therefore displayed only when the persistent regime changes rather than on every bar that remains outside a threshold.
🟣Main Settings
Minimum MA Period / Maximum MA Period define the response range of the volatility-adaptive moving average.
Volatility Period controls how much recent price-change history is used to determine the adaptive response.
Filter Length determines how many Adaptive MA observations contribute to the displacement-weighted filter.
Momentum Length determines the historical separation used when measuring displacement for the filter weights.
Percentile Length defines the sample of historical price-to-filter deviations.
Percentile Level determines which ranked deviation becomes the base band width. Higher percentiles generally create more selective thresholds.
Upper Band Multiplier / Lower Band Multiplier independently scale the bullish and bearish thresholds.
🟣Design Purpose
The indicator uses each component for a specific role:
Price-change volatility → Adaptive MA response
Adaptive-MA displacement → Nonlinear filtering weights
Historical absolute deviation → Percentile band width
Band breakout → Persistent market regime
The percentile stage is applied to the actual distance between price and the adaptive filtered baseline. This allows the threshold structure to adjust to the historical distribution of deviations rather than relying only on a fixed volatility multiplier.
The asymmetric upper and lower multipliers also allow the bullish and bearish breakout requirements to be configured independently.
🟣Limitations
This indicator is a trend-regime tool and not a complete trading system. LONG and SHORT labels identify changes in the indicator's internal regime; they do not imply guaranteed trade outcomes or future performance.
Percentile thresholds are based on historical observations within the selected lookback. A change in market behavior can therefore alter the band width as new deviations enter the sample.
The adaptive moving average and nonlinear filter are derived from current and historical price information and remain dependent on the selected parameters.
The script does not use higher-timeframe requests or lookahead logic. Indikator

Simple Scalper PRO V1.1 (Alx_Sport_Tour)# Simple Scalper PRO
## 🇬🇧 ENGLISH
**Clear signals. Clean chart. Simple rules.**
Simple Scalper PRO is a practical intraday and scalping indicator designed for traders who want to quickly identify potential market entries and dynamic exits without filling the chart with unnecessary information.
The indicator combines **EMA 9/20/50/100/200** with **ATR-based volatility analysis** to create a simple, structured trading framework.
### 🚀 ENTRY SIGNALS
**LONG**
EMA 9 crosses EMA 50 upward.
**SHORT**
EMA 9 crosses EMA 50 downward.
Signals are displayed directly on the chart with clean **L** and **S** markers, making potential entry points easy to identify.
### 🛡️ ATR-BASED STOP LOSS
Stop Loss is calculated using:
**1.5 × ATR**
ATR timeframe, ATR period and Stop Loss multiplier are fully configurable in the indicator settings, allowing the tool to be adapted to different instruments and trading styles.
### 🎯 DYNAMIC EXIT
Simple Scalper PRO does **not** use fixed Take Profit targets.
Instead, exits are generated dynamically using the relationship between **EMA 9 and EMA 20**.
**LONG → EXIT**
EMA 9 crosses EMA 20 downward.
**SHORT → EXIT**
EMA 9 crosses EMA 20 upward.
This approach allows the exit signal to react to changing market conditions instead of relying on a predetermined price target.
### 📊 BUILT-IN DASHBOARD
The compact dashboard provides the most important information at a glance:
• Position
• Entry Price
• ATR
• ATR Timeframe
• ATR Period
• Exit Price
• Current Trend
No unnecessary TP levels or overloaded statistics — just the information needed for quick decision-making.
### ⚙️ FULLY CONFIGURABLE
The indicator gives you control over the main parameters:
• EMA 9 Period
• EMA 20 Period
• EMA 50 Period
• EMA 100 Period
• EMA 200 Period
• ATR Timeframe
• ATR Period
• Stop Loss × ATR
### 🔔 ALERTS
TradingView alerts are available for:
🟢 LONG
🔴 SHORT
The indicator intentionally keeps alerts focused on entry signals.
### 💡 DESIGNED FOR
Simple Scalper PRO can be useful for:
• Scalping
• Intraday trading
• Short-term trend following
• Fast market analysis
• Traders who prefer clean and uncomplicated charts
**Simple Scalper PRO focuses on one thing: keeping your trading view simple, structured and easy to read.**
Use it as part of your own trading strategy and always consider market conditions, risk management and confirmation from additional analysis.
*Simple Scalper PRO is a technical analysis tool and does not provide financial advice or guarantee trading results.*
━━━━━━━━━━━━━━━━━━━━━━━━━━━━━━━━━━━━━━
# 🇷🇺 РУССКАЯ ВЕРСИЯ
**Чёткие сигналы. Чистый график. Простые правила.**
Simple Scalper PRO — практичный индикатор для **скальпинга и внутридневной торговли**, созданный для трейдеров, которым важно быстро видеть потенциальные точки входа и динамические выходы без перегруженного графика.
Индикатор объединяет **EMA 9/20/50/100/200** и анализ волатильности на основе **ATR**, создавая простую и понятную структуру для принятия торговых решений.
### 🚀 СИГНАЛЫ ВХОДА
**LONG**
EMA 9 пересекает EMA 50 снизу вверх.
**SHORT**
EMA 9 пересекает EMA 50 сверху вниз.
Сигналы отображаются непосредственно на графике в виде компактных меток **L** и **S**, благодаря чему потенциальные точки входа легко заметить даже при быстром движении рынка.
### 🛡️ STOP LOSS НА ОСНОВЕ ATR
Stop Loss рассчитывается по формуле:
**1.5 × ATR**
Таймфрейм ATR, период ATR и множитель Stop Loss полностью настраиваются в параметрах индикатора.
Это позволяет адаптировать расчёт под различные инструменты и торговые стили.
### 🎯 ДИНАМИЧЕСКИЙ ВЫХОД
Simple Scalper PRO **не использует фиксированный Take Profit**.
Вместо заранее заданных целей выход определяется динамически с помощью пересечения **EMA 9 и EMA 20**.
**LONG → EXIT**
EMA 9 пересекает EMA 20 сверху вниз.
**SHORT → EXIT**
EMA 9 пересекает EMA 20 снизу вверх.
Такой подход позволяет сигналу выхода реагировать на изменение рыночной динамики, а не зависеть от заранее установленной ценовой цели.
### 📊 ВСТРОЕННЫЙ DASHBOARD
Компактная информационная панель показывает всё самое необходимое:
• Position
• Entry Price
• ATR
• ATR Timeframe
• ATR Period
• Exit Price
• Current Trend
Без лишних уровней Take Profit и перегруженной статистики — только ключевая информация для быстрого анализа.
### ⚙️ ПОЛНАЯ НАСТРОЙКА
В параметрах индикатора можно настроить:
• EMA 9 Period
• EMA 20 Period
• EMA 50 Period
• EMA 100 Period
• EMA 200 Period
• ATR Timeframe
• ATR Period
• Stop Loss × ATR
### 🔔 ALERTS
Алерты TradingView доступны для:
🟢 LONG
🔴 SHORT
Алерты специально ограничены сигналами входа, чтобы не перегружать уведомления.
### 💡 ДЛЯ КОГО ПОДХОДИТ
Simple Scalper PRO может быть полезен для:
• Скальпинга
• Внутридневной торговли
• Краткосрочной торговли по тренду
• Быстрого анализа рынка
• Трейдеров, предпочитающих чистый и понятный график
**Simple Scalper PRO создан с одной главной идеей: сделать торговый график простым, структурированным и удобным для чтения.**
Используйте индикатор как часть собственной торговой системы и учитывайте рыночные условия, управление рисками и дополнительные подтверждения.
*Simple Scalper PRO является инструментом технического анализа, не является финансовой рекомендацией и не гарантирует прибыльность торговли.*
Indikator

Indikator