Indikator

Strategie

BocchiTheTrader | Quantum Trend Matrix# BocchiTheTrader | Quantum Trend Matrix
## 🚀 OVERVIEW
In modern electronic markets, retail traders suffer from cognitive overload. Managing multiple charts, fragmented timeframes, and dozens of conflicting indicators often leads to analysis paralysis and execution delays.
The **Quantum Trend Matrix** by **BocchiTheTrader** solves this structural problem. It is an enterprise-grade, localized Heads-Up Display (HUD) that synthesizes a high-fidelity technical matrix directly onto your active trading workspace. By evaluating macro trend direction, multi-oscillator momentum, volume health, and volatility boundaries simultaneously, the QTM provides traders with an instantaneous snapshot of market confluence. It functions as a single, centralized source of truth for directional bias, asset strength, and execution validation.
---
## 📐 THE MATHEMATICAL & LOGICAL CORE
The dashboard works as a multi-indicator consensus engine, evaluating individual variables every single tick to update a structural confluence matrix:
* **Tri-Horizon Trend Architecture:** Evaluates directional health by processing price action relative to an optimized Simple Moving Average (SMA) across three distinct temporal planes: Macro-Weekly, Swing-Daily, and Intraday-Current.
* **Linear & Non-Linear Momentum Ensemble:**
* **MACD Line/Signal Cross:** Decodes classic directional velocity shifts.
* **Relative Strength Index (RSI-14):** Evaluates oversold/overbought thresholds based on a centralized 50-level mid-line axis.
* **Stochastic Oscillator (14, 3):** Measures the location of the close relative to the high-low range to catch rapid cyclical swing turns.
* **Gaussian Normalized Fisher Transform:** Applies an algebraic log transform to normalized RSI values, sharpening the turning points into crisp, highly responsive leading triggers.
* **Money Flow Index (MFI-14):** Combines price action with volume to determine institutional capital absorption or distribution.
* **Volatility & Structural Boundaries:**
* **Bollinger Bands (20, 2.0):** Isolates extreme price extensions. If price pierces the lower band, an exhaustion "Buy" state triggers; if it pierces the upper band, a "Sell" state triggers; otherwise, it remains balanced ("Neutral").
* **Trend Strength & Direction Balance (DMI/ADX):**
* **Directional Movement Index (DMI):** Identifies whether the positive ($+DI$) or negative ($-DI$) trend force is dominant.
* **Average Directional Index (ADX):** Quantifies the absolute strength of the move. Values below 25 trigger a "Weak" warning, while values above 25 confirm a true trending market.
* **Dynamic Exponential Ribbon (EMA 20/50):** Monitors the fast-to-slow exponential moving average cross to confirm immediate mechanical trend acceleration.
---
## 🚦 HOW TO TRADE WITH IT
### 🔹 Long-Side Execution Matrix (Confluence Buying)
1. **Macro Validation:** Ensure that the *Daily Trend* and *Current Trend* cells display **Bullish** (Mint Green).
2. **Momentum Alignment:** Look for a cluster of **Buy** signals across leading indicators (specifically *Fisher*, *MACD*, and *RSI*).
3. **Volatility Confirmation:** Verify that the *ADX* row indicates **Trend** ($>25$). This confirms that the bullish move has institutional momentum backing it.
4. **Entry Trigger:** Execute when the *EMA 20/50* row transitions to **Buy**.
### 🔸 Short-Side Execution Matrix (Confluence Shorting)
1. **Macro Validation:** Ensure that the *Daily Trend* and *Current Trend* cells display **Bearish** (Crimson Red).
2. **Momentum Alignment:** Look for a cluster of **Sell** signals across *MACD*, *Stoch*, *MFI*, and *RSI*.
3. **Volatility Confirmation:** If price breaks down past a structural level and *Bollinger* shifts out of neutral into an extreme state or *DMI* reads **Sell**, the downward expansion is confirmed.
4. **Entry Trigger:** Execute when the *EMA 20/50* transitions to **Sell**.
### 🛡️ Risk Management & Trailing Protocol
* **Invalidation Point:** If an established Long trade is running and more than three momentum cells (e.g., MACD, Stoch, Fisher) flip rapidly from **Buy** to **Sell**, it signals an impending distribution phase. Use this as an early warning indicator to tighten stop-losses or harvest partial profits before visual price rotation occurs.
---
## ⚠️ RISK DISCLAIMER
Financial market trading involves substantial risk of capital loss. Quantum Trend Matrix is engineered exclusively as a statistical and analytical workflow assistant. Past performance configurations do not dictate, guarantee, or imply future algorithmic outcomes. Always utilize strict capital allocation and risk mitigation frameworks. Indikator

Indikator

Indikator
Indikator

Indikator

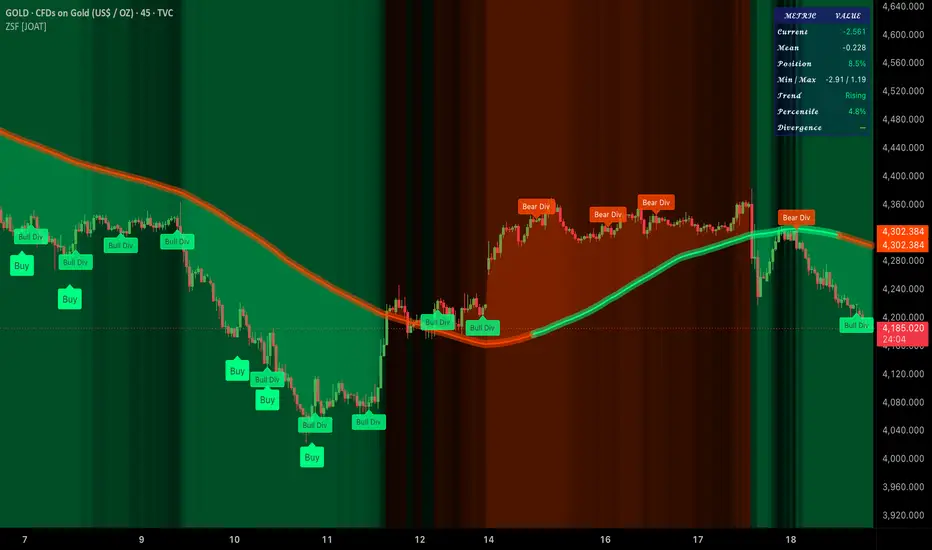
Z-Score Flow Pro [JOAT]Z-SCORE FLOW PRO
A rigorously-statistical mean-reversion oscillator built on top of two of the cleanest primitives in market analysis — the Z-score of price against its own rolling mean and the EMA-smoothed RSI — and wrapped in a regime-aware visual and signal pipeline that knows when not to fire.
Why Z-score
A Z-score answers the question every reversion trader is really asking: "How many standard deviations is price from where it usually sits?" It is regime-aware by construction — when realised volatility expands, the same dollar move produces a smaller Z; when it contracts, the same dollar move produces a larger Z. That means the signal levels (Z = ±2, ±3, etc.) carry the same statistical meaning across instruments and timeframes, which a price-distance level never does.
Z-Score Flow Pro uses:
Z-score core — close vs SMA basis, normalised by rolling stdev, over a configurable lookback (default 100).
EMA trend filter — a long EMA (default 50) decides which side of the chart the engine considers in-regime. Signals are weighted by regime alignment, not blindly suppressed.
Smoothed RSI — RSI is computed, then EMA-smoothed (default 8-bar) to eliminate the single-bar whipsaws that plague the raw indicator without re-introducing visible lag.
A signal needs both the Z-score and the smoothed RSI to be at extremes on the same side — that AND-gating is what removes most of the false signals that pure RSI or pure Z systems produce.
Signal engine
A Buy signal requires Z ≤ Buy threshold (default −2.0) and smoothed RSI ≤ oversold level (default 30). A Sell signal requires Z ≥ Sell threshold (default +2.0) and smoothed RSI ≥ overbought level (default 70). A configurable cooldown prevents back-to-back signals; the labels respect the EMA regime filter so the strongest read is when signal direction agrees with the EMA trend.
Background heatmap (JOAT enhancement)
The chart pane is tinted bull or bear with an intensity proportional to |Z|. The mapping is linear: at Z = 0 the heatmap is nearly invisible, at |Z| = the saturation threshold (default 1.5) the tint reaches its loudest configured opacity. Both ends are tunable, so you can dial the heatmap from "barely there" to "institutional cockpit". This is the cleanest at-a-glance read of how stretched the market is right now — you do not need to read the Z value itself.
Divergence engine (JOAT enhancement)
A slope-comparison divergence runs in parallel: it compares the slope of the Z-score against the slope of price over a configurable lookback. A bullish divergence requires price slope negative and Z slope positive; bearish is the mirror. Both slopes must exceed a small epsilon to suppress flat-region noise, and a divergence cooldown spaces them out. Divergences print directly in the chart pane in the palette colour.
Slope-coloured Z-mean line
The Z-score's own running mean is plotted as a slope-coloured ribbon: bull / bear / flat colours based on the slope over a configurable sensitivity window. The shadow underneath the line uses an alpha-modulated version of the same colour so the line visually breathes with regime.
Dashboard
A compact monospaced table, positionable to any of nine corners, with togglable cell transparency. Rows surface:
Current Z-score and its direction (Rising / Falling / Flat).
One-year (252-bar) percentile of Z — how unusual the current reading is in its own recent history.
Smoothed RSI and its slope direction.
Active EMA regime (Up / Down / Neutral).
Distance of Z from its own min/max range (position-in-Z, 0–100%).
Alerts
Alerts are exposed for buy / sell signals, divergences, regime flips, and a configurable Z-extreme alert that fires when |Z| crosses a user-set high level (default 3.0). The extreme alert is the cleanest "the market is genuinely far from home" trigger this script produces and is suitable for end-of-day notification workflows.
How to read it
Three reads, in order of conviction:
Background heatmap — a glance tells you whether you are in a normal-Z regime (no tint) or stretched (bright tint). Most of the time, do nothing.
Signal labels — fade extremes only when both Z and RSI agree, and respect the EMA regime — counter-trend trades into a sustained EMA-aligned move are lower-conviction by definition.
Divergences — the highest-conviction reads. A bullish divergence with the heatmap saturated bear and the signal in the right direction is the cleanest setup the engine can produce.
Suggested settings
Defaults are tuned for 1H–4H on liquid markets. For 5m–15m, drop Z period to 50 and RSI period to 9. For daily and above, raise Z period to 200 and EMA trend filter to 100. The thresholds (±2.0 Z, 30/70 RSI) are intentionally classic — they correspond to the textbook two-sigma deviation and are well-understood; loosen them only if you are running on a less-liquid instrument.
Originality / what's reused
Z-score and RSI are public-domain mathematics, used here as primitives. The implementation — the smoothed-RSI gating, the slope-coloured Z-mean line with alpha shadow, the |Z|-driven background heatmap, the 252-bar percentile rank, the divergence epsilon filter, and the AND-gated signal pipeline — is JOAT-original and tuned together. No third-party code reused.
Open source
Published open-source under the default Mozilla Public License 2.0. Every section is banner-headed, every helper is documented inline, every input carries a tooltip. The Z-mean line, the heatmap, the divergence engine, and the dashboard are each in their own isolated module so you can study or adapt any single piece without reading the whole file.
Limitations
Z-score mean-reversion is a counter-trend tool by definition. In sustained one-sided trends the Z will live at an extreme for many bars and the signals will give back giveback — the EMA regime filter exists to warn you when you are in this state. The 252-bar percentile rank needs ~1 year of data to be meaningful; on shorter histories it warms up to neutral. Divergences are non-repainting but carry the natural lag of slope-over-window comparison.
—
-made with passion by jackofalltrades
Indikator

Indikator

FORBEST Trend CompassЭтот индикатор я создал не для поиска точек входа и не как источник сигналов. Его задача намного проще и, на мой взгляд, важнее — помочь быстро определить, кто сейчас контролирует рынок.
В основе индикатора лежат три скользящие средние:
🟢 MA 50 (зелёная) — отражает краткосрочный импульс рынка.
🟠 MA 100 (оранжевая) — показывает среднесрочное направление движения.
🟣 MA 200 (фиолетовая) — помогает определить долгосрочный тренд и общую структуру рынка.
Особое внимание стоит обратить на цвет фона.
🟢 Зелёный фон — цена находится выше MA 50, MA 100 и MA 200. Это означает, что преимущество находится на стороне покупателей. В классическом понимании рынок находится в бычьей фазе. Если ваша стратегия предполагает работу по тренду, именно в таких условиях стоит отдавать приоритет поиску покупок.
🔴 Красный фон — цена находится ниже MA 50, MA 100 и MA 200. Это говорит о преимуществе продавцов и медвежьем рынке. В подобных условиях покупки становятся более рискованными, а продажи соответствуют общему направлению движения.
🟠 Оранжевый фон — цена находится между MA 50 и MA 100. Это переходная зона. Рынок начинает менять краткосрочную структуру, но окончательного преимущества пока нет. Здесь важно проявлять терпение и ждать дополнительных подтверждений.
🟣 Фиолетовый фон — цена находится между MA 100 и MA 200. Это зона глубокой коррекции или восстановления. Долгосрочный тренд ещё не подтверждён, поэтому стоит быть более избирательным и осторожным.
⚪ Серый фон — смешанная структура. Мувинги не дают однозначной картины, а значит, рынок находится в состоянии неопределённости. Для новичков именно такие периоды часто оказываются самыми сложными.
Важно понимать: этот индикатор не предсказывает будущее и не гарантирует результат. Он лишь отвечает на один вопрос:
«Кто сейчас имеет преимущество — покупатели или продавцы?»
Используйте его как фильтр направления и дополнительный элемент анализа, а не как самостоятельную торговую систему.
Indikator

CTZ BTC ULTIMATE CYCLE [Fused+Simplified]
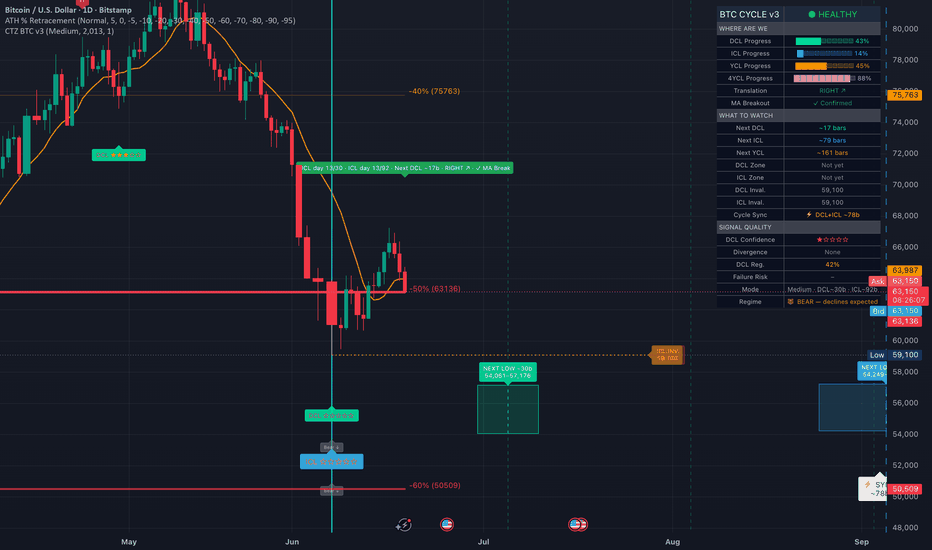
**CTZ BTC ULTIMATE CYCLE v3 — Description & How to Trade**
---
**WHAT THIS INDICATOR DOES**
CTZ BTC Ultimate Cycle v3 tracks Bitcoin's four natural market cycles simultaneously — the Daily Cycle Low (DCL), Intermediate Cycle Low (ICL), Yearly Cycle Low (YCL), and Four-Year Cycle Low (4YCL). Every BTC rally and correction follows rhythmic, repeating patterns. This script identifies those patterns in real time, marks where you currently are inside each cycle, projects where the next low is likely to land, and rates the quality of every signal with a confidence score.
Built on the Cycle Theory methodology (Loukas / CTZ framework), fused and simplified into a single overlay with one master sensitivity control instead of 20+ raw inputs.
---
**THE FOUR CYCLES**
🟢 DCL — Daily Cycle Low (~20–30 bars)
The smallest repeating rhythm. Used for short-term entry timing. Buy near the expected low, exit toward the subsequent cycle high.
🔵 ICL — Intermediate Cycle Low (~60–80 bars)
The bread-and-butter swing cycle. Contains 2–4 DCLs. Entries near an ICL low typically produce 20–50% moves before the next ICL arrives.
🟡 YCL — Yearly Cycle Low (~250–365 bars)
The annual rhythm. Contains 3–5 ICLs. YCL lows are major accumulation zones — deeper drawdowns that shake out weak hands before sustained runs.
🟣 4YCL — Four-Year Cycle Low (~900–1458 bars)
Bitcoin's dominant macro cycle, aligned with the halving cadence. A confirmed 4YCL is the highest-conviction long entry the indicator produces.
---
**WHAT YOU SEE ON THE CHART**
• Cycle low labels — DCL / ICL / YCL / 4YCL printed below each confirmed pivot, with a star rating (★★★★★) showing signal confidence
• Confidence stars — 1 to 5 stars based on RSI divergence, MACD divergence, above-average volume, cycle regularity, and right translation
• Projection boxes — shaded zones to the right showing the expected timing and price range of the next DCL and ICL low
• Invalidation lines — dotted lines at the prior cycle low price (DCL INV / ICL INV). A daily close below these levels means the cycle count has failed
• Translation label — LEFT / MID / RIGHT showing where the cycle high printed relative to the midpoint. Right = bullish. Left = bearish
• MA Breakout — a 10-bar MA re-cross confirmation after price dips below it. Confirms the cycle low is likely in
• ⚡ Cycle Sync — when a projected DCL and ICL converge within ±4 bars. These aligned lows tend to produce stronger reversals
• ⛔ Cycle Fail — printed in bull markets when a new low undercuts the prior cycle low (a genuine warning). In bear markets the same event prints a muted "Bear ↓" label instead — because undercutting is expected behaviour in a downtrend
• Status label — plain-English line on the chart: current cycle day, countdown to next low, translation, MA status, and zone alerts
• Dashboard (top right) — 3 sections: WHERE ARE WE (progress bars for all four cycles), WHAT TO WATCH (countdowns, zones, invalidation levels, sync), SIGNAL QUALITY (stars, divergence, regularity, failure risk)
---
**CYCLE HEALTH TRAFFIC LIGHT**
The very first thing in the dashboard is a single traffic light — the overall Cycle Health.
🟢 HEALTHY — Right-translated, MA confirmed, no failure risk. Trend is with you.
🟡 NEUTRAL — Mixed signals or approaching a timing window. Reduce size, watch closely.
🔴 CAUTION — Left-translated, overdue cycle, or price near the invalidation level. Be defensive.
---
**HOW TO TRADE IT**
Step 1 — Check the Regime
Read the Regime row in the dashboard. BULL = cycle failures are meaningful warnings. BEAR = lower lows are normal, don't buy Bear ↓ labels expecting a reversal.
Step 2 — Read the bigger cycles first
Check YCL and 4YCL progress. If either is overdue (progress bar over 100%, shown in red), a major low may be forming. Don't trade DCLs aggressively against an overdue YCL.
Step 3 — Wait for the projection zone
The dashboard shows ⚡ IN ZONE when price enters the expected timing window. This is not a buy signal on its own — it means the low could arrive now. Reduce size and start watching for confirmation.
Step 4 — Confirm with MA Breakout + stars
Once a cycle low label prints, wait for the 10-MA re-cross (dashboard shows ✓ MA Break). Only trade 4–5 star setups at ICL or YCL timeframes for highest-probability entries.
Step 5 — Place your stop below the invalidation line
The DCL INV and ICL INV dotted lines mark the price level that must hold. A daily close below either line means the cycle count is invalid — exit the trade.
Step 6 — Exit into the next projected high
Take partial profits when cycle progress approaches 80–90% of the expected length. Full exit before an ICL is due if translation is shifting left or a ⛔ Fail label appears on a smaller cycle within the current run.
---
**SETTINGS**
Sensitivity — Low / Medium / High
• Low: fewer signals, stronger pivots only. Best for clean, rare setups.
• Medium (default): balanced. Works well on the daily BTC chart.
• High: catches more lows including early ones. More signals, more noise.
Individual cycle toggles let you show/hide DCL, ICL, YCL, and 4YCL independently. Colours, alerts, projection boxes, the phase ribbon, and the status label are all separately toggleable.
---
**ALERTS INCLUDED**
• High-conviction DCL (RSI + MACD divergence confirmed)
• Cycle failure (bull market context only)
• Cycle sync imminent (DCL + ICL converging)
• Price entering projection zone
• MA breakout confirmed
• Webhook-ready alertconditions for DCL / ICL / YCL / 4YCL detection
---
**RECOMMENDED TIMEFRAME**
Daily chart, BTCUSD or BTCUSDT. The cycle lengths are calibrated specifically for Bitcoin's daily rhythm. Lower timeframes will produce noise; weekly is too slow to catch DCLs meaningfully.
---
**COMMON MISTAKES**
✖ Buying a Bear ↓ label as if it were a bullish entry — it is an expected continuation, not a reversal
✖ Entering before the MA breakout is confirmed — the low may not be in yet
✖ Trading DCLs when Cycle Health is red — you are fighting the dominant trend
✖ Holding through an ICL when translation has already shifted left — the cycle is weakening and lower lows are likely Indikator
Volatility Reversion Bands Pro [JOAT]VOLATILITY REVERSION BANDS PRO
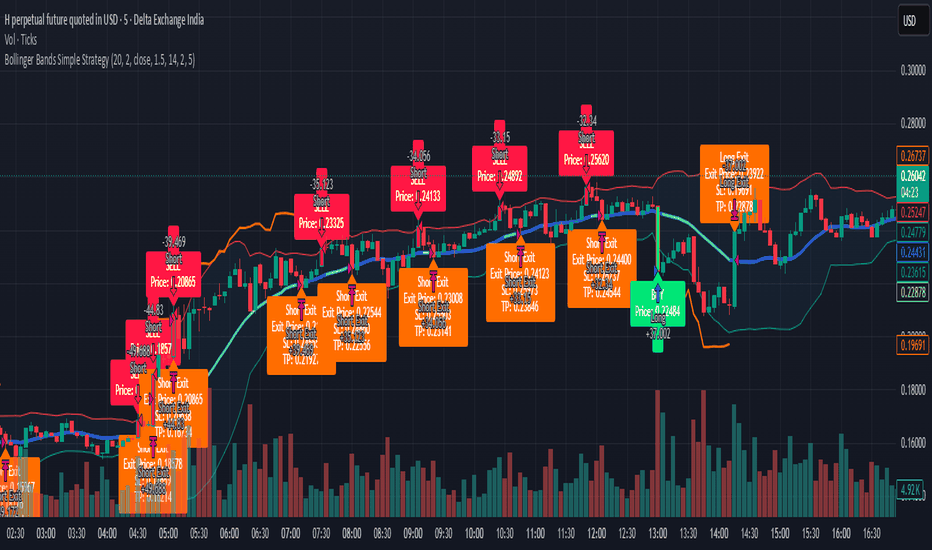
A two-layer reversion envelope: inner Bollinger band for the normal volatility envelope, outer ATR-extended band for the extreme envelope. Signals only fire when price has reached the outer ring — the inner band is context, the outer band is the trigger. The result is a clean mean-reversion engine that respects the difference between "stretched" and "actually stretched".
Two envelopes, one principle
Inner band — classic Bollinger: basis (SMA or EMA) ± stdev × multiplier. The familiar 20-period, 2-sigma defaults are preserved.
Outer reversion band — the outer envelope extends inner band ± ATR × multiplier . This is the band that triggers signals. Setting the ATR multiplier high makes signals rarer but deeper; setting it low makes them frequent and shallower.
Reversion bands using stdev alone collapse in low-volatility regimes (too many false signals) and explode in high-volatility regimes (signals come too late). The ATR extension on top of stdev fixes both: ATR adds a constant-floor protection in quiet markets and scales the outer band proportionally in loud ones.
Strong vs weak signals
Two signal tiers from a single channel-ratio read (close position within the outer band, normalised 0–1):
Strong signals — fire on the outer band itself (ratio ≤ 0 or ≥ 1). The high-conviction reversion read.
Weak signals — fire when ratio reaches a configurable near-band threshold (default 0.10 / 0.90). The "approaching outer band" read — useful for traders who want earlier hints. Easily disabled.
A signal cooldown suppresses same-side repetition; an exhaustion arrow prints when N consecutive bars (default 3) all live in the outer-band zone — a configurable escalating-glyph string ("^", "^^", "^^^"…) makes the run length visible at a glance.
Volatility regime classification
Independent of signals, the script classifies the current volatility regime by comparing current stdev to its own rolling average over a long lookback (default 100 bars):
Low regime — stdev / avgStdev below the low threshold (default 1.0×). Reversion is more reliable here.
High regime — above the high threshold (default 2.0×). Reversion is less reliable here; trends become dominant.
Normal regime — in between. Default mode.
Background tinting (toggleable, transparency-controlled) paints the chart by regime so the trader can see at a glance whether the current environment is suitable for reversion. This is the "do not fight the tape" filter — when the background is hot, every reversion signal is lower-conviction by definition.
Visual system
Bar gradient — bars are coloured by their position-in-band ratio (bull → mid → bear via plasma palette). At a glance you can see where price is sitting in the channel without reading the value.
Inner band fill — toggleable shoulder fill between BB and outer reversal bands with configurable transparency.
Inner BB lines and basis line are each independently toggleable for traders who want a minimalist or full envelope view.
Signal label style — Glyph (compact), Text (verbose), or Both.
A locked Plasma palette (yellow bull, magenta bear, violet mid) on a deep-void background gives the chart a distinctive look without competing with price action.
Dashboard
Monospaced table, positionable to any of nine corners, with togglable legend footer. Rows surface current basis, inner band values, outer reversion band values, channel ratio %, stdev / avgStdev ratio, regime label, last signal direction with age, and an exhaustion run counter.
Alerts
Four alert conditions, each independently controllable:
Strong Long / Short (outer band touch reversion)
Weak Long / Short (near-band threshold)
Vol Regime Change
Exhaustion Arrow (consecutive bars in outer-band zone)
How to read it
Two reads, in order of conviction:
Strong signal in a Low or Normal regime — the script's intended sweet spot. The outer band has been touched, price is statistically far from its mean, and the volatility environment supports the idea of mean-reversion.
Exhaustion arrow — when 3+ bars sit in the outer band, you usually have either a genuine breakout (the bands themselves will start to expand) or an exhaustion (the next reversal candle will be the signal). Either way, the next move is meaningful.
In a High regime, treat strong signals as cautionary at best — the bars are coloured by ratio for a reason; the gradient will tell you when one side is dominating.
Suggested settings
Defaults (length 20, stdev mult 2.0, ATR mult 1.5) are tuned to 1H–4H on liquid markets — the classical Bollinger settings plus a 1.5-ATR outer cushion. For 5m–15m, drop length to 14 and ATR multiplier to 1.0. For daily and above, raise length to 50 and ATR multiplier to 2.0. The regime thresholds (low 1.0×, high 2.0× of the long-run stdev average) are conservative — tighten the bands if your instrument is unusually quiet.
Originality / what's reused
Bollinger Bands and ATR are public-domain primitives. The implementation — the outer-band = inner-band ± ATR construction, the channel-ratio bar gradient, the regime classifier with auto-tinted background, the exhaustion-arrow consecutive-bar run logic, the weak/strong signal tiering, and the dashboard's monospaced regime-aware layout — is JOAT-original and tuned together. No third-party code reused.
Open source
Published open-source under the default Mozilla Public License 2.0. Section-headed source, tooltips on every input, helper functions documented inline. The band engine, the regime classifier, the exhaustion logic, and the dashboard are independent modules — fork or extend any single one without reading the whole file.
Limitations
Reversion bands are a counter-trend tool by construction. In sustained one-sided moves the outer band will be repeatedly touched without producing a profitable reversion — the High regime tint and the exhaustion-arrow run logic both exist to warn you when you are in this state. Signals are confirmed on bar close (non-repainting), so an intra-bar wick into the outer band that gets reabsorbed will not fire.
—
-made with passion by jackofalltrades
Indikator

SHIVA LT + LS Blend**LT + LS Blend — All-in-One Scalping & Momentum Indicator**
A comprehensive indicator that combines key level analysis, liquidity sweep detection, opening range breakout strategy, advanced VWAP bands, multi-timeframe confluence, and a real-time dashboard — all in a single overlay. Built for intraday traders focused on scalping and momentum entries with clearly defined risk.
---
**WHAT IT DOES**
This indicator blends two trading methodologies into one clean overlay:
- **LT (Key Level Confluence)** — identifies the most significant price levels where institutional and retail orders cluster
- **LS (Liquidity Sweep)** — detects when price sweeps a swing level and reverses, signalling a high-probability entry
When both methodologies agree on the same bar, a **★ CONFLUENCE signal ★** fires — the highest-conviction entry the indicator produces.
---
**SIGNALS**
🔴 **OPEN SELL / 🟢 OPEN BUY** — fires within the first 4 bars of the session when a strong directional candle touches a key resistance or support level (PDH, PM High/Low, gap). Designed to catch the first meaningful move of the day before swing pivots are established.
**BUY / SELL (Liquidity Sweep)** — triggers when price wicks through a confirmed swing low/high, closes back inside, and is confirmed by elevated volume (default 1.5× average). Graded by volume multiplier: Watch → Confirmed → Grade A → High Conviction. Signals showing **✓δ** are additionally confirmed by Volume Delta agreeing with the direction.
**↑ VWAP BUY / ↓ VWAP SELL** — price touches the VWAP or ±1SD band and bounces with a confirmed reversal candle.
**▲ ORB BREAK / ▼ ORB BREAK** — first clean close above OR High or below OR Low after the opening range locks.
**↩ ORB RETEST BUY / SELL** — price returns to retest the broken ORB level after a confirmed breakout.
---
**KEY LEVELS**
Drawn automatically each session:
- **PDH / PDL** — previous day high and low (dashed)
- **PM High / PM Low** — pre-market high and low (dotted)
- **Opening Price** — first print of the market session
- **OR High / OR Low** — opening range (configurable 1–120 min)
- **Hourly Opens** — last 8 hourly candle opens (auto-cleanup, no accumulation)
- **Previous ATH** — rolling 252-day high
---
**PIVOT POINTS & CPR**
Standard daily pivot points drawn at the start of each session:
- PP, R1, R2, S1, S2
- CPR Top and CPR Bottom (Central Pivot Range)
Narrow CPR = trending day. Wide CPR = choppy/range day.
---
**VWAP + STANDARD DEVIATION BANDS**
Session VWAP with manually computed ±1SD and ±2SD bands (resets daily). Bands are the most reliable VWAP-based entries:
- +1SD / -1SD — first rejection zone, high probability bounce
- +2SD / -2SD — extended move, mean-reversion territory
---
**S/R ZONE BOXES**
Transparent green (support) and red (resistance) zones drawn at each key level. Each zone:
- Tracks how many times price has touched it during the session
- Shows buy/sell volume split at the zone (e.g. B:58% S:42%)
- Becomes more opaque as touch count increases, indicating a tested and respected level
Zones: PDH, PDL, OR High, OR Low, R1, S1, VWAP +1SD, VWAP -1SD
---
**SESSION AUTO-FIBONACCI**
Fibonacci retracement levels drawn from the running session high to session low — updating in real time as new highs and lows are made throughout the day. Shows 38.2%, 50%, 61.8% by default (23.6% and 78.6% optional). The 50% level is highlighted separately.
---
**ORB STRATEGY TOOLS**
- Visual ORB box drawn when the opening range locks
- Extension targets at +1R, +2R above OR High and -1R, -2R below OR Low
- Breakout signal fires on the first clean break
- Retest signal fires when price returns to the broken level
---
**MULTI-TIMEFRAME DASHBOARD**
Real-time table (top-right by default) showing for 5 configurable timeframes:
| TF | Trend | RSI | Strength | Signal |
|---|---|---|---|---|
| 2m | ▲ BULL | 62 | ███░ 71% | BULL ▲ |
| 5m | ▲ BULL | 55 | ██░░ 45% | BULL |
| 10m | ▼ BEAR | 48 | █░░░ 22% | NEUT |
| 1H | ▲ BULL | 61 | ████ 80% | BULL ▲ |
| 1D | ▲ BULL | 63 | ████ 82% | BULL ▲ |
| VIX | 18.4 🟡 | | | |
| Vol Δ | ▲ +12.4K B:61% S:39% | | | |
- **Trend** — EMA8 vs EMA21 cross direction
- **RSI** — momentum reading (colour-coded: green overbought zone, red oversold)
- **Strength** — EMA separation as a % (bar chart visual)
- **Signal** — combined reading: BULL ▲ / BULL / OB ! / BEAR ▼ / BEAR / OS ! / NEUT
- **VIX** — current fear/volatility gauge with emoji indicator (😌 calm → 🔥 panic)
- **Vol Delta** — session cumulative buy/sell volume split
Dashboard is configurable: Top Right / Bottom Right / Top Left / Bottom Left and Small / Normal / Large.
---
**VOLUME DELTA**
Per-bar buy and sell volume estimated using candle position (close-low / high-low method). Bars where buyers dominate show a faint green background tint; seller-dominated bars show faint red. The running session cumulative delta and buy/sell percentage are shown in the dashboard.
---
**MOVING AVERAGES**
- Fast EMA (default 8) and Slow EMA (default 21) on the current timeframe
- 200 SMA on current timeframe (plotted as circles to reduce clutter)
- HTF1 EMA and SMA (default 1H)
- HTF2 SMA (default Daily)
---
**MARKET STRUCTURE**
Swing pivots labelled as HH (Higher High), HL (Higher Low), LH (Lower High), LL (Lower Low) — provides a clean visual of the current trend structure without cluttering the chart with lines.
---
**TRAIL STOP (ATR Chandelier)**
Dynamic trailing stop that ratchets with price — locks in profits as a trend develops and flips direction when price closes through the stop level. Colour-coded green (bull) and red (bear). Multiplier and width are fully adjustable.
---
**SETTINGS**
Every visual element is customisable:
- All colours (with colour pickers)
- All line widths (1–4px)
- EMA/SMA periods and timeframes
- Opening range duration (1–120 min)
- Fibonacci levels (individual toggles)
- ATR multipliers for sweep detection, trail stop, zone width
- Volume multiplier threshold
- Signal cooldown bars
- Dashboard position and size
- S/R zone width and volume display
---
**BEST USED ON:** 1m, 2m, 5m charts for scalping. Works on any liquid instrument — equities, futures (ES, NQ, MES), and Forex majors.
**RECOMMENDED CHART:** SPY, QQQ, ES1!, NQ1! on 5-minute. Indikator

Strategie
Indikator

Indikator

Indikator
Indikator
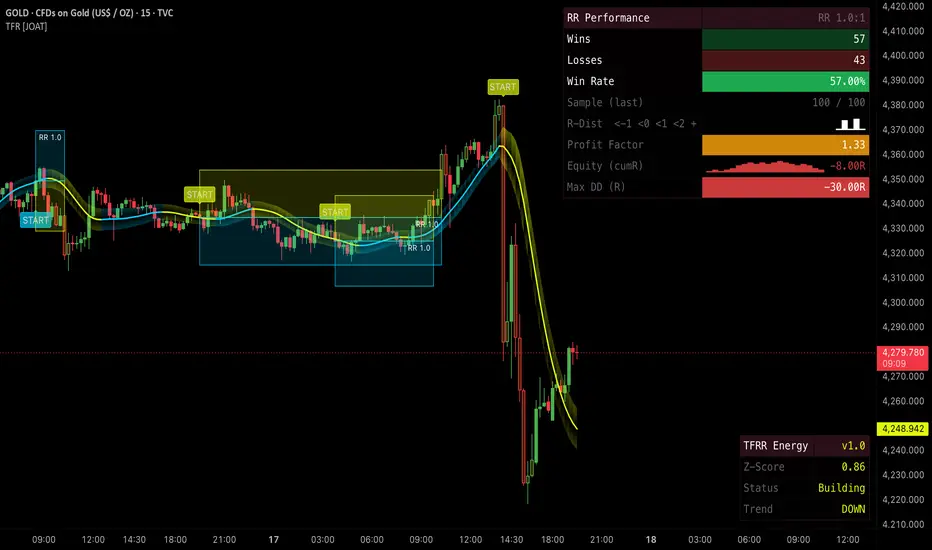
Tension Flow RR [JOAT]TENSION FLOW RR
A trend-signal engine wrapped in a full risk-reward execution layer — Hull Moving Average baseline, Z-score normalised tension reading, ATR-sized stops and targets, optional R-multiple-triggered trailing stop, and a rolling-window backtest that tracks every closed trade and reports win rate / cumulative R / equity sparkline directly on the chart. Built for traders who care about what happens after the signal fires , not just the signal itself.
Trend signal — HMA + Z-score tension
Two cleanly chosen primitives:
Hull Moving Average (HMA) — a chained-WMA construct that delivers a fast, low-lag trend baseline. The square-root final smoothing step is what makes it noticeably less laggy than EMA at the same length.
Z-score of (close − HMA) — the residual is normalised by its own rolling stdev so the tension reading is dimensionless and comparable across instruments. |Z| above the overextended threshold (default 2.0) tags the move as overextended in the Energy Dashboard.
A new trend signal fires when the configured signal cooldown has elapsed and the directional logic flips. The signal is non-repainting (confirmed on bar close).
ATR-sized stops and targets
Each signal automatically renders:
SL box — a translucent box sized at SL-ATR × multiplier (default 2.0 × ATR-200) from entry, drawn in the bear colour.
TP box — sized at SL distance × Risk:Reward ratio (default 1.0R), drawn in the bull colour.
Trailing-stop line (optional, JOAT enhancement) — when enabled and price moves more than the activation threshold (in R-multiples) in your favour, the stop ratchets behind price by Trail-ATR × multiplier. Configurable bar-by-bar trail step, optional break-even lock at activation.
This is full execution geometry — you can see entry, stop, target, and the trail's path on the chart at all times.
Rolling-window backtest (the headline)
The script tracks the last N closed trades (configurable, default 100) and produces live performance statistics that update tick-by-tick:
Total trades, wins, losses, breakevens.
Win rate, with colour-coded cell — green above the configured "green" threshold, amber between, red below.
Average R per trade, best R, worst R.
Cumulative R since the start of the window.
Profit factor.
Expectancy in R-multiples.
Unicode equity sparkline — a compact in-cell chart of the last N cumulative-R points, drawn directly in the dashboard cells with block-character glyphs.
Trades are evicted FIFO when the history window is exceeded, so the win rate is always a rolling read of recent performance, not lifetime stats — which is the right read for a working trader.
Two dashboards
Energy Dashboard (Bottom-Right by default) — compact 22-row read of current Z-score, trend direction, HMA value, overextension flag, ribbon width, ATR, and signal state.
RR Performance Dashboard (Top-Right by default) — 29-row institutional read of the rolling backtest stats above, plus the equity sparkline.
Both are independently positionable, sizeable, and toggle-able. The split lets you run "engine state" on one corner and "PnL state" on the other without overlap.
Trend ribbon
The HMA is rendered with an ATR-band ribbon (configurable width) whose transparency is dynamically modulated by current Z-score — the ribbon visually breathes with tension. Toggle off if you prefer a clean line.
Alerts
Alert conditions are exposed for new signals, SL hits, TP hits, trailing-stop hits, overextension events, and two win-rate threshold alerts: Win-Rate High (crossover above the configured high level) and Win-Rate Low (crossunder below the configured low level). Win-rate alerts are suppressed until a minimum sample size has been recorded, so you do not get a 100% win-rate alert from a single lucky trade.
How to read it
The script is designed to be used as a closed loop:
Take the trend-start signal as the entry. The HMA + Z-score logic is the signal; the SL/TP boxes are the geometry.
If trailing is enabled, the line will appear once unrealised PnL exceeds the activation threshold and will ratchet from there.
When the trade closes, the rolling backtest updates — watch the win-rate colour and the cumulative-R sparkline.
If win-rate trips the low alert, that is the script telling you the current regime does not suit the current settings.
The cumulative-R sparkline is the most honest single line on the dashboard — if it is climbing, the engine is doing its job; if it is grinding flat or down, it isn't, and you should re-evaluate parameters or stand aside.
Suggested settings
Defaults (HMA 50, Z 50, 2.0 R-stop, 1.0 R-target) are calibrated for 1H–4H on liquid markets. For lower timeframes drop both lengths proportionally and consider a Risk:Reward above 1.0 to offset the higher signal frequency. For daily and above, raise lengths and lower the signal cooldown.
Originality / what's reused
HMA, Z-score, and ATR-sized stops are public-domain primitives, used here as building blocks. The implementation — the Z-normalised tension reading, the R-multiple activation trailing stop with break-even lock, the colour-coded rolling-N backtest, the Unicode equity sparkline rendered inside table cells, the dual-dashboard split, and the sample-gated win-rate alerts — is JOAT-original and tuned together. No third-party code reused.
Open source
Published open-source under the default Mozilla Public License 2.0. The execution geometry, the rolling-trade tracker, the Z-modulated ribbon, and the sparkline renderer are each isolated so you can adapt any one without reading the whole file. Forks welcome with credit.
Limitations
The rolling backtest is a descriptive read of recent signal performance under the current settings — it is not a predictive metric and changing the parameters resets the read. SL / TP geometry assumes a single position per signal direction; the script is not a position manager. Trailing stop fires on confirmed bars; intra-bar movement past the trail level is registered but the close determines the outcome.
—
-made with passion by jackofalltrades
Indikator

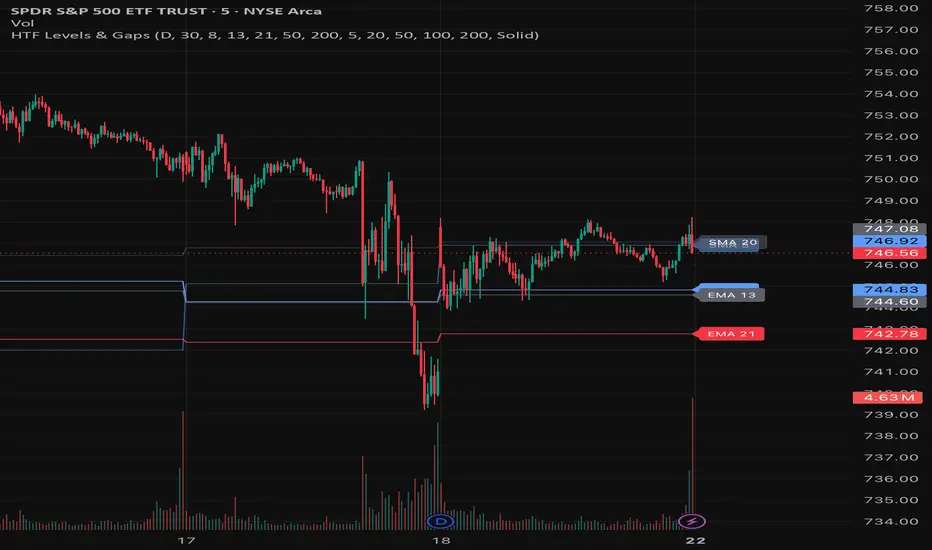
HTF Gap Zones + MA SuiteThis indicator plots higher-timeframe moving averages and highlights unfilled gap zones directly on your current chart.
It uses a configurable anchor timeframe, such as Daily or Weekly, to calculate EMA and SMA levels while allowing you to view them on lower timeframes. This helps traders keep key higher-timeframe structure visible without constantly switching charts.
The script also scans recent higher-timeframe candles for bullish and bearish gaps. Only unclosed gaps are displayed, making it easier to identify potential areas of interest, imbalance, support, resistance, or price reaction zones.
Features:
Configurable higher-timeframe anchor
Detects bullish and bearish unfilled HTF gaps
Adjustable gap lookback
Custom bullish and bearish gap colors
Five customizable EMAs
Five customizable SMAs
Optional labels for moving averages
Solid, dotted, or dashed visual style
Designed to keep higher-timeframe context visible on intraday charts
This tool is useful for traders who want to combine higher-timeframe structure, gap/imbalance zones, and trend-following moving averages in one clean overlay. Indikator

EMA Bot Signals + VPoCEMA Bot Signals + VPoC
A swing-trading toolkit built around a 9/21 EMA crossover, graded by trend slope and volume, with a Volume Point of Control (VPoC) used as a dynamic target. It visualizes a full entry → stop → target lifecycle on the chart, plus candlestick reversals and a higher-timeframe trend filter, so you can see why a setup qualifies — not just that the EMAs crossed.
What it does
- EMA cross signals (9/21): marks bullish crosses, and "anticipate" entries just before a cross when the fast EMA is already turning up inside a tight gap.
- Signal strength: every entry is graded Strong / Moderate / Weak from EMA slope (%/bar) and volume vs. its average, so weak crosses are visibly de-emphasized.
- VPoC: plots the heaviest-volume price level over a configurable lookback. When VPoC sits >=8% above the recent crossover average, it is used as the T1 target (otherwise targets are derived from EMA spread). Optional historical daily-session VPoC lines on intraday charts.
- Trade lifecycle: on a signal it tracks entry, stop, T1, T2, moves the stop to breakeven once T1 is hit, and marks the exit (T2, stop, breakeven-stop, or bear cross).
- Exit context: flags stalling (slope fading + below-average volume), momentum collapse, and T1-recovery (slope turning back up inside the T1 zone).
- Daily-trend filter: while the daily trend is up (daily EMA9 > EMA21 and rising), soft exits are held and the background tints green — hard stop/targets always fire.
- Candlestick reversals: marks Engulfing, Hammer/Shooting Star, Morning/Evening Star, Piercing/Dark Cloud, and Harami (bullish below the bar, bearish above).
- Corner table: live read of alignment, slope, volume ratio, signal strength, VPoC distance, pattern, and daily trend.
How to use it
Add to any symbol/timeframe (designed for swing timeframes like 1h-1D). Use the graded entry triangles with the corner table to filter for Strong/Moderate setups in the direction of the daily trend, and treat the plotted stop/T1/T2 and VPoC as a planning guide. Inputs let you tune EMA lengths, stop %, anticipate %, target lookback, VPoC bars/levels, and which overlays to show.
Notes
Hover any marker for a tooltip with the entry/stop/targets/VPoC/slope/volume detail behind it. Best on liquid markets where volume is meaningful for the VPoC calculation.
This is an analysis and education tool, not financial advice. It does not place orders and past behavior of any signal does not guarantee future results. Always do your own research and manage risk. Indikator

Indikator
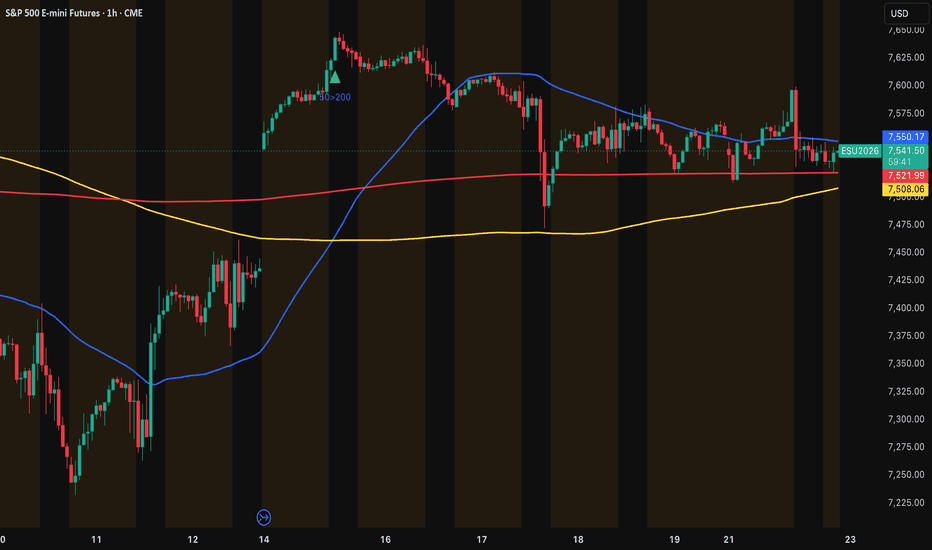
Multiple EMA + SMA (8-in-1, or 4 of each)This combo indicator takes Tradingview's default SMA and EMA Pinescript code and basically duplicates it 8 times. There are 4 EMAs and 4 SMAs, each configurable to their own timeframe, line, color, etc. I did this so I could see several combinations of moving averages on various chart timeframes, such as:
- Daily chart: 200 SMA, 50 SMA, 20 EMA
- 4 hour chart: 200 SMA, 50 EMA, 20 EMA
- 1 hour chart: 50 EMA, 20 EMA, 9 EMA
- 30 minute chart: 50 EMA, 20 EMA, 9 EMA
Moving Averages Are Filters, Not Triggers: The moving average smooths price action to reveal the dominant market current, not to provide buy or sell signals alone. It filters market noise but requires price action confirmation for entry decisions.Therefore it's important to note the **slope** direction of the MA too.
Matching Time Frame and Holding Period: Using a moving average setting built on a timeframe inconsistent with your trade duration (e.g., a short moving average on a multi-month trade) causes frequent whipsaws. The setting must reflect your trade horizon.
Three Roles of Moving Averages on Any Time Frame:
1. **Tide (Slowest Line)** — Indicates the overall market direction and which side to trade.
2. **Trend (Middle Line)** — Represents the active trend you trade around.
3. **Timing (Fastest Line)** — Identifies pullback zones and potential entry points.
Consistency and Discipline are Crucial: The hardest part of trading is not knowing the settings but patiently waiting for alignment of the tide, trend, and timing lines, and resisting impulsive trades.
When to use EMA or SMA: Shorter time frames use EMAs for faster reaction to price changes, whereas longer time frames use SMAs to smooth out noise and emphasize broader trends. The 200-day SMA is particularly important as it is the most widely followed moving average, creating real support/resistance due to collective market attention.
Examples and Practical Application:
- A trader looking for a long trade on the daily chart might identify:
- Price above a rising slope 200 SMA (tide) = only look for long trades
- Price above a rising slope 50 SMA (trend) = confirms a healthy trend
- Price pulls back to 20 EMA (timing zone) = start watching for price action confirming the entry
- Crossovers like the "golden cross" (50 SMA crossing 200 SMA) are only contextual signals indicating trend shifts, don't use them as entry triggers.
- On faster charts (1-hour and 30-minute), multiple touches of moving averages happen frequently due to noise; thus, confirmation from price action, volume, or other indicators is essential.
The core takeaway here is that knowing precise moving average numbers is easy. Mastering the **patience, discipline, and risk management** to trade only when the tide, trend, and timing all align is what really separates successful traders from losing ones. Indikator