Indikator

Daily 5-SMA (intraday)Daily 5-SMA Equivalent
This indicator translates a daily Simple Moving Average into its mathematically equivalent period for any intraday (or higher) timeframe, so the line you see on a 5-minute chart represents the same lookback window as the daily SMA on a daily chart — no manual period recalculation needed.
How it works
The script measures how many bars of the current timeframe fit inside the total minute-span of the reference SMA. For example, a 5-day SMA covers 1,950 minutes on a stock market (5 × 390 min/day). On a 5-minute chart that becomes a 390-period SMA; on a 15-minute chart it becomes a 130-period SMA. The conversion is automatic whenever you change timeframes.
An information table in the top-right corner always shows the active timeframe, the calculated equivalent period, the reference setting, and the selected market type — so you can verify the math at a glance.
Inputs
Source — Price field used for the calculation (default: close).
Reference Days — The number of daily bars the SMA spans. Default is 5 (the classic daily 5-SMA). Accepts 1–50.
Market Type — Determines how many minutes constitute a trading day:
24h — 1,440 min/day, for Forex and Crypto markets.
Stock — 390 min/day (6.5-hour session), for equities and equity futures.
Timeframe support
The period conversion handles seconds, minutes, hours, days, weeks, and monthly timeframes. On daily or higher timeframes the indicator still plots correctly, though it is most useful on intraday charts.
Alerts
Four alert conditions are included:
Price crosses above the SMA equivalent
Price crosses below the SMA equivalent
SMA is rising
SMA is falling
Usage notes
Set Market Type to Stock for equities and NQ/ES/MES futures. Use 24h for Bitcoin, Ethereum, Forex pairs, or any continuously traded instrument. The displayed equivalent period will always be at least 1, regardless of how high a timeframe you are viewing. Indikator

Indikator

Indikator

Indikator
Indikator

Indikator

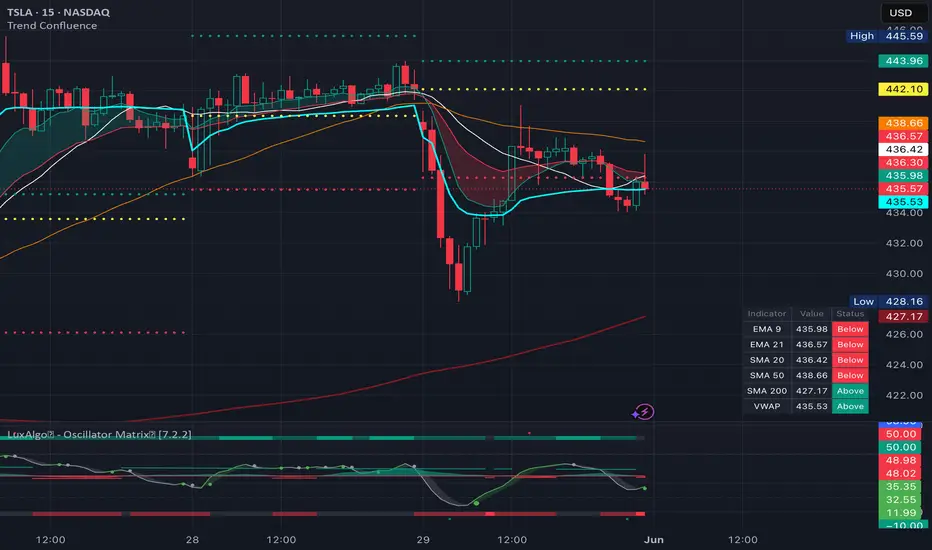
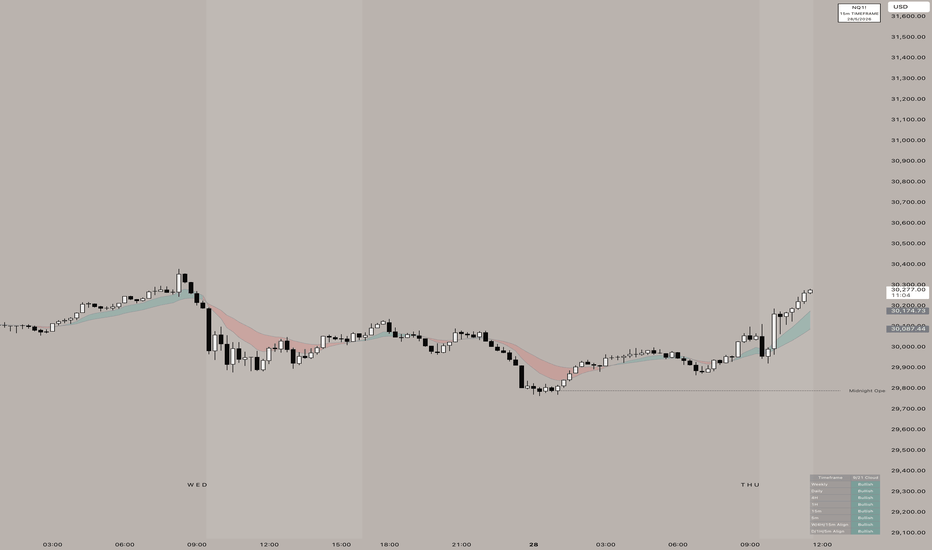
Multi Time Frame Alignment ( 9 / 21 EMA cloud based )This indicator is a complete, multi-timeframe trend alignment tool built around the classic 9 and 21 Exponential Moving Averages (EMA). It is designed to keep your charts clean while providing instant, at-a-glance confirmation of market structure across macro and micro timeframes.
Perfect for day traders and swing traders who require strict higher-timeframe confluence before executing a setup.
Key Features:
Multi-Timeframe Dashboard: A fully customizable on-screen table that tracks the 9/21 EMA trend across the Weekly, Daily, 4H, 1H, 15m, and 5m timeframes.
Fractal Alignment Warnings: The dashboard automatically calculates two distinct alignment modules:
Swing/Macro Alignment: Weekly / 4H / 15m
Intraday Alignment: Daily / 1H / 5m
"NO TRADE ZONE" Alerts: If your selected timeframes are not completely in sync (e.g., the 1H is bullish but the 5m is bearish), the alignment row will distinctly flag a "NO TRADE ZONE" to help prevent entering during choppy or corrective price action.
Toggleable Chart Cloud: Visually plots the 9/21 EMA lines and fills the cloud between them directly on your current chart. This can be easily toggled off in the settings if you prefer naked price action.
Integrated Session VWAP: Includes a built-in, toggleable VWAP line with customizable thickness for intraday liquidity and mean-reversion references.
Highly Customizable UI: Every visual element can be adjusted. You can change the table position, text size, and independently adjust the colors and transparencies of the table clouds versus the chart clouds. Indikator
Indikator

Indikator

Edo HMA CoreEdo HMA Core — Clean Trend Reading Built on the Hull Moving Average with Slope, State, Fast Acceleration, Inflexion Markers and Information Panel
The Hull Moving Average was introduced by Alan Hull in 2005 to solve the permanent dilemma of classical moving averages: the smoother the average, the more lag; the faster the average, the more noise. By combining three weighted moving averages with mathematically derived lengths, the HMA produces a curve that is visually smooth but reacts to price flips with significantly less lag than an equivalent EMA or SMA.
Edo HMA Core takes that original idea and turns it into a complete trend indicator. On its own, an HMA is just a line. With Edo HMA Core, that line gains state colour, a percentage slope reading, an automatic inflexion detector, a translucent state fill between price and average, and a second faster HMA that adds an acceleration reading. Five coordinated layers on a single overlay, designed to keep the visual purity of a moving average while delivering far richer information about the regime of the asset.
THREE HMA VARIANTS
A single dropdown selects between three Hull constructions:
— Standard — Alan Hull's original three-WMA formula. Balanced, default option. Recommended for 4H, daily and weekly charts.
— Exponential (EHMA) — Variant built with EMA instead of WMA. Slightly smoother and slower to react. Useful on highly volatile assets or low timeframes.
— Triple (THMA) — Variant using three WMAs with 1/3, 1/2 and full lengths weighted for sharper turns. Most reactive variant, useful for early inflexion detection at the cost of a small noise increase.
The three variants share plots, markers and panel — only the calculation engine of the line changes.
SLOPE AND STATE CLASSIFICATION
Slope is calculated as the difference between the current HMA value and its value a few bars back:
slope = HMA − HMA
The Slope Lookback parameter (default 2) controls how reactive the reading is. Low lookbacks catch turns earlier; high lookbacks filter noise.
Based on the sign of the slope, the indicator assigns one of three states:
— Trend Up — Slope > 0. Main HMA, fast HMA and fill turn green.
— Trend Down — Slope < 0. Main HMA, fast HMA and fill turn red.
— Flat — Slope = 0. Lines turn neutral teal.
The colour system is consistent across every visual element, so the regime is readable at a glance without needing to look at the panel.
FAST HMA AND ACCELERATION CROSSES
A second HMA is calculated with a shorter length (21 by default), sharing type and source with the main. The relationship between fast and main is read as an acceleration measure:
— Fast above main → recent momentum accelerating relative to the underlying trend
— Fast below main → recent momentum decelerating or reversing
Each cross is automatically marked with an X-cross: green below the candle for a Fast Cross Up, red above the candle for a Fast Cross Down. These are acceleration signals, not trend-change signals — for that, the indicator provides explicit inflexion triangles.
INFLEXION MARKERS
The most structural signals of the indicator. Every time the main slope changes sign, the indicator draws a triangle:
— Flip Up (▲) — Green triangle below the candle when slope crosses from negative to positive. Start of a new bullish regime.
— Flip Down (▼) — Red triangle above the candle when slope crosses from positive to negative. Start of a new bearish regime.
Every flip is accompanied by a simultaneous update of the HMA colour, fast HMA colour and state fill.
PRICE / HMA CROSSES AND STATE FILL
Direct crosses of price with the main HMA do not produce visual markers (to keep the chart clean) but are available as alert conditions:
— Price Crossed Above HMA — close reclaims the main HMA. Bullish reclaim.
— Price Crossed Below HMA — close loses the main HMA. Loss of dynamic support.
Between price and HMA the indicator draws a translucent fill whose colour matches the active state. Fill Opacity is configurable from 50 (very opaque) to 99 (almost invisible), default 85. The fill provides an immediate state reading and makes the magnitude of the price/HMA separation visible at all times.
INFORMATION PANEL
A five-field panel summarises the current regime in real time:
— State — Trend Up / Trend Down / Flat
— Slope — current slope as a percentage of the HMA value (e.g. +4.402%, −0.739%)
— Price vs HMA — distance of price from the HMA as a percentage (e.g. +50.25%, −13.00%)
— Fast — relative position of the fast HMA versus main (Fast > Slow, Fast < Slow, Off)
— Type — current variant and length (e.g. Standard - 55)
Numeric fields are coloured according to the active state. The panel can be placed in any of the four chart corners and resized to Small or Medium. Dark and Light themes adapt the panel to the chart background.
CONFIGURATION
— Hull MA: HMA Length (default 55), HMA Type (Standard / Exponential / Triple), Source (default close), HMA Line Width (1-5)
— Fast Cross: Show Fast HMA Cross, Fast HMA Length (default 21), Fast HMA Width (1-4)
— State: Show Inflexion Markers, Slope Lookback in bars (1-10), Fill Between Price and HMA, Fill Opacity (50-99)
— Style: Bull Color, Bear Color, Neutral Color, Theme (Dark / Light)
— Panel: Show Panel, Panel Position (four corners), Panel Size (Small / Medium)
ALERTS
Six predefined alert conditions cover every meaningful event:
— HMA Flip Up — slope crosses from negative to positive
— HMA Flip Down — slope crosses from positive to negative
— Fast Cross Up — fast HMA crosses above main
— Fast Cross Down — fast HMA crosses below main
— Price Crossed Above HMA — close reclaims the main HMA
— Price Crossed Below HMA — close loses the main HMA
All alerts evaluate on bar close in the active timeframe. The two inflexion alerts work well for medium and long-term position management; the two fast crosses are common in active management; the two price/HMA alerts confirm breaks of the average in mature trends.
HOW TO READ IT
A clean reading combines the five layers into common patterns.
Clean bullish reactivation — After prolonged Trend Down, a Flip Up appears, price reclaims the HMA, the fast crosses above the main and the fill switches from red to green. The cleanest sequence for confirming a new bullish regime.
Bullish exhaustion — In a sustained Trend Up, slope shrinks while price keeps advancing. A Fast Cross Down appears before any slope change. Usually precedes a Flip Down.
Bearish capitulation — In an advanced Trend Down, a Fast Cross Up appears inside the red fill. If price then reclaims the HMA and slope turns, a Flip Up arrives.
Sideways noise — In flat zones, slope crosses zero repeatedly and alternating flips appear within a few bars. Raise Slope Lookback to 5+ bars to filter non-structural flips.
OPEN SOURCE
Edo HMA Core is published as a free open source indicator. The full Pine Script is publicly accessible on TradingView for study, adaptation and integration into any workflow. Part of the Edolab Markets free tools ecosystem alongside Edo SuperTrend Core, Edo EMA Core Cross, Edo Sentiment Map, Edo TRIX Core Cross, Edo RSI Dual, Edo Multi Stoch, Edo A/D Flow Core, Edo Liquidity Zones, Edo ZigZag Auto Fib SR and Edo Bands Fusion.
This indicator is a technical analysis tool for educational and informational purposes only. It does not generate automatic buy or sell signals and should not be considered financial advice. Trading financial markets involves significant risk of capital loss. Past performance does not guarantee future results. Always use proper risk management. Indikator

Auto Range / Lateral Consolidation Box DetectorAuto Range / Lateral Consolidation Box Detector
Overview
The Auto Range / Lateral Consolidation Box Detector is designed to automatically identify and draw price ranges where a stock is moving sideways after a prior advance.
Instead of manually drawing rectangle boxes around consolidation areas, this indicator detects them objectively using price containment, range width, prior trend movement, ADR, moving-average structure, and optional volume/RSI filters.
The purpose is to help traders identify:
lateral consolidations
tight launch shelves
continuation bases
range breakouts
failed ranges
breakout/retest zones
early momentum continuation structures
This tool is especially useful for traders who look for stocks that have already shown strength, pause in a controlled range, and then attempt to continue higher.
Core Concept
Many strong momentum moves do not happen randomly. They often follow a repeatable structure:
Prior advance → sideways range → breakout → continuation
This indicator attempts to locate that sideways range automatically.
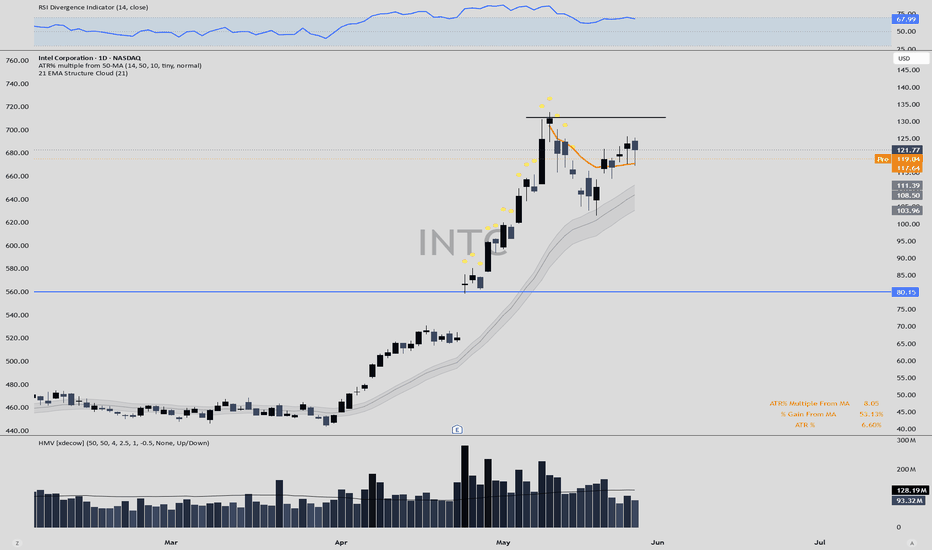
The blue dashed boxes show detected consolidation zones. When price breaks above a completed range, the indicator can mark the breakout and preserve the prior box so the trader can review the structure historically.
The goal is not to predict breakouts blindly. The goal is to make range structure easier to detect, measure, and trade with defined risk.
What the Indicator Detects
The indicator identifies two main types of structures:
1. Standard Rectangle Range
This is a broader lateral consolidation that usually forms over a larger number of candles.
It is useful for detecting:
multi-week consolidations
continuation bases
sideways digestion after an advance
breakout/retest setups
controlled pullbacks above moving averages
A standard rectangle is best used when price has already advanced and then begins moving sideways in a defined box.
2. Tight Launch Shelf
This is a shorter, tighter range that often forms just before a momentum expansion.
It is useful for detecting:
short pauses near highs
high-tight continuation shelves
pre-breakout compression
momentum names that do not build long bases
stocks that pause briefly before expanding again
This feature was added because some of the strongest stocks do not consolidate for weeks. They may only pause for several sessions before breaking out.
How the Boxes Work
The indicator measures the range using completed prior candles only.
This is important because the breakout candle itself should not distort the range.
For example, if a stock breaks out above a tight rectangle, the breakout candle may be much larger than the range. If the script included that candle in the box calculation, it would make the range look wider than it actually was.
This script avoids that issue by asking:
“Before the current breakout candle, was there a valid sideways range?”
That allows the indicator to draw the actual consolidation area more accurately.
Visual Guide
Visual ElementMeaningBlue dashed boxDetected standard rectangle rangePurple dashed boxDetected tight launch shelfUpper box lineRange resistance / breakout levelLower box lineRange support / invalidation referenceMidlineInternal range midpointBO markerBreakout above range with volumeBO? markerPrice breakout without volume confirmationFAIL markerBreakdown below rangeScore labelShows range quality, width, ADR, prior move, and containment
How I Use It in My Strategy
This indicator fits into a continuation-style trading strategy built around strength, structure, and timing.
The process is:
1. Find a stock with prior strength
I want to see that the stock has already proven demand.
That may include:
strong prior advance
relative strength versus the market
rising moving averages
reclaim or hold above the 200 SMA
improving volume profile
strong sector or theme participation
recent earnings, catalyst, or institutional attention
The indicator is not used to find random sideways stocks. It is used to find sideways ranges after strength has already appeared.
2. Let the stock build a range
Once a stock has moved, I want to see whether it can hold gains.
A clean range tells me:
buyers are defending higher prices
sellers are not fully taking control
price is digesting instead of collapsing
moving averages may be catching up
risk can be defined around the box
This is where the auto box becomes useful.
Instead of manually drawing every range, the indicator highlights areas where price is compressing or consolidating.
3. Use the box for trade planning
The box gives me three major trade locations:
Trade LocationUse CaseRange lowSupport-defense entryRange highBreakout triggerBreakout retestPreferred continuation entry
I generally do not want to enter randomly in the middle of the box unless I have another strong reason.
The best trades usually come from:
range-low defense,
breakout through range high,
or breakout followed by a retest that holds.
4. Confirm with other tools
This indicator identifies structure, but it is not a standalone buy signal.
Before taking a trade, I still want confirmation from:
relative strength
catalyst/news/earnings context
sector/theme strength
ADR/movement potential
volume expansion
VWAP/AVWAP location
volume profile levels
option-chain liquidity if using options
broader market regime
The box tells me where the trade may be forming.
The rest of the process tells me whether it deserves capital.
How Other Traders Can Use It
This indicator can be adapted to several trading styles.
Momentum Traders
Momentum traders can use it to identify stocks that are pausing after a strong move and preparing for another push.
Best use:
breakout above range high
breakout with volume
tight launch shelf breakouts
high-relative-volume names
strong sector/theme participation
Swing Traders
Swing traders can use it to locate multi-day or multi-week continuation bases.
Best use:
buy breakout/retest
enter near range support with defined risk
use the box low as invalidation
use the box height for measured-move targets
combine with daily/weekly trend structure
Breakout Traders
Breakout traders can use the box high as an objective breakout level.
Best use:
price closes above the range high
volume expands above average
range is not too wide
stock is above key moving averages
market regime supports continuation
Mean-Reversion Traders
Mean-reversion traders can use the range boundaries in the opposite way.
Best use:
fade weak breakouts back into the range
buy range low if buyers defend
sell/avoid failed range highs
use the midpoint as a decision level
Position Traders
Position traders can use detected boxes as add zones during a larger trend.
Best use:
add after a valid base forms above rising moving averages
trail risk below higher base lows
identify where trend continuation is being accepted
avoid adding after emotional vertical moves without digestion
Input Settings Explained
Standard Rectangle Bars
Controls how many prior candles are used to detect a normal consolidation box.
Higher values detect longer bases.
Lower values detect shorter ranges.
Suggested use:
StyleSettingFast momentum8–12Swing trading12–20Longer bases20–40
Tight Launch Shelf Bars
Controls how many prior candles are used to detect short, tight shelves near highs.
This is designed for stocks that pause briefly before breaking out.
Suggested use:
StyleSettingVery fast momentum4–6Normal launch shelf6–10Slower swing shelf10–15
Prior Move Lookback Bars
Determines how far back the script looks to measure whether the stock had a prior advance before the range.
Higher values allow the script to detect bases after larger, older moves.
Suggested use:
StyleSettingShort-term momentum20–35Swing continuation35–60Longer trend bases60–100
Minimum Prior Advance %
Defines how much price must have advanced before the range qualifies.
This helps prevent the script from highlighting random sideways chop.
Suggested use:
Market TypeSettingLarge caps8%–15%Mid caps15%–25%Small caps / high ADR20%–40%
A higher setting makes the script more selective.
Minimum Close Containment %
Controls how many closes must remain inside the box.
A higher value requires cleaner sideways behavior.
Suggested use:
Range QualitySettingLoose ranges60%–70%Normal ranges70%–80%Very tight clean bases80%–90%
Max Standard Range Width x ADR
Controls how wide a normal range can be compared with the stock’s average daily range.
Lower values require tighter bases.
Higher values allow wider, looser consolidations.
Suggested use:
PreferenceSettingTight clean bases only1.5–2.25Balanced2.5–3.0Loose momentum names3.0–4.0
Max Tight Shelf Width x ADR
Controls how wide a tight launch shelf can be.
Because launch shelves should be tighter than standard ranges, this number is usually lower.
Suggested use:
PreferenceSettingVery tight shelves1.0–1.3Balanced1.4–1.8Volatile small caps1.8–2.5
ADR Length
Controls the lookback period for average daily range.
Default is 20, which approximates one trading month.
Suggested use:
PurposeSettingShort-term sensitivity10Standard20Smoother ADR30–50
Volume Average Length
Controls the average volume lookback used for breakout and volume comparison.
Suggested use:
StyleSettingFast momentum10Standard swing20Smoother volume filter30–50
Max Range Volume vs Avg
This controls how much volume is allowed during the range if the volume filter is enabled.
Lower values require quieter consolidation.
Higher values allow more active ranges.
Suggested use:
Range TypeSettingQuiet base0.8–1.0Normal base1.0–1.25Active momentum range1.25–1.75
RSI Settings
RSI filters can be used to avoid ranges that are either too weak or too extended.
Suggested use:
PurposeSettingAvoid weak rangesMinimum RSI 40Allow momentum leadersMaximum RSI 80–85Stricter resetMax RSI 70–75
For strong momentum stocks, I prefer leaving RSI control flexible because strong names can remain elevated before breaking out.
Require Price Above 200 SMA
When enabled, the script only accepts ranges where price is above the 200 SMA.
This is useful for trend-following and continuation strategies.
Turn this off if you want to scan:
bottoming structures
early reversals
200 SMA reclaim attempts
accumulation ranges below the 200 SMA
Require Prior Advance
When enabled, the script requires price to have moved up before forming the range.
This is best for continuation traders.
Turn this off if you want to study:
accumulation bases
bottoming ranges
reversal setups
sideways structures before a first move
Require Volume Control
When enabled, the range must have controlled volume relative to average volume.
This helps filter out chaotic ranges.
However, for volatile small caps or active momentum names, I often leave this off because strong stocks can consolidate with active volume.
Require RSI Control
When enabled, RSI must remain within the selected range.
This can help avoid weak or overextended setups.
However, momentum leaders can remain strong for longer than expected, so this setting is optional depending on the strategy.
Setup Score
The label displays an Auto Range Score out of 10.
The score considers:
prior move
price above 200 SMA
containment inside the range
range width versus ADR
volume behavior
OBV behavior
RSI condition
ADR level
The score is not a buy signal. It is a structure-quality score.
General interpretation:
ScoreInterpretation9–10Very clean structure7–8Good watchlist candidate5–6Needs more confirmationBelow 5Low-quality or incomplete structure
Trading Notes
A detected box is only a location tool.
It does not replace:
market regime analysis
risk management
catalyst research
relative strength checks
liquidity checks
options-chain review
trade planning
The highest-quality setups usually combine:
strong prior move + clean box + range containment + volume expansion on breakout + supportive market conditions.
Risk Management
The box can help define risk.
Common invalidation methods:
stop below range low
stop below breakout candle low
stop below retest low
stop below rising 20 EMA or 50 SMA
exit if breakout fails back into range
avoid if price breaks below the box with volume
The cleanest setups are usually those where the box gives a tight, logical invalidation level.
Important Disclaimer
This indicator is for educational and research purposes only.
It does not provide financial advice, investment advice, or guaranteed trade signals. All trading involves risk. Traders should use their own research, risk management, and judgment before entering any position. Indikator

Indikator

Indikator
Indikator
Reverse AVWAP: Institutional Anchor DiscoveryStop guessing your anchors. Let the algorithm find them for you.
Most traders use the Anchored VWAP (AVWAP) the same way: they pick an obvious swing high, swing low, or earnings gap, anchor a line to it, and wait to see if price reacts. But what if we flipped the script? What if we took a significant current price level and mathematically scanned history to find exactly which hidden dates are defending it?
Introducing the Reverse AVWAP.
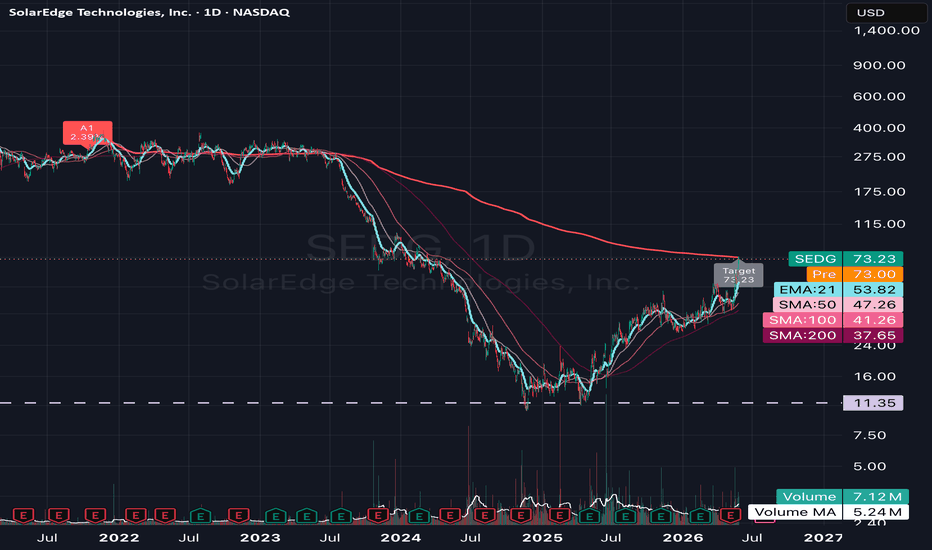
This indicator acts as an investigative tool for market structure and volume memory. By targeting a specific date or your current real-time chart bar, the script calculates backward, scanning thousands of bars to find the exact historical anchor points where an AVWAP drawn from them converges perfectly with your target price.
How It Works
Instead of projecting forward, this script reverse-engineers the volume profile:
Dynamic Target Selection: Choose to run the calculation from a fixed Target Date or toggle Use Last Chart Bar as Target to dynamically track live, real-time convergence on your current candle.
Historical Matrix Scan: The algorithm searches back in time, calculating the exact AVWAP from every single historical bar up to your target.
Threshold Matching: If a historical AVWAP lands within your custom proximity threshold (e.g., ±2.5% or ±3.5%) of the target price, it flags that date as a valid "Anchor."
Stitched Curve Generation: It draws the historical VWAP curves connecting those hidden anchors directly to your target.
Key Features
Macro First vs. Micro First Scanning: Choose your search direction. Macro First scans from the oldest historical data forward, prioritizing dominant multi-year structural pivots (like All-Time Highs or major cyclical bottoms). Micro First scans from recent data backward, focusing on short-term accumulation zones.
Smart Anti-Clustering: Includes a "Minimum Bars Between Anchors" filter. If the market forms a major rounded peak or flat consolidation, this prevents the script from grabbing 5 consecutive days on the same structure. It forces the algorithm to find distinct, uniquely significant pivot origins.
Up to 15 Historical Curves: Automatically color-codes and plots multiple unique historical AVWAP curves that converge on your target price.
Precision Divergence Labels: Drops clean visual tags on the discovered anchors, showing you exactly how close the historical AVWAP came to your target price down to the decimal percentage.
Under the Hood (Engine Optimizations)
Calculating thousands of historical AVWAPs iteratively would normally trigger a Pine Script timeout or cause massive lag. This indicator utilizes a heavily optimized architecture to bypass TradingView's native limitations:
O(1) Time Math: It uses rolling arrays to track the cumulative sums of Volume and Price × Volume. By subtracting cumulative historical values from current ones, it solves the AVWAP equations instantly in constant time per bar.
Bulletproof Line-Chain Renderer: TradingView’s standard polyline engine frequently suffers from canvas rendering drops when drawing long curves across thousands of bars. This script implements a custom, lightweight rendering engine that segments standard lines into roughly 80 dynamically downsampled links per anchor. The result is a buttery-smooth curve that never fails to render, no matter how far back the anchor sits.
Memory Management: Includes a dedicated garbage-collection routine that wipes and redraws canvas objects on live ticks, keeping your chart clean, responsive, and completely free of visual flickering.
Usage Tips
The History Loading Shortcut: Pine Script can only analyze data that is actively loaded into your browser session. If you are looking for a macro anchor from years ago, use the TradingView "Go to" shortcut (Alt + G on Windows, Option + G on Mac) and enter a past date. This forces the servers to load the historical bars instantly, allowing the script to find the anchor immediately.
Validation: If you see a breakout, run the Reverse AVWAP. If multiple historical volume anchors perfectly align with your current price, you have high-conviction proof of a major institutional volume node. You can then use those newly discovered anchor dates to project standard AVWAPs forward into the future. Indikator
Indikator

Indikator

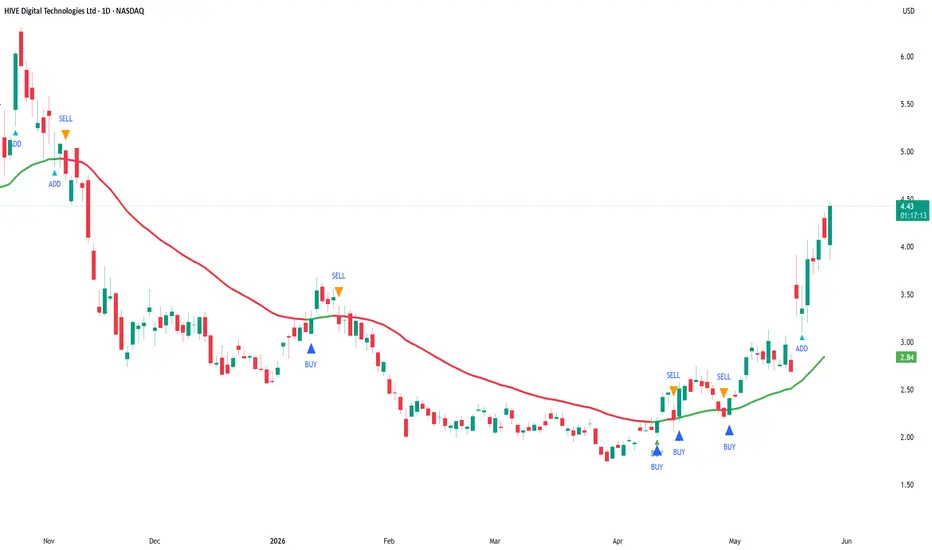
EMA 40 Pullback Pyramid StrategyEMA 40 Pullback Pyramid Strategy
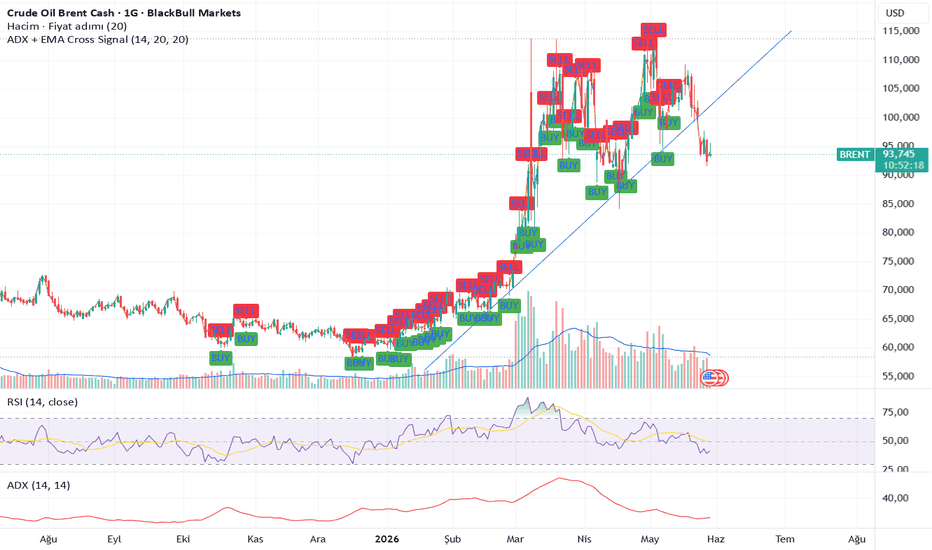
EMA 40 Pullback Pyramid Strategy is an educational trend-following strategy designed to study long-side entries around a rising 40-period Exponential Moving Average, with optional pullback re-entry logic, ADX trend-strength filtering, and EMA cross-based entry/exit conditions.
This is a strategy script, not a prediction tool and not financial advice. It is intended for research, backtesting, and forward-testing only. Historical results are hypothetical and can differ significantly from live trading due to slippage, commissions, liquidity, order execution, symbol behavior, timeframe selection, and market regime changes.
What the strategy does
The strategy uses the 40-period EMA as its main directional reference.
The EMA color changes according to its slope:
- Green EMA: the EMA is rising.
- Red EMA: the EMA is falling.
- Gray EMA: the EMA is flat or unchanged.
The strategy can enter long positions when selected bullish conditions occur and can close positions when selected bearish or exit conditions occur.
Core logic
1. EMA 40 trend direction
The strategy calculates a fast EMA using the selected EMA length. The default value is 40.
A bullish trend condition exists when the EMA is rising. A bearish condition exists when the EMA is falling.
The original base entry occurs when the EMA changes from not rising to rising, and ADX is above the selected minimum threshold.
2. ADX trend-strength filter
The strategy uses DMI / ADX to filter weak trend conditions.
A trade can qualify only when ADX is above the selected ADX threshold. The default threshold is 20.
This filter is intended to reduce entries during weak or sideways market conditions, but it does not eliminate false signals.
3. Pullback re-entry logic
When enabled, the pullback module looks for price to retrace toward the EMA by a selected ATR-based distance and then recover above the EMA.
The pullback condition uses:
- ATR length.
- Pullback distance multiplied by ATR.
- Recovery candle logic, where the candle closes above the EMA and closes above its open.
This feature is designed to study additional entries during an existing upward EMA trend. Because pyramiding is enabled, these pullback signals can add to an existing long position depending on the strategy settings.
4. EMA 40 cross signals
The strategy includes optional EMA cross buy/sell logic.
The cross detection mode can be:
- Close mode: uses close crossing above or below the EMA.
- Wick mode: uses wick interaction with the EMA followed by a close on the opposite side.
When “Use EMA cross signals in strategy orders” is enabled, these signals can participate in actual strategy entries and exits. When disabled, they can be used only as visual reference signals.
5. Minimum bars between entries
The strategy includes a minimum-bars-between-entries setting. This helps reduce immediate repeated entries and gives users control over signal spacing.
6. Pyramiding
The strategy uses pyramiding to allow multiple long entries when qualifying conditions appear. This is mainly intended to study whether adding into a trend after pullbacks improves or worsens the tested behavior.
Users should review this setting carefully. Pyramiding increases exposure and can materially increase both potential returns and potential drawdowns.
Default strategy properties
The script uses the following default strategy properties:
- Initial capital: 1,000
- Position sizing: percent of equity
- Default order size: 33% of equity
- Pyramiding: 3
- Commission: 0.1%
- Slippage: defined in the strategy settings
- Bar magnifier: disabled
- Calculate on every tick: disabled
- Process orders on close: disabled
These settings are included for testing purposes only. They may not be suitable for every market, timeframe, or trader. Users should adjust position sizing, commission, slippage, pyramiding, and test date range to reflect realistic conditions for the instrument being tested.
Important backtesting note
TradingView strategy results are simulations based on historical bar data. They are not live trading results.
Backtest results can change significantly depending on:
- Symbol
- Timeframe
- Date range
- Commission
- Slippage
- Liquidity
- Spread
- EMA length
- ADX threshold
- ATR length
- Pullback multiplier
- Minimum bars between entries
- EMA cross mode
- Whether EMA cross signals are used for orders
- Pyramiding setting
- Market regime
Users should test the strategy on a sufficiently large sample of trades and across different market conditions before drawing conclusions. A small number of trades is not enough to evaluate a strategy reliably.
How to use it
A practical workflow is:
1. Select the symbol and timeframe to test.
2. Use a realistic date range that includes different market conditions.
3. Review whether the strategy produces a sufficient number of trades.
4. Adjust commission and slippage to match the market being tested.
5. Review the impact of position size and pyramiding on drawdown.
6. Compare results with and without pullback re-entry.
7. Compare results with and without EMA cross signals being used for strategy orders.
8. Forward-test before considering any real-world use.
Inputs
Date Range
- Start Date: first date included in the test.
- End Date: last date included in the test.
Moving Average
- Fast EMA Length: controls the EMA used for trend direction, pullbacks, and cross signals.
DMI / ADX
- DI Length: DMI calculation period.
- ADX Smoothing: smoothing period for ADX.
- ADX minimum to trade: minimum ADX value required for qualifying trend entries.
Pullback Re-entry
- Enable pullback re-entry: enables or disables ATR-based pullback entries.
- Pullback distance × ATR: controls how close price must pull back toward the EMA.
- ATR Length: ATR period used for pullback distance.
Signal Control
- Minimum bars between entries: controls spacing between entries.
EMA 40 Cross Signals
- Use EMA 40 cross buy/sell signals: enables visual EMA cross signals.
- EMA cross detection mode: chooses Close mode or Wick mode.
- Use EMA cross signals in strategy orders: determines whether EMA cross signals affect actual strategy orders.
Visual elements
The script plots:
- The EMA line, colored by slope.
- Base entry markers.
- Pullback add-entry markers.
- Optional EMA cross buy/sell markers.
- Hidden ADX and ADX threshold plots available for reference.
Limitations
This strategy is long-side focused and does not create independent short positions.
The strategy can underperform during sideways or choppy market conditions, even with the ADX filter.
EMA-based systems are inherently lagging because moving averages react to prior price data.
ADX can confirm trend strength but does not determine trade direction by itself.
Pullback and pyramiding logic can increase exposure and may increase drawdown.
No strategy setting can guarantee profitability or future performance.
Recommended use
This strategy is best used as an educational framework for testing EMA trend continuation, ATR-based pullback re-entry, ADX trend-strength filtering, and pyramiding behavior.
It should be used with realistic backtesting assumptions, conservative risk controls, and additional independent analysis before any trading decision. Strategie

Dual MA Gradient [Gabremoku]Dual MA Gradient is a clean dual moving average overlay designed to highlight not only MA direction and crossover, but also the degree of separation between the two averages through a dynamic gradient ribbon.
The script uses two configurable moving averages and transforms their relationship into a visual ribbon that reacts to:
bullish alignment
bearish alignment
neutral compression
Instead of relying only on a simple crossover, the indicator helps show whether the two averages are:
crossing,
compressing,
or expanding apart
That makes it useful as a compact trend-structure tool for traders who want an at-a-glance read on direction and relative momentum.
What it shows
📈 Two configurable moving averages — each MA can be set independently using:
EMA or SMA
custom length
custom source
🌈 Directional gradient ribbon — the space between the two averages is divided into layered fills that create a smooth visual ribbon.
🟦 Bullish separation — when the fast MA is above the slow MA, the ribbon shifts to bullish color.
🟨 Bearish separation — when the fast MA is below the slow MA, the ribbon shifts to bearish color.
⚪ Compression state — when the spread between the two MAs becomes small enough, the ribbon fades into a neutral state to signal contraction.
🏷️ Status label — optional live label shows the active state:
Compression
Bullish Separation
Bearish Separation
⭕ Cross markers — optional markers can be shown when bullish or bearish MA crosses occur.
Core logic
The indicator is built around three simple but useful ideas:
Which MA is on top
How far apart the two MAs are
Whether the spread is strong enough to be directional or too tight and neutral
A moving average crossover occurs when a shorter-period average crosses a longer-period average, and it is commonly used to identify trend shifts or signal changes in directional bias.
This script goes a step further by emphasizing the spread between the averages. That matters because ribbon spacing is often used as a visual clue for trend structure: when averages are compressed, the market may be in transition or contraction, while a wider directional ribbon can reflect stronger alignment.
How to read it
A practical reading method is:
Compression = the two averages are close together, market may be transitioning or losing directional clarity
Bullish separation = the fast MA is above the slow MA and the ribbon is opening upward
Bearish separation = the fast MA is below the slow MA and the ribbon is opening downward
In many moving-average frameworks:
the cross helps identify the directional shift
the spacing helps evaluate whether that shift is weak or established
a tight ribbon often suggests indecision or a developing transition
Features
✅ Dual moving average framework
✅ SMA or EMA selection for both lines
✅ Fully customizable lengths
✅ Dynamic layered ribbon between MAs
✅ Bullish / bearish / neutral compression states
✅ Optional MA line display
✅ Optional live status label
✅ Optional crossover markers
✅ Built-in bullish and bearish crossover alerts
Notes
This indicator is designed as a trend-visualization tool rather than a complete standalone strategy. Like all moving-average systems, it is inherently lagging, so it is generally more useful for confirming structure and directional bias than for predicting reversals in isolation.
Author: Gabremoku
Pine Script v6 Indikator

Compass | AnonycryptousCompass | Anonycryptous
Description & user manual
Credits
The weekly psychological level calculation in this indicator is based on open-source code originally published on TradingView. The original script was created by plasmapug. Continued development was done by infernixx, Peshocore, and xtech5192 in collaboration with TradersReality. Significant modifications have been made to integrate this component into the Compass framework.
Why this indicator is different
Most indicators answer one question. A moving average tells you the trend direction. An oscillator tells you momentum. A session box tells you the time. A volume indicator tells you participation. Each one is useful. None of them tells you where you are.
Before placing a trade, a trader needs to answer several questions simultaneously. What session is active and what does that mean for the type of price action to expect? Where does the macro trend stand? Is volume confirming the move or contradicting it? Are there open imbalances nearby that price may return to? How much of the day's expected range has already been consumed? Where are the key structural levels — pivots, the daily open, prior week references?
Answering each of these questions separately requires stacking tool after tool until the chart becomes unreadable. Compass answers all of them at once.
It is not a signal indicator. It does not fire arrows or tell you when to buy or sell. What it does is something more fundamental: it gives you a complete read of the market environment before any decision is made. Sessions, trend, volume, imbalances, range levels, pivots, psychological references — all in one overlay, all configurable, all on one chart.
The design philosophy is orientation first. Decision second. Compass tells you where you are. What you do with that is your responsibility.
Important notice
Compass does not generate trading signals.
It does not tell you when to buy or sell.
It does not predict market direction.
It does not replace your trading strategy or your own analysis.
All illustrative examples in this manual are for educational purposes only and are not trading recommendations.
All trading decisions remain entirely with the user.
Always apply your own judgment and manage your own risk.
1. Overview
Compass is a comprehensive market context indicator that combines eleven independent analysis frameworks into one unified overlay. Every component is individually toggleable. Six presets are included for different trading styles, from fast scalping to full multi-component analysis.
What it includes:
- Five-EMA suite with adaptive cloud around the EMA 50
- EMA crossover system with configurable signals and candle coloring
- Stochastic RSI background alerts with four alert types and RSI divergence detection
- PVSRA volume vector candle analysis with zone tracking and configurable thresholds
- Eight global market sessions with automatic DST awareness
- Average daily, weekly, and monthly range levels with 50% midpoints
- Classic pivot points with mid-point levels
- Daily open reference line with historical opens
- Fair value gap detection with partial absorption tracking
- Weekly psychological level tracking
- Live dashboard with eighteen data points across all active components
2. EMA suite
Five exponential moving averages are plotted simultaneously: EMA 5, EMA 13, EMA 50, EMA 200, and EMA 800. Together they cover short-term momentum, medium-term trend direction, macro trend, and long-term structural bias.
The EMA 50 is wrapped in a dynamic cloud calculated from two standard deviations of price. The cloud expands during volatility and contracts during consolidation. A widening cloud indicates active price discovery. A thinning cloud indicates equilibrium or compression before a directional move.
The EMA 200 is the primary macro bias filter. Price above it defines a broadly bullish environment. Price below it defines a broadly bearish environment. This is shown in the dashboard at all times.
The EMA 800 provides long-term structural context, particularly useful on mid to higher timeframes where it marks the gravitational center of multi-month price structure.
All five EMA lengths are configurable. Each has individual color and transparency controls. An EMA label option displays the current value at the right edge of each line.
3. EMA cross system
The EMA cross tracks a configurable fast EMA crossing a configurable slow EMA and marks the crossover bar. All candles after a cross continue in the direction of that cross until the opposite cross fires.
Three display modes are available: show both the fast and slow EMA lines, show a single consolidated EMA line, or hide the EMA lines entirely while keeping the crossover signals visible.
This component is a trend state indicator, not a trade trigger. A bull cross does not mean buy. It means the short-term trend has shifted upward relative to the medium-term average.
Signals and candle coloring can be toggled independently.
4. Stochastic RSI
The stochastic RSI component runs a standard stochastic RSI calculation and generates background color alerts based on crossover conditions at configurable band levels.
Four alert types are available, each independently toggleable:
Middle band crossover — K line crosses D line near the 50 level. Indicates a possible trend shift in momentum.
Overbought/oversold crossover — K line crosses D line from overbought or oversold territory. Indicates a potential reversal from an extreme.
Entering overbought — K line crosses above the upper band. Indicates that momentum has moved into overbought territory.
Entering oversold — K line crosses below the lower band. Indicates that momentum has moved into oversold territory.
The dashboard displays the current stochastic RSI state and the RSI value. RSI appears in green when above the midline and in red when below. Regular bullish and bearish divergence is detected automatically and shown in the dashboard as a directional label. When divergence is active, a thin reference line appears on the price chart marking the divergence candles.
5. PVSRA volume vector analysis
PVSRA analysis colors candles based on volume relative to the 10-bar average and the relationship between volume and candle spread.
Four vector types:
Green vector — bullish bar where volume is at or above the green/red threshold (default 200% of the 10-bar average), or where volume multiplied by spread is the highest of the last 10 bars. Indicates strong bullish institutional participation.
Red vector — same conditions on a bearish bar. Indicates strong bearish institutional participation.
Blue vector — bullish bar where volume is at or above the blue/violet threshold (default 150% of average). Indicates elevated bullish volume below the institutional threshold.
Violet vector — same conditions on a bearish bar. Indicates elevated bearish volume.
Grey — no vector conditions met. Normal volume.
Both thresholds are configurable directly from the settings panel. Blue and violet signals are strictly exclusive from green and red — a bar cannot qualify for both simultaneously.
Vector candle zones draw boxes at each vector candle location and remain active until price moves through the zone, marking areas where elevated institutional activity was detected at the time the candle formed.
The PVSRA override input allows a different symbol to be used for the volume calculation. This is useful when the charted instrument has unreliable volume data, such as CFDs, perpetual swaps, or instruments where the primary volume is on a related market.
6. Market sessions
Eight global trading sessions are tracked simultaneously, each with automatic DST awareness. Sessions are displayed as expanding boxes with high and low lines and a real-time label showing the session open.
Sessions included:
- London: 08:00–16:30 UTC
- New York: 14:30–21:00 UTC
- Tokyo: 00:00–06:00 UTC
- Hong Kong: 01:30–08:00 UTC
- Sydney: 22:00–06:00 UTC
- EU brinks: 08:00–09:00 UTC
- US brinks: 14:00–15:00 UTC
- Frankfurt: 07:00–16:30 UTC
DST is handled automatically for London, New York, and Sydney. No manual adjustment is needed. Each session can be toggled individually, and box color, transparency, and label color are fully configurable per session.
Session context matters because market behavior differs significantly depending on which participants are active. London and New York overlap produces the highest volume and fastest price movement. Tokyo and Sydney sessions tend to consolidate. The brinks windows mark the transition periods where session highs and lows often form.
7. Range levels
Three statistical range frameworks measure the expected price range for the current period based on historical averages.
Average daily range (ADR) — the expected high and low for the current trading day. When price reaches the ADR level, the day's expected range has been consumed. Moves beyond the ADR are extension moves that occur with lower statistical probability and often mean-revert. The dashboard shows ADR % used — how much of today's expected range has already been consumed. Above 80% indicates the day is approaching its expected limit.
Average weekly range (AWR) — the same concept applied to the current week. Useful for assessing how much room the week has left to move.
Average monthly range (AMR) — the same concept applied to the current month. Provides macro context for position sizing and target expectations.
Each framework includes a 50% midpoint level marking the center of the expected range. The ADR measure from daily open option calculates the range starting from that day's open price rather than the statistical high, making the levels static for the entire day.
All three frameworks have individual lookback period inputs, color controls, line styles, and label toggles.
8. Pivot points
Classic pivot points are calculated from the prior day's high, low, and close. Levels include PP, R1/S1, R2/S2, R3/S3, and M mid-point levels between each major level.
Pivot points provide structural reference for the current session. Price above PP defines a broadly bullish day structure. R levels act as potential resistance targets. S levels act as potential support targets. M levels provide intermediate precision references between major pivots.
All levels can be toggled individually. Lines extend rightward from the prior session and can optionally extend in both directions. Each level has individual color and line style controls.
9. Daily open
A horizontal line marks the current day's opening price. This is one of the most referenced structural levels among short-term traders because it defines the starting point for the day's price discovery.
Price above the daily open reflects a bullish session bias. Price below reflects a bearish session bias. When price oscillates around the daily open without committing direction, the session is in balance — a lower probability environment for trend trades.
Historical daily opens can optionally be shown as reference for prior day context.
10. Fair value gaps
A fair value gap is a three-bar imbalance where price moved through a range without leaving two-sided trade — the low of the upper candle is above the high of the lower candle (bullish gap) or vice versa (bearish gap). These areas represent unfinished business where the market may return to achieve balance.
Gaps are filtered by a minimum width threshold expressed as a multiple of ATR. Gaps narrower than the threshold are excluded. Partial absorption is tracked — as price returns into the gap, the fill color changes to show how much of the imbalance has been recovered.
Fully mitigated gaps can be kept on the chart as historical reference or deleted automatically to maintain a clean view.
11. Psychological levels
Weekly psychological levels mark the prior week's high and low as calculated by a specific session-anchored method. These levels represent deliberate structural references where participants have previously committed size — breakouts and rejections around these levels tend to be more intentional than random price noise.
Three GMT offset options accommodate the session anchor calculation for different global market structures. Two mode options are available: crypto (weekly reset on Saturday Sydney open) and forex (weekly reset on Monday Tokyo open).
12. Settings reference
Preset
- Custom: full manual control over all settings.
- Clean scalper: sessions, EMA suite, FVG, subtle candle coloring. Low noise.
- Full context: everything on, medium transparency. Best for analysis.
- Signal focus: EMA cross, stoch RSI background, PVSRA bar color prominent. Rest subtle.
- Minimal: sessions, daily open, ADR only. No signals.
- PVSRA pro: PVSRA and vector candle zones central. EMA 200 and 800 only.
Global settings
- Master opacity offset (custom preset only): shifts all transparency values simultaneously.
- Show bull/bear label text: shows or hides text on EMA cross signal triangles.
EMA suite
- Show EMA suite and labels
- Individual EMA color and transparency controls
- EMA cloud fill and border transparency
- EMA line width
EMA cross
- Show EMA cross signals
- Fast EMA, slow EMA, and consolidated EMA lengths
- Show both EMAs or consolidated only
- Bull, bear, and neutral colors and transparency
- Cross EMA line width
Stochastic RSI
- Show stochastic RSI background alerts
- RSI length and stochastic length
- Overbought and oversold band levels
- Individual alert type toggles (four types)
- Alert colors and transparency
- RSI divergence lookback period
- Divergence line color and width
PVSRA
- Vector colors (red, green, violet, blue, regular up/down)
- Green/red threshold (× average volume, default 2.0)
- Blue/violet threshold (× average volume, default 1.5)
- Include spread filter for green/red classification
- Override symbol toggle and input
- Show vector candle zones with transparency and width settings
Candle coloring
- Enable candle coloring
- Coloring mode: EMA cross / PVSRA / EMA 200 / off
- Bull and bear candle color and transparency
Market sessions
- Show market sessions
- Session timezone
- Show sessions on weekends
- Session high/low line style and width
- Per session: toggle, box color, transparency, label color
Range levels
- Show ADR, AWR, AMR (individual toggles)
- Lookback periods for each
- Show 50% midpoint levels
- Measure from daily open (ADR only)
- Color, transparency, line width, line style, labels
Pivot points
- Show PP, R1/S1, R2/S2, R3/S3, M levels individually
- Show labels
- Extend lines both directions
- Individual level colors and line styles
- Pivot line width
Daily open
- Show daily open
- Show label
- Show historical daily opens
- Color, transparency, line width
Fair value gaps
- Show fair value gaps
- Width filter (ATR multiplier)
- Extend to current bar
- Bullish and bearish FVG colors
- Mitigation fill colors
- Keep historical FVGs after mitigation
Psychological levels
- Show psy levels and labels
- Show historical psy levels
- GMT offset (GMT+1, GMT+2, GMT+3)
- Psy type: crypto or forex
- High and low colors and transparency
Dashboard
- Show dashboard
- Position: top left, top right, bottom left, bottom right
- Size: tiny, small, normal
13. Dashboard reference
The dashboard provides eighteen live data points across all active components:
Session — the currently active market session.
EMA cross — current EMA cross direction: bull or bear.
EMA 200 — whether price is above or below the EMA 200.
Stoch RSI — current stochastic RSI condition.
RSI — current RSI value, colored green above midline and red below.
RSI divergence — active bullish or bearish divergence, or none.
PVSRA — current candle vector type.
ADR % used — how much of today's expected daily range has been consumed.
FVG active — count of open unmitigated fair value gaps and mitigation percentage.
Psy level — whether price is above or below the prior week's psychological level.
Timezone — active session timezone setting.
VCZ active — count of active vector candle zones above and below current price.
Pivot PP — current pivot point value.
Daily open — current daily open price and direction.
14. How to use
14.1 Initial setup
Select a preset that matches your primary trading style. Adjust the session timezone to match your location or your primary exchange. If you trade an instrument with unreliable volume data, enable the PVSRA override and set it to a correlated liquid instrument. Set the ADR lookback period to your preference — 14 days is a standard starting point. For FVGs, set the width filter to 0.5 or higher to exclude minor gaps.
14.2 Reading the dashboard
The dashboard is the fastest way to orient yourself on a new chart or a new session. Check session, EMA cross direction, EMA 200 position, stoch RSI state, and ADR consumed before anything else. Five seconds to a full picture of where the market stands.
14.3 Reading the chart
Check EMA alignment. When EMA 13, EMA 50, and EMA 200 are stacked in the same direction, the trend is more significant than a single crossover. Divergence between them reflects a transition or competing timeframe pressures.
Check ADR percentage. Below 50% means the day has statistical room to move. Above 80% means the day is near its expected limit and extension moves are less probable.
Look for open FVGs near current price. An unmitigated FVG in the direction of the prevailing trend is a precision reference area where price has historically returned.
Check the psy level. If price is approaching the prior week's high or low, be aware that participant behavior around those references tends to be deliberate.
14.4 Timeframe guide
1 minute to 3 minutes — clean scalper preset, candle coloring set to EMA cross.
5 minutes to 15 minutes — clean scalper or signal focus preset.
30 minutes to 1 hour — full context preset, use ADR and pivot points.
4 hours to daily — full context or minimal preset.
14.5 Tips
PVSRA override — use when your broker's volume data is unreliable, when you trade a CFD or derivative with synthetic volume, or when you want spot market volume for a futures chart.
Master opacity offset — adding 10 to 20 increases overall transparency and dims the chart if it feels cluttered. Subtracting 10 to 20 makes all elements more prominent. This shifts all transparency values simultaneously without changing individual settings. Only active in custom preset.
Not every component needs to be active at once. Most traders will find three to four components provide the context they need for their specific setup.
15. Disclaimer
This indicator is provided for educational and informational purposes only.
Nothing in this document constitutes financial advice or any form of trading recommendation.
Trading financial instruments involves substantial risk of loss.
Past performance is not indicative of future results.
You may lose all of your invested capital.
All trading decisions are made entirely by the user.
Use at your own discretion.
Indikator

Indikator

27.05.2026***
Before presenting this project, I would like to express my sincere gratitude to all the developers, traders, coders, researchers, and members of the TradingView community whose ideas, indicators, concepts, and open-source contributions helped inspire this work.
Modern technical analysis is built upon decades of shared knowledge.
Every moving average, volatility model, market structure concept, liquidity theory, trend engine, and smart-money framework exists because countless traders decided to share their discoveries with others.
This indicator is not the product of a single isolated idea.
It is the result of studying, combining, refining, and evolving many approaches developed by talented authors across the trading community.
Special appreciation goes to the creators and researchers behind:
* Supertrend algorithms
* ATR-based volatility systems
* Supply & Demand methodologies
* Fair Value Gap concepts
* Smart Money Concepts (SMC)
* Volume analytics
* Multi-timeframe trend models
* Session-based trading frameworks
* Institutional liquidity mapping techniques
Open-source collaboration is one of the greatest strengths of the TradingView ecosystem.
The willingness of traders to publish ideas, share code, test concepts, and improve each other’s work continues to push technical analysis forward.
This project was created with respect for that spirit of collaboration.
Thank you to everyone whose work, directly or indirectly, contributed to the development of this indicator.
***
# 3ST NR — Advanced Non-Repainting Market Structure & Trend Engine
The **3ST NR** indicator is a complete institutional-style trading framework built around a triple Supertrend architecture, market condition analysis, ranked supply & demand zones, liquidity imbalance detection, multi-timeframe EMA mapping, and session-aware filtering.
Designed for traders who want more than simple buy/sell signals, this system transforms raw price action into a fully contextual trading environment.
---
## Core Concept
At the heart of the indicator are **three independent Supertrend engines** with different ATR sensitivities:
* Fast Supertrend → short-term momentum
* Mid Supertrend → directional confirmation
* Slow Supertrend → macro trend structure
A bullish state appears when the fast and mid Supertrends align upward.
A bearish state appears when both align downward.
Unlike many retail indicators, the script uses:
* confirmed candles only
* `barstate.isconfirmed`
* no future-looking calculations
* non-repainting logic
This creates stable and reliable market structure signals.
---
# Market Intelligence Engine
The script does not blindly trade every signal.
Instead, it evaluates the quality of the environment using a dynamic market engine:
## Trend Detection
Trend strength is calculated using:
* ATR volatility
* distance from EMA 21
* normalized momentum
The market is automatically classified into:
* **TREND**
* **MIX**
* **CHOP**
This allows traders to avoid low-quality ranging conditions.
---
# Volume Classification Engine
Volume is analyzed relative to a 20-period moving average.
The system categorizes activity into:
* LOW
* NORMAL
* HIGH
* SPIKE
This creates optional institutional participation filters, helping traders focus only on moments where real liquidity enters the market.
---
# Smart Session Engine
The indicator is fully session-aware.
It recognizes:
* New York Session
* London Session
* Asia Session
* US Pre-Market
Optional filters allow trading only during the highest-liquidity market windows.
This is especially powerful for:
* index futures
* NASDAQ
* forex
* scalping environments
---
# Multi-Layer EMA Structure
The script overlays multiple EMA systems simultaneously:
## Intraday EMAs
* EMA 9
* EMA 20
* EMA 62
* EMA 200
## Higher Timeframe Daily EMAs
* Daily EMA 3
* Daily EMA 9
* Daily EMA 20
* Daily EMA 50
* Daily EMA 100
* Daily EMA 200
This creates a complete multi-timeframe trend map directly on lower timeframes.
The higher timeframe EMAs act as:
* institutional support/resistance
* trend magnets
* reversal zones
* momentum confirmation layers
---
# Dynamic Daily Levels
The indicator automatically plots:
* Daily Open
* High of Day (HOD)
* Low of Day (LOD)
These levels dynamically update throughout the session and extend across the chart.
They serve as:
* liquidity references
* intraday breakout zones
* mean reversion levels
* trend continuation triggers
---
# Ranked Supply & Demand System
One of the most advanced parts of the script is the adaptive supply & demand engine.
The indicator:
* detects swing pivots
* builds dynamic zones
* ranks them using a proprietary scoring system
* continuously updates strength based on:
* mitigation
* volume
* trend alignment
* touch count
* age
* volatility
Zones are automatically classified as:
* strong support
* weak support
* strong resistance
* weak resistance
* mitigated zones
* broken zones
Each zone includes:
* visual strength bars
* bullish/bearish dominance percentages
* mitigation tracking
* automatic cleanup logic
The system behaves similarly to institutional order-flow mapping.
---
# Fair Value Gap Detection (FVG)
The script also detects non-repainting Fair Value Gaps.
Bullish and bearish imbalances are automatically drawn when inefficient price delivery occurs between candles.
These zones help traders identify:
* liquidity voids
* inefficiencies
* continuation structures
* smart-money displacement
---
# Intelligent Dashboard
A built-in real-time dashboard displays:
* current market condition
* volume state
* active session
* trend strength
* bullish/bearish status
This creates a compact decision-making center directly on the chart.
---
# Non-Repainting Philosophy
The entire system is designed around signal stability.
Key anti-repaint mechanisms include:
* confirmed candle validation
* no future bar references
* `lookahead_off`
* closed-bar signal confirmation
* structural pivot validation
This makes the indicator suitable for:
* live trading
* alerts
* automation
* strategy development
* discretionary execution
---
# Best Use Cases
The indicator performs exceptionally well in:
* NASDAQ scalping
* index futures
* forex intraday trading
* momentum trading
* session breakout strategies
* smart money concepts
* trend continuation systems
Especially effective on:
* 1-minute
* 3-minute
* 5-minute
* 15-minute charts
---
# Key Features Summary
* Triple non-repainting Supertrend engine
* Adaptive market state detection
* Volume intelligence filters
* Session-based filtering
* Multi-timeframe EMA structure
* Dynamic Daily Open / HOD / LOD
* Ranked Supply & Demand zones
* Zone strength scoring system
* Mitigation tracking
* Broken structure detection
* Fair Value Gap engine
* Real-time dashboard
* Institutional-style market mapping
---
# Final Philosophy
3ST NR is not just another indicator.
It is a complete market structure framework combining:
* trend analysis
* liquidity mapping
* volatility analysis
* volume confirmation
* institutional zones
* session timing
* smart-money concepts
The goal is simple:
Filter noise.
Visualize structure.
Trade with context.
Indikator