Strategie

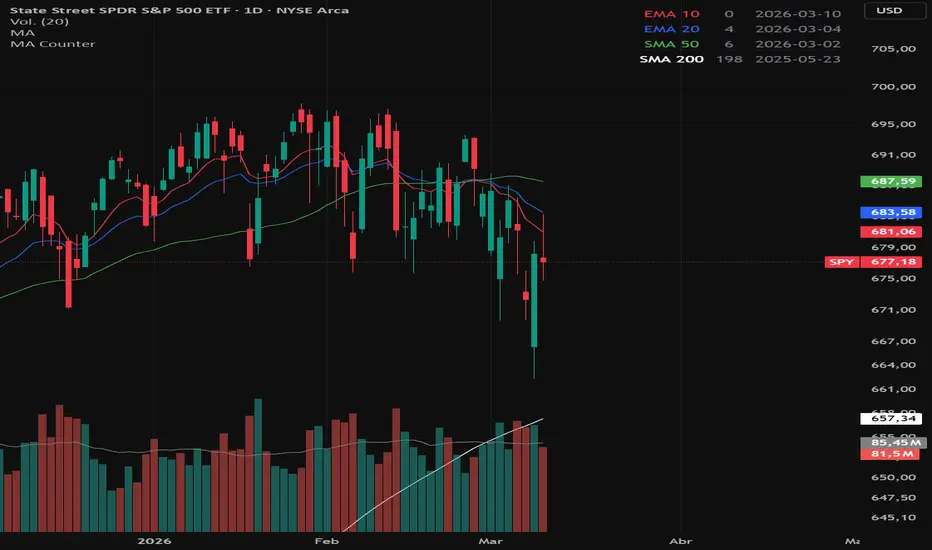
160-Min Extended Hours MAs160-Min Extended Hours MA Dashboard
Designed for traders who work across the full extended hours session, where 960 minutes of daily market time — from pre-market open at 4:00 AM ET through post-market close at 8:00 PM ET — divides evenly into exactly 6 bars per day at the 160-minute timeframe. This creates a clean, session-aligned bar structure that keeps moving average lookbacks anchored to real extended hours time rather than arbitrary period counts.
This indicator plots five moving averages, each mapped to a meaningful horizon expressed in session time:
1D — 6 bars (1 full extended session)
1W — 30 bars (1 trading week)
1M — 126 bars (~1 trading month)
6M — 756 bars (~6 trading months)
1Y — 1,512 bars (~1 trading year)
Features
Toggle between EMA and SMA globally with a single input. Each MA plots with a right-edge label showing the period name, distance from current price, percentage distance, and ATR multiple — giving you immediate context on how extended or compressed price is relative to each level. A summary table displays the current MA value and slope direction (▲ ▼ →) for each period. A bottom signal row indicates whether price is in a full bull stack, bear stack, or mixed alignment across all visible MAs.
Color palette runs teal → light blue → royal blue → purple → white from shortest to longest timeframe, consistent with the broader dashboard suite.
The indicator includes a timeframe guard — all plots and labels suppress automatically if the chart is not on the 160-minute timeframe, and a warning label fires to prompt you to switch. Note that the 1Y MA requires approximately one full year of chart history to populate.
Timeframe: 160-min only
Asset class: Equities, ETFs, and index products with extended hours trading (4:00 AM – 8:00 PM ET)
Pine Script: v6
Sonnet 4.6 Indikator

5-Min Session MAsHere's the updated description:
---
**5-Min Session MA Dashboard**
Designed for intraday traders working on the 5-minute timeframe, where 390 minutes of regular trading hours divides into exactly 78 bars per day — keeping moving average lookbacks anchored to real session time rather than arbitrary period counts.
This indicator plots three moving averages, each mapped to a meaningful intraday horizon expressed in session time:
- 1D — 78 bars (1 full session)
- 2D — 156 bars (2 sessions)
- 1W — 390 bars (1 trading week)
**Features**
Toggle between EMA and SMA globally with a single input. Each MA plots with a right-edge label showing the period name, distance from current price, percentage distance, and ATR multiple — giving you immediate context on how extended or compressed price is relative to each level. A summary table displays the current MA value and slope direction (▲ ▼ →) for each period. A bottom signal row indicates whether price is in a full bull stack, bear stack, or mixed alignment across all visible MAs.
Color palette runs teal → blue → purple from shortest to longest timeframe, consistent with the broader dashboard suite.
The indicator includes a timeframe guard — all plots and labels suppress automatically if the chart is not on the 5-minute timeframe, and a warning label fires to prompt you to switch.
**Timeframe:** 5-min only
**Asset class:** Equities, ETFs, and index products trading regular hours (9:30–4:00 ET)
**Pine Script:** v6
--- Indikator

138-Min Session MAs138-Min Session MA Dashboard
Designed for futures traders using the 138-minute timeframe, where 1,380 minutes of daily session time divides evenly into exactly 10 bars per day — creating a clean, session-aligned bar structure unique to this timeframe.
This indicator plots six moving averages, each mapped to a meaningful trading horizon expressed in session-time rather than calendar time:
1D — 10 bars (1 session)
2D — 20 bars (2 sessions)
1W — 50 bars (1 trading week)
2W — 100 bars (2 trading weeks)
1M — 210 bars (~1 trading month)
6M — 1,260 bars (~6 trading months)
Features
Toggle between EMA and SMA globally with a single input. Each MA plots with a right-edge label showing the period name, distance from current price, percentage distance, and ATR multiple — giving you immediate context on how extended or compressed price is relative to each level. A summary table displays the current MA value and slope direction (▲ ▼ →) for each period. A bottom signal row indicates whether price is in a full bull stack, bear stack, or mixed alignment across all visible MAs.
Color palette runs teal → blue → purple → white from shortest to longest timeframe, consistent with the broader dashboard suite.
The indicator includes a timeframe guard — all plots and labels suppress automatically if the chart is not on the 138-minute timeframe, and a warning label fires to prompt you to switch.
Timeframe: 138-min only
Asset class: Futures (ES, NQ, CL, GC, or any instrument with a 1,380-min session)
Pine Script: v6 Indikator

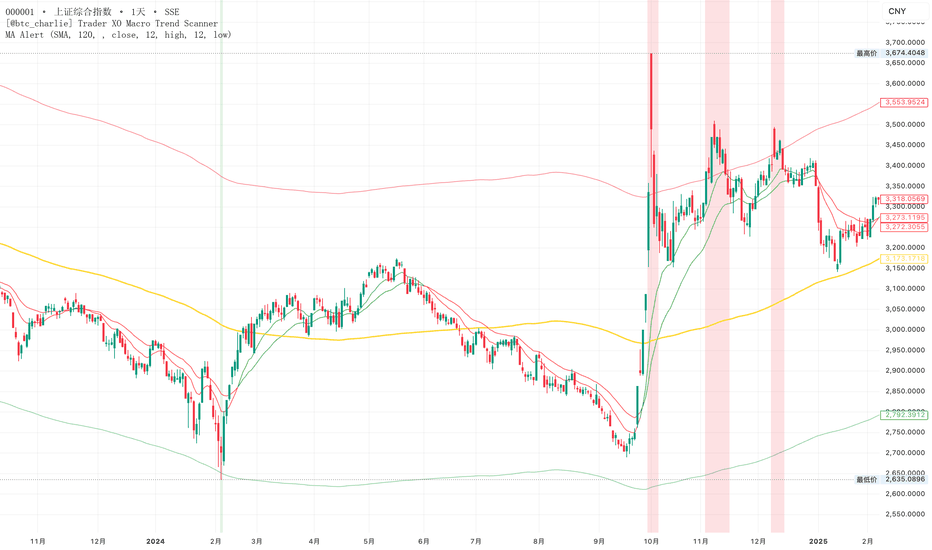
MA Distance Alert# MA Distance Alert - 均线偏离警报指标
## 中文说明
### 指标简介
MA Distance Alert 是一款基于均线原理的价格偏离监控指标,支持SMA/EMA双均线类型,可自定义均线周期与价格偏离阈值,实时监控价格与均线的偏离程度,当价格超出设定的偏离区间时自动触发视觉提醒与警报通知,辅助交易者快速捕捉价格极端偏离、趋势反转或加速行情信号。
### 核心功能
1. **灵活均线配置**:支持SMA(简单移动平均)、EMA(指数移动平均)两种常用均线类型,可自由调整均线计算周期
2. **精准偏离监控**:自动计算收盘价与均线的偏离百分比,基于自定义阈值生成上下偏离轨道
3. **多重视觉提醒**:高亮标注超出偏离区间的K线背景,上偏离显示红色背景,下偏离显示绿色背景
4. **智能警报通知**:支持价格向上突破、向下跌破、双向偏离三种警报条件,覆盖全场景监控需求
5. **界面友好**:指标叠加在主图显示,不遮挡价格走势,线条配色清晰易辨
### 使用方法
1. 将指标代码添加至TradingView Pine编辑器,加载至图表
2. 参数自定义:选择均线类型、设置均线周期(默认120)、调整偏离阈值(默认12%)
3. 实时观察:价格在上下轨道内运行为正常区间,超出轨道时触发背景高亮
4. 警报设置:开启指标警报,接收价格极端偏离的实时通知
### 适用场景
适用于股票、加密货币、外汇、期货等全品类交易品种,可用于趋势行情中的回调预警、震荡行情中的高低点捕捉、极端行情中的超买超卖判断,适配日线、小时线等所有时间周期。
---
# MA Distance Alert - Moving Average Distance Alert Indicator
## English Description
### Indicator Introduction
MA Distance Alert is a price deviation monitoring indicator based on the moving average principle. It supports both SMA and EMA types, allowing custom moving average periods and price deviation thresholds. It monitors the deviation between price and moving average in real time, automatically triggers visual reminders and alert notifications when the price exceeds the set deviation range, helping traders quickly capture signals of extreme price deviation, trend reversal or accelerated market trends.
### Core Features
1. **Flexible MA Configuration**: Support two commonly used moving average types: SMA (Simple Moving Average) and EMA (Exponential Moving Average), freely adjust the MA calculation period
2. **Accurate Deviation Monitoring**: Automatically calculate the deviation percentage between the closing price and the moving average, generate upper and lower deviation bands based on custom thresholds
3. **Multiple Visual Alerts**: Highlight the K-line background when exceeding the deviation range, red background for upward deviation and green background for downward deviation
4. **Smart Alert Notifications**: Support three alert conditions: price breakout upward, breakdown downward, and two-way deviation, covering full-scenario monitoring needs
5. **User-friendly Interface**: Overlaid on the main chart without blocking price movements, with clear and distinguishable line colors
### How to Use
1. Add the indicator code to TradingView Pine Editor and load it on the chart
2. Customize Parameters: Select MA type, set MA period (default 120), adjust deviation threshold (default 12%)
3. Real-time Observation: Price moving within upper and lower bands is the normal range, background highlight is triggered when exceeding the bands
4. Alert Setup: Enable indicator alerts to receive real-time notifications of extreme price deviations
### Applicable Scenarios
Suitable for all trading varieties including stocks, cryptocurrencies, forex, futures, etc. It can be used for callback early warning in trending markets, high-low point capture in ranging markets, overbought and oversold judgment in extreme markets, compatible with all time frames such as daily and hourly charts.
Indikator
S&P 500 Breadth BullstackCore Idea of the Indicator:
The indicator is not a classic buy/sell trigger, but rather a breadth regime scanner for the S&P 500. In other words, it measures how many stocks in each sector are trading above their 20-day, 50-day, and 200-day moving averages (Simple Moving Average - SMA), compresses that information into a color-coded view, and visualizes whether there is a true “bullstack” in the market.
In practical terms, this means it is especially useful for filtering long positions during strong market phases, scaling into them, and turning defensive earlier when market breadth starts to weaken.
Structure:
The code loads three breadth series for each of the 11 S&P 500 sectors, plus the Nasdaq-100: 20D, 50D, and 200D.
The data is retrieved using request.security() from other symbols or contexts; in Pine, this function is used to access values from other symbols or timeframes within the script.
The script also calculates three averages from the 11 sectors (tot20, tot50, tot200) to create an overall view of S&P 500 market breadth.
Color Logic:
The core idea is: 20D represents short-term momentum, 50D represents medium-term confirmation, and 200D represents the long-term trend.
The bullstackColor() function does not create a simple traffic-light system, but rather a graduated state model: green/turquoise means broad strength, white marks the transition zone, yellow/orange signals early weakness, red to near-black indicates clear breadth weakness, and pink represents a special case of negative divergence.
This divergence occurs when many stocks are still above their 200D line in the long term (b200 > 65), while short-term momentum is already breaking down significantly (b20 < 45) — a typical late-cycle/distribution signal.
Long Strategy:
For longs, the indicator is most powerful when used as a market filter:
The best entries occur when overall breadth rotates up out of capitulation through neutral (white) and then into light green, with 20D breadth picking up first as short-term momentum, 50D breadth then confirming as the medium-term trend, and 200D remaining stable as the long-term trend.
The highest-quality longs occur when not only “Total SPY” turns green, but especially cyclical sectors such as XLY, XLF, XLI, XLK, and ideally the Nasdaq block as well are participating. That usually means the rally is broad, risk-on, and more durable.
Specifically, I would derive three long setups from this:
Early long (first tranche) on the turn from capitulation into the neutral zone, when 20D breadth is clearly rising and 50D breadth is no longer declining.
Confirmation long (second tranche), when 20D > 50D > 50 and several leading sectors turn green at the same time.
Trend add-on (final tranche), when the overall market and cyclical sectors such as XLY, XLF, XLI, and XLK are already green and rotating into turquoise, while pullbacks on the price chart remain shallow (only down to the SMA20 or slightly below).
Position Management:
For position management, the color is almost more important than the entry itself: as long as the picture remains green and 20D only fluctuates slightly, that argues for holding rather than nervous re-trading.
Partial profit-taking or tighter risk management makes sense once strong green fades into pale green or white, because that often marks the transition from expansion to exhaustion.
A clear warning signal against new longs is pink: in that case, the long-term trend is still intact, but short-term momentum is already rolling over — exactly the kind of environment where late longs are often rewarded the least. Caution is warranted here, and the first partial profits should be secured.
Short Strategy:
I would trade shorts much more selectively than longs with this indicator, because breadth indicators in uptrends can often stay “too strong” longer than short setups can tolerate.
The better short opportunities do not occur on the first yellow bar, but when the overall picture shifts from white/yellow into orange/red, while 20D breadth and 50D breadth are weak at the same time and defensive sectors look better than cyclical ones. That points more to genuine market distribution rather than just a simple pullback in individual sectors.
The cleanest short entries come after a failed rebound out of a pink divergence, or when multiple sectors flip synchronously into red/dark red after a warning phase, especially if Nasdaq, Tech, and other cyclical sectors confirm the weakness.
A simple practical rule would therefore be:
Prefer longs when breadth is expanding, 20D leads first, and 50D/200D then confirm.
No fresh longs during pink divergences.
Only take shorts when the weakness is broad, synchronized, and visible across sectors.
One more important point:
The script measures market breadth, not price structure. Therefore, it is best used as a top-down filter together with price triggers in SPY/ES/QQQ or in individual stocks — for example, breadth turning green plus a breakout or trend pullback on the chart, rather than trading breadth in isolation. Indikator

Indikator

[CLH] Simple Sweep ReversalOVERVIEW
Works on a 1 Hour chart ONLY. Attempts to detect high-probability reversal setups after liquidity sweeps of prior day (PD) highs/lows or overnight (18:00–04:59) highs/lows. Designed to help catch morning session reversals (1:00–10:59 AM chart time) on futures/indices like ES and NQ. It combines swing rejection candles (with customizable wick % filter), moving average trend alignment, and multi-timeframe extreme filters to avoid trading into major weekly/daily highs/lows.
CONCEPT
Many reversals occur when price "sweeps" resting liquidity (stops above PD high or below PD low / overnight extremes), then rejects with a strong wick. This script identifies those failed breakouts and only signals when:
• A swing high/low candle forms with significant wick rejection
• Price is on the "wrong" side of the fast MA (bearish MA for shorts, bullish for longs)
• The move is NOT too close to multi-day or weekly extremes (anti-whipsaw protection)
Signals are restricted to the 01:00–10:59 window to catch post-overnight / early NY reversals.
KEY FEATURES
• Prior Day (PD) High/Low breakout sweeps
• Overnight Range (18:00–04:59) High/Low sweeps
• Wick rejection filter (min % of candle range – default 20%)
• Fast/Slow MA filter (default SMA 20 / 200) + minimum separation (points)
• Daily lookback extreme filter (default 7 days, 100 points buffer)
• Weekly lookback extreme filter (default 2 weeks, 200 points buffer) – blocks shorts near weekly highs, longs near weekly lows
• Optional 4H candle panel (last 3 candles) in lower-right for higher-timeframe context
INPUTS OVERVIEW
• Fast MA Length (default 20) / Slow MA Length (default 200) – SMA/EMA/WMA selectable
• Min separation between MAs (points) – avoids flat-market signals
• Min Wick % of range (default 20%) – 0 = disabled
• Lookback days for daily extremes (default 7) + max distance (default 100 pts)
• Lookback weeks for weekly extremes (default 2) + max distance (default 200 pts)
• Show MAs and Show 4H panel toggles
• Colors for MAs, signals, 4H bodies/wicks
DISCLAIMER
This is NOT financial advice. No guarantee of profitability – past performance ≠ future results. Use at your own risk. Backtest thoroughly and combine with your trading plan. Designed as a confluence tool, not a standalone system.
Feedback welcome! If you find bugs, want tweaks (e.g., session times, volume filter, fib extensions), or have ideas to improve, drop a comment or message. Happy trading! Indikator

US Market TimingDisclaimer: Results are hypothetical and do not take into account taxes and fees. This is for informational purposes only and is not financial advice. People can and do lose money investing and trading. Invest responsibly.
US Market Timing strategy designed for long-only position trading. It focuses on multi-month trends rather than day trading, specifically optimized for major US indices like the Nasdaq-100 (QQQ) and S&P 500 (SPY).
Here is a breakdown of how the strategy operates:
Core Strategy Logic
The system uses a "dual-index confirmation" approach. It looks at the S&P 500 (SPX) for the broad market regime and the Nasdaq-100 (QQQ) for specific execution signals.
Entry Conditions (The "Buy" Signal)
To enter a trade, four specific conditions must be met simultaneously:
Broad Market Strength: The SPX daily low must stay above its 21-day EMA for 4 consecutive days.
Growth Confirmation: The QQQ daily low must be above both its 14-day and 21-day EMAs.
Momentum Check: The current QQQ close must not be weaker than the previous three days (preventing buying into a dip that's turning into a slide).
Trend Intensity: The SPX ADX (Average Directional Index) must be above 16, ensuring the market is actually trending and not just chopping sideways.
Exit Conditions (The "Sell" Signal)
The strategy uses two distinct methods to get out of a trade:
The Trend-Based Exit (Loose Stop): This triggers if the SPX 7-day SMA crosses below the 107-day SMA while the QQQ is showing price weakness (closing below its 21-day EMA). This is designed to capture the bulk of a major bull run.
The Safety Exit (Tight Stop): A hard stop is set at 3.5% below the entry price. However, it only triggers if the QQQ is also trading below its 50-day SMA, acting as a double-confirmation to avoid being "shaken out" by minor volatility.
Key Technical Components
21-day EMA - Used as the primary "floor" for price action.
ADX (13-period) - Filters out "flat" markets; requires a value > 16 to trade.
7/107 SMA Cross - Determines the long-term trend shift for exits.
QQQ/SPX Correlation - Uses SPX for the macro trend and QQQ for the micro timing.
Performance Notes
Best Results: QQQ, MDY, IWM, SPY and their leveraged counterparts (QLD, SSO).
Drawdown : Historically, it has significantly outperformed "Buy and Hold" in terms of risk-adjusted returns, often cutting the Max Drawdown of the Nasdaq in half (e.g., QQQ ~28% drawdown vs. much higher during the dot-com era).
Timeframe : Designed for daily charts with trades lasting several months.
Strategie

Indikator

Indikator

Indikator

Indikator

Indikator

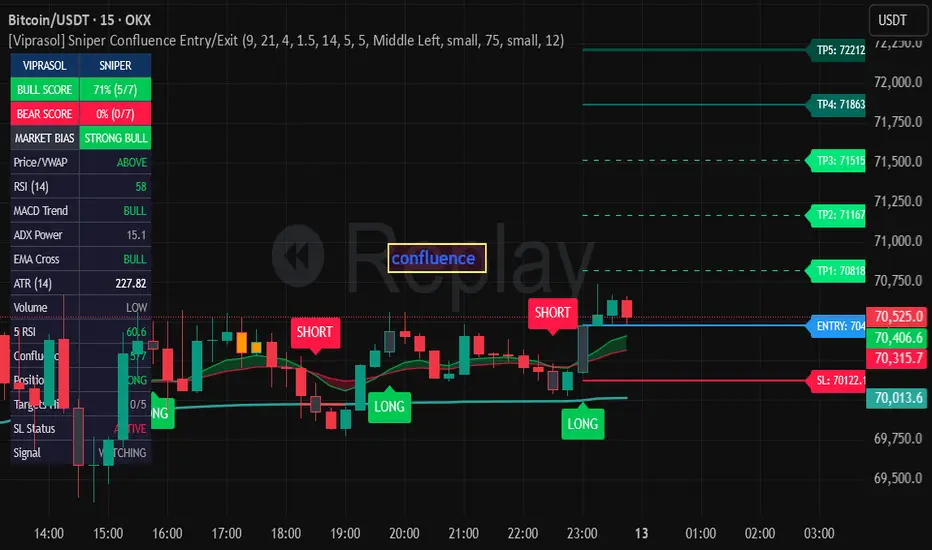
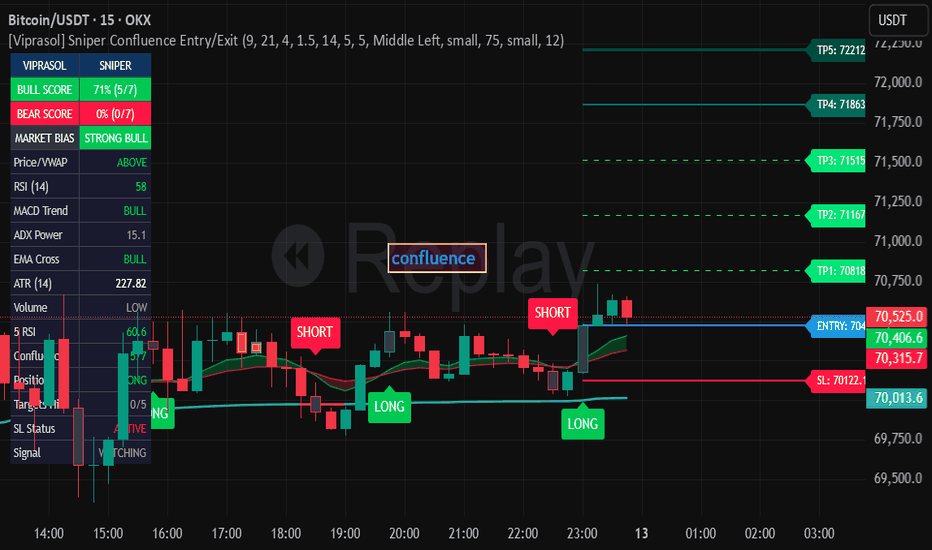
Viprasol Sniper Confluence Entry/Exit## Overview
The Sniper Confluence Entry/Exit indicator builds on Sniper Entry/Exit with SL&TP by , which provided EMA crossover signals with ATR-based stop-loss/take-profit levels, a VWAP overlay, RSI/MACD display, and retest candle highlighting. This version adds a 7-factor confluence scoring engine that gates every signal — crossovers only fire when multiple technical factors align, dramatically reducing false entries. Built for swing and intraday traders who want clean, high-probability setups with automatic risk management.
## How It Works
**Signal Generation (from original):**
Entries are triggered by a Fast EMA / Slow EMA crossover. When the fast EMA crosses above the slow EMA, a long signal is generated; when it crosses below, a short signal is generated. The original script displayed these crossovers alongside supporting indicators (VWAP, RSI, MACD) but did not require them to agree before firing a signal.
**7-Factor Confluence Engine (new):**
This version adds a scoring layer that sits between the crossover and the signal output. Each bar, the indicator evaluates 7 independent factors and assigns 1 point for each that confirms the trade direction. A signal only fires when the total score meets your minimum threshold (default: 4/7).
Scoring logic (pseudocode):
```
confluenceScore = 0
// Factor 1: Price vs VWAP
if (long and close > vwap) or (short and close < vwap) → score += 1
// Factor 2: RSI direction
if (long and rsi > 50) or (short and rsi < 50) → score += 1
// Factor 3: MACD trend
if (long and macdLine > signalLine) or (short and macdLine < signalLine) → score += 1
// Factor 4: EMA alignment
if (long and fastEMA > slowEMA) or (short and fastEMA < slowEMA) → score += 1
// Factor 5: ADX + directional index
if adx > 25 and ((long and diPlus > diMinus) or (short and diMinus > diPlus)) → score += 1
// Factor 6: Volume confirmation
if volume > volumeSMA and ((long and close > open) or (short and close < open)) → score += 1
// Factor 7: Secondary timeframe RSI
if (long and secondaryRSI > 50) or (short and secondaryRSI < 50) → score += 1
signal fires only if confluenceScore >= minimumScore
```
A score of 5/7 or higher typically indicates a strong, well-supported setup. The configurable minimum lets you tune signal frequency vs. quality.
**Bar-Close Confirmation (new):**
When enabled, signals are delayed until the bar closes, preventing premature entries from intra-bar wicks that reverse before close.
**ATR-Based Stop-Loss & Take-Profit (from original, extended):**
The original calculated a single stop-loss and take-profit from ATR. This version extends that to:
- **Stop-Loss** — ATR multiplied by your chosen risk factor (same core logic as original)
- **Take-Profit Levels (1-5)** — Configurable number of TP levels at 1R, 2R, 3R, 4R, 5R distances (new — original had fixed levels)
- **Trailing Stop to Breakeven** — Optionally moves SL to entry price once TP1 is hit (new)
**Retest Candle Highlighting (from original):**
Bars that pull back to the fast EMA after a signal are highlighted in orange, marking potential add-on or re-entry opportunities.
**Secondary Timeframe RSI (from original, extended):**
The original included a secondary timeframe RSI hardcoded to the 5-minute chart. This version makes the timeframe user-configurable.
## Key Features
**From the Original:**
- EMA crossover signal generation (fast/slow EMA)
- ATR-based stop-loss and take-profit calculation
- VWAP overlay with directional coloring
- RSI and MACD display
- Retest candle highlighting at EMA pullbacks
- Secondary timeframe RSI confirmation
**Added in This Version:**
- 7-factor confluence scoring engine with configurable minimum score threshold
- Bar-close confirmation filter to prevent wick-driven false entries
- Trailing stop-loss to breakeven after TP1 is hit
- Configurable number of take-profit levels (1-5, was fixed)
- Configurable secondary timeframe (was hardcoded to 5m)
- SL label showing breakeven status when trailing is active
- 5 alert conditions with dynamic messages
- Full dashboard showing all 7 confluence factors, position status, and targets hit
## How to Use
**Setup:**
1. Add to any chart (works on all markets and timeframes)
2. Set your preferred EMA periods (default: 9/21)
3. Adjust the minimum confluence score — higher = fewer signals, better quality
4. Set your ATR multiplier for stop-loss width
**Reading Signals:**
- **LONG label** appears below bar when bullish crossover fires with sufficient confluence
- **SHORT label** appears above bar when bearish crossover fires with sufficient confluence
- Blue line = Entry, Red line = Stop-Loss, Green dashed lines = Take-Profit levels
- Lines turn turquoise when their target is hit
- Orange candles indicate price retesting the fast EMA (potential add-on opportunity)
**Dashboard:**
The side panel shows real-time scores for all 7 factors plus current position info, targets hit, and SL status.
**Recommended Starting Settings:**
- Scalping (1m-5m): Fast EMA 5, Slow EMA 13, Min Score 5, ATR Mult 1.0
- Intraday (15m-1H): Fast EMA 9, Slow EMA 21, Min Score 4, ATR Mult 1.5
- Swing (4H-1D): Fast EMA 9, Slow EMA 21, Min Score 4, ATR Mult 2.0
## Settings
**Signal Settings:** Fast/Slow EMA periods and bar-close confirmation toggle.
**Confluence Filter:** Enable/disable the score filter and set the minimum threshold.
**Risk Management:** ATR period, SL multiplier, number of TP levels, and breakeven trailing toggle.
**Secondary Timeframe:** Choose which timeframe provides the secondary RSI confirmation.
**Dashboard:** Position, font size, and show/hide toggle.
**Visuals:** Toggle EMA ribbon, VWAP, TP/SL lines, retest highlighting, label sizes and offsets.
## Alerts
1. **Long Entry Signal** — Fires when a bullish confluence entry triggers
2. **Short Entry Signal** — Fires when a bearish confluence entry triggers
3. **Any Entry Signal** — Fires on either long or short entry
4. **Strong Bull Bias** — Fires when bull confluence score crosses above 70%
5. **Strong Bear Bias** — Fires when bear confluence score crosses above 70%
All alerts include {{ticker}}, {{close}}, and {{interval}} for dynamic notification messages.
## Limitations & Disclaimer
- EMA crossover signals are inherently lagging — they work best in trending markets and may produce whipsaws during consolidation
- The confluence score uses current-bar values; in fast markets, conditions can change quickly
- The secondary timeframe RSI uses `request.security()` which may repaint on the current bar of that timeframe
- TP/SL levels are visual guides — they do not execute trades automatically
- Past performance of any signal system does not guarantee future results
- This indicator is for educational and analytical purposes only — it is not financial advice. Always use proper risk management and do your own analysis before trading.
## Credits & Attribution
This indicator is derived from **"Sniper Entry/Exit with SL&TP (open-source, TradingView). The following components originate from that script:
- EMA crossover signal generation logic
- ATR-based stop-loss and take-profit calculation
- VWAP overlay
- RSI and MACD display
- Retest candle highlighting concept
- Secondary timeframe RSI (originally hardcoded to 5m)
Viprasol additions: 7-factor confluence scoring engine, bar-close confirmation, trailing stop to breakeven, configurable TP levels (1-5), configurable secondary timeframe, breakeven status labels, alert conditions, and dashboard.
Indikator
MA Cross with ATR TargetsBYBIT:BTCUSDT.P Overview
The MA Cross with ATR Targets is a comprehensive trading indicator designed for traders who follow moving average crossovers and want precise, ATR-based risk management. It detects crossovers between a fast MA (SMA or EMA) and MA200, then automatically calculates and displays three key levels: Stop Loss, First Take Profit (TP1), and Second Take Profit (TP2) based on ATR multipliers.
Additionally, it includes a multi-timeframe MA200 position table to quickly assess market context across 5min, 15min, 1h, 4h, and 1d timeframes.
Key Features
Moving Average Cross Signals
Detects crossovers between MA20 (configurable as SMA or EMA) and MA200
Visual signals:
Green triangle below bar -> Bullish crossover (MA20 crosses above MA200)
Red triangle above bar -> Bearish crossover (MA20 crosses below MA200)
ATR-Based Target Levels
When a crossover occurs, the indicator automatically plots:
Stop Loss (SL) – Red dashed line
First Take Profit (TP1) – Green dashed line (closer target)
Second Take Profit (TP2) – Green dashed line (main target)
All levels are calculated using the current ATR value with customizable multipliers:
SL Distance = ATR x Stop Multiplier
TP1 Distance = SL Distance x First Take Multiplier
TP2 Distance = SL Distance x Take Multiplier
Multi-Timeframe MA200 Context Table
A compact table in the bottom-left corner shows the position of MA200 relative to current price across five timeframes:
5m, 15m, 1h, 4h, 1d
Green cell -> Price is above MA200 (bullish bias)
Red cell -> Price is below MA200 (bearish bias)
This helps you quickly assess the broader trend direction before entering a trade.
Signal Display
All historical signals are displayed on the chart
Older signals appear without price scale markers and without background fill for cleaner visualization
Only the most recent signals have full visual formatting
How to Use
Entry Signals
LONG entry when a green triangle appears below the bar (MA20 crosses above MA200)
SHORT entry when a red triangle appears above the bar (MA20 crosses below MA200)
Exit / Management
Stop Loss – Place your stop at the red dashed line
Take Profit 1 (TP1) – Consider taking partial profits at the first green line
Take Profit 2 (TP2) – Full profit target at the second green line
Context Check
Before entering, glance at the bottom-left table:
If most timeframes show green -> strong bullish alignment
If most timeframes show red -> strong bearish alignment
Mixed colors -> exercise caution
Recommended Additional Indicators
For better confluence and higher probability setups, it is recommended to use this indicator alongside:
MACD – for momentum confirmation
RSI – for overbought/oversold conditions
ADX and DI v4 – for trend strength and direction
Tips
Adjust ATR multipliers based on your risk tolerance and the asset's volatility
Use the multi-timeframe table to avoid trading against the larger trend
The indicator works on all timeframes – from 1-minute to monthly charts
Combine with the recommended indicators for additional confirmation
Notes
This is a visual indicator only – it does not execute trades automatically
All levels are calculated based on the closing price of the signal bar
Historical signals remain visible but without price scale markers or background fill for cleaner chart presentation
Indikator

Indikator

Indikator

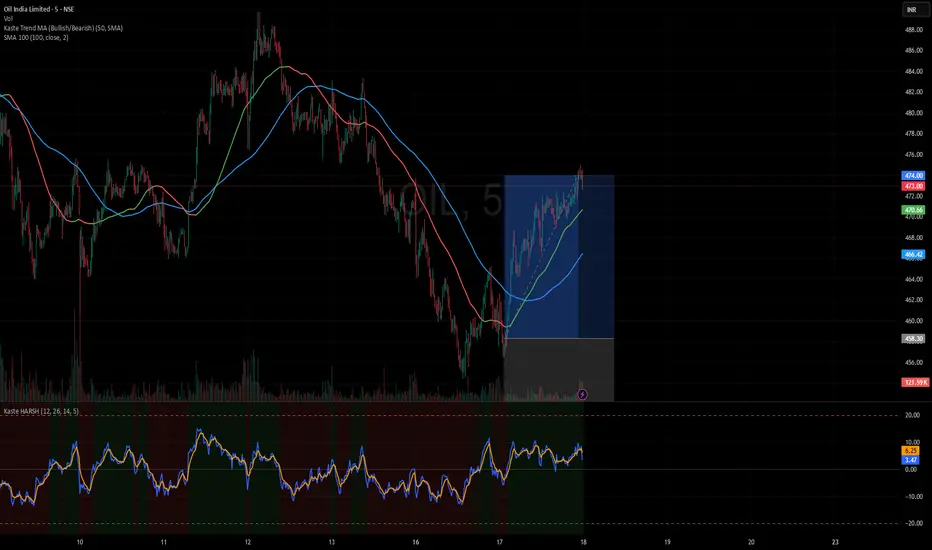
Directional SMA Trend LineShort description
A directional trend line based on the fast SMA. The line changes color when the trend regime shifts, using the relationship between a short SMA and a long SMA. Simple, visual, and effective for trend-following and swing trading.
Full description
The Directional SMA Trend Line is a clean trend-following indicator built around two simple moving averages.
The indicator plots the fast SMA as the main trend line. Its color changes depending on the relationship between the fast SMA and the slow SMA:
Green when the fast SMA is above the slow SMA
Purple when the fast SMA is below the slow SMA
This creates a clear directional line that helps traders stay aligned with the prevailing trend. When the color changes, it signals a potential shift in trend direction or market regime.
Suggested settings
On the weekly timeframe , a 10-period fast SMA and a 20-period slow SMA work very well for swing trading. This combination offers a strong balance between responsiveness and trend stability. In many cases, the 10/20 weekly setup is a reliable way to follow medium-term directional moves.
On the daily timeframe , shorter combinations such as 4/7 can also be effective. However, there is no universal setting that works best for every stock. Each stock has its own rhythm and volatility profile, so traders are encouraged to test different fast/slow ratios to find what fits best.
Over time, you may notice that certain categories of stocks tend to respond well to similar SMA relationships. Even so, the weekly 10/20 setup remains a strong baseline for identifying swing trends.
Core idea
The trend is your friend. This indicator is designed to keep the trend visually simple: follow the line, watch the color, and stay on the right side of momentum.
How to use it
Use the line color to quickly identify bullish or bearish trend conditions
Stay cautious when the color changes, as it may indicate a new trend phase
Apply weekly 10/20 settings for swing trading
Test shorter settings on daily charts for stock-specific optimization
Notes
This is a trend-following tool, not a prediction tool. Like all moving-average-based indicators, it may react later in fast reversals or sideways markets. Indikator

Indikator

Indikator
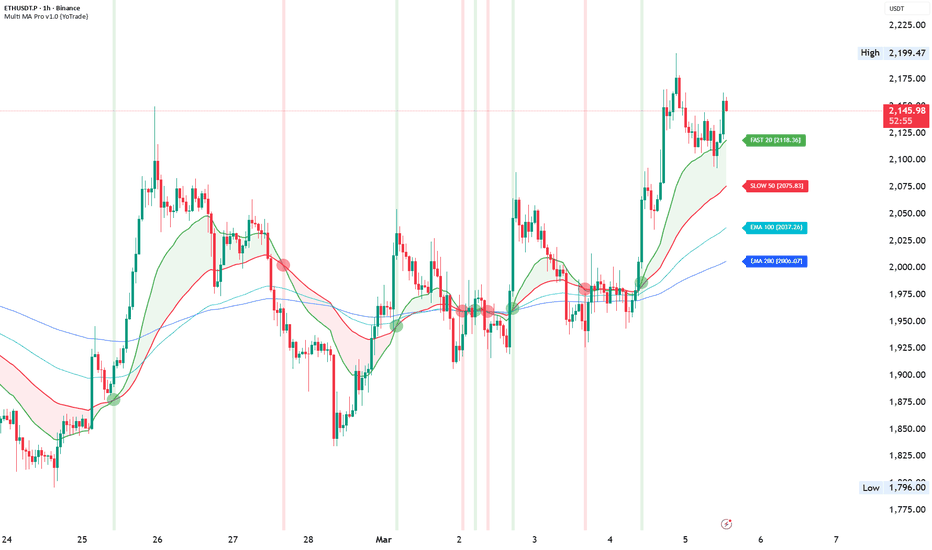
Indikator

Indikator