Indikator

Technical 4x4 MatrixTechnical 4x4 Matrix:
Can Rethinking Common Sense Bring New Insights?
Description:
Does reviewing existing common sense bring new insights? The "Technical 4x4 Matrix" challenges the traditional way we view technical analysis. Instead of stacking endless line charts or reading boring data tables, this indicator reimagines 16 classic technical indicators (RSI, MACD, Bollinger Bands, etc.) by projecting them onto a unified, 4x4 analog meter interface directly on your chart.
By standardizing completely different mathematical models into a single visual language, we can uncover hidden confluences and macro alignments that isolated indicators often miss.
To make this matrix function, the script performs heavy data normalization and correlation calculations behind the scenes. Here is why these calculations are used and what they actually output:
1. Data Normalization Engine (The Analog Meters)
Why it's used: You cannot simply average an RSI (measured 0 to 100) with a MACD (absolute price differences). To create a unified "Average Flow," every indicator must be converted to a uniform scale.
The Calculation: The script uses a custom normalization formula:
Normalized Value = (Current Value - Min Value) / (Max Value - Min Value)
Actual Output Value: Regardless of the indicator's native scale, the output value for every single meter is strictly constrained between 0.0 (Absolute Cold/Oversold) and 1.0 (Absolute Hot/Overbought). For example, a neutral RSI of 50 outputs exactly 0.5.
2. Master HUD Crosshair (Macro Correlation)
Why it's used: To determine if the current micro price action is actually aligned with the macro trend, rather than just reacting to short-term noise.
The Calculation:
First, it creates a ratio: Macro Ratio = SMA(Close, 250) / SMA(Close, 1)
Next, it calculates the correlation between the closing price and this ratio over 20 periods, scaling it for the HUD's Y-Axis:
Y-Axis Ratio = (Correlation + 1.0) / 2.0
Actual Output Value: The raw correlation ranges from -1.0 to 1.0. After scaling, the final Y-Axis output is a coordinate between 0.0 and 1.0. The X-Axis is the simple average of all active 0.0 to 1.0 normalized indicators. If the crosshair intersects at (0.8, 0.8), it outputs a mathematically backed signal of strong macro and micro bullish alignment.
16 togglable indicators rendered as square analog meters with dynamic needle tracking and LED status lights.
Garbage Collection: Efficient array clearing prevents memory leaks and visual ghosting.
Master Crosshair: A central HUD that tracks the aggregated flow of all 16 indicators (X-axis) against macro-trend correlation (Y-axis).
Indikator

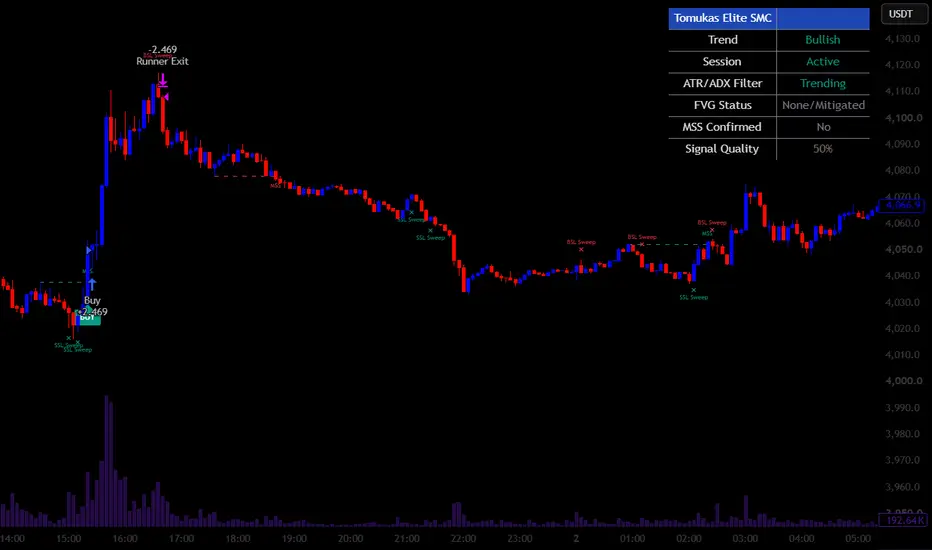
Tomukas Elite SMCTomukas Elite SMC is a premium Smart Money Concepts strategy designed to focus on high-probability institutional setups instead of frequent signals.
The strategy combines three core concepts into a single trading framework:
Liquidity Sweeps
Market Structure Shift (MSS/BOS)
Fair Value Gap (FVG) Retracement
Rather than chasing price, the strategy waits for liquidity to be taken, confirms a genuine shift in market structure, and enters only after price retraces into an imbalance. This approach aims to filter out low-quality trades and improve overall consistency.
Key Features
Non-repainting signals
Higher-timeframe trend confirmation
Liquidity sweep detection
MSS/BOS confirmation using candle closes
Automatic Fair Value Gap detection
Session filter (London & New York)
ATR volatility filter
Built-in risk management
Break-even automation after TP1
Runner management for extended trends
Strategy Tester compatible
The strategy is designed for traders who value patience and precision over constant market participation. By waiting for multiple confirmations to align, it seeks to reduce false entries while maintaining favorable risk-to-reward opportunities.
Best suited for: Gold (XAUUSD), major Forex pairs, and indices on lower timeframes such as 1M, 3M, and 5M.
As with any trading strategy, no setup guarantees profits. Proper risk management, disciplined execution, and thorough testing are essential before using it with live capital. Strategie

Indikator

Eugen Liquidity Compass - Helle Daily Macro Risk SignalsDer Eugen Liquiditäts-Kompass ist ein makrobasierter Liquiditäts- und Risikoindikator für Aktien, ETFs, Indizes, Kryptowährungen und andere Risikoassets.
Der Indikator analysiert zentrale Markt- und Liquiditätstreiber wie US Net Liquidity, DXY, reale US-Renditen, High-Yield-Spreads, NFCI, VIX/MOVE, USDJPY und einen frei wählbaren Benchmark wie SPY, QQQ oder BTC.
Ziel ist es, das übergeordnete Marktregime sichtbar zu machen:
Risk-On
Neutral
Risk-Off
Der Indikator berechnet einen Score von 0 bis 10:
8–10: Stark Risk-On
6–8: Risk-On
4–6: Neutral
2–4: Risk-Off
0–2: Stark Risk-Off
Die US Net Liquidity wird berechnet als:
Fed Balance Sheet - Treasury General Account - Reverse Repo
Der Indikator nutzt mehrere Impulse über 4, 8 und 13 Wochen, um kurzfristige und mittelfristige Liquiditätstrends zu erkennen.
Empfohlenes Timeframe:
Der Indikator ist primär für den Daily Chart entwickelt.
Beste Nutzung: 1D.
Auch möglich: Weekly für strategische Regimeanalyse.
Nicht empfohlen: Intraday-Scalping oder Minutencharts.
Signale:
STRONG LONG: sehr positives Risk-On-Umfeld
LONG: Long-Bias erlaubt
WEAK LONG: Long möglich, aber mit Makro-Gegenwind
EXIT: Risiko reduzieren
HARD EXIT: starkes Stresssignal
CARRY STRESS: mögliches USDJPY/Yen-Carry-Unwinding
Duration Stress:
Duration Stress bedeutet: DXY und reale US-Renditen sind gleichzeitig negativ für Risikoassets. Das ist besonders relevant für QQQ, Software, Halbleiter, Bitcoin, Krypto und hoch bewertete Wachstumsaktien.
Der Indikator ist kein reines Kauf-/Verkaufssystem, sondern ein Makro-Filter. Er sollte mit Chartanalyse, Risikomanagement und eigener Marktanalyse kombiniert werden.
Dieser Indikator dient nur zu Research- und Analysezwecken und stellt keine Anlageberatung, Kaufempfehlung oder Verkaufsempfehlung dar. Märkte können sich schnell verändern, und makroökonomische Daten können verzögert oder revidiert werden.
Dies ist keine Anlageberatung, sondern eine Research-Einschätzung auf Basis der verfügbaren Daten und Annahmen. Indikator

[ A L P H A X ] MAGNET - Liquidity Magnet EngineAlphaX MAGNET — Liquidity Magnet Engine: Hybrid Pool Detection, Sweep State Machine, Delayed Reclaim Entries, Absorption Pins, FVG Confluence & Weighted Scoring System
AlphaX MAGNET is a professional-grade liquidity-based trading system built around a single foundational observation: price is magnetically attracted to liquidity pools. Buy-side liquidity sitting above Equal Highs and sell-side liquidity sitting below Equal Lows are not random price levels — they are concentrations of institutional stop orders and pending market orders that price is consistently drawn toward before major directional moves begin. MAGNET detects these pools with a dual-method engine (pivot cluster analysis combined with Equal High/Equal Low range scanning), tracks every sweep event through a dedicated state machine, and fires precision entries through four distinct setup types — same-bar sweep and reclaim, delayed post-sweep reclaim, absorption pin bar, and FVG-liquidity overlap — scored through a weighted 9-point confluence system that rewards quality setup combinations over arbitrary filter accumulation. Unlike systems that suppress signals through cascading hard blocks, MAGNET is built on the philosophy that quality comes from the combination of setup type and confluence score, not from eliminating signal opportunities through excessive gating. Designed for active traders across crypto, forex, gold, and indices on any timeframe.
━━━━━━━━━━━━━━━━━━━━━━━━━━━━━━━━━━━━━━━━
💧 The Liquidity Pool Concept — Why Price Is Magnetic
Retail traders place stop losses at technically logical locations — just below swing lows (buy stops become sell orders when triggered, providing sell-side liquidity or SSL) and just above swing highs (sell stops become buy orders when triggered, providing buy-side liquidity or BSL). These clusters are not secrets. Institutional participants, who need massive liquidity to fill their position sizes, deliberately engineer price moves toward these clusters — hunting the stops to generate the counterparty order flow they need.
This creates a recurring, exploitable pattern:
SSL pools below significant lows are swept — price dips below to trigger sell stops, filling institutional buy orders
The sweep reverses sharply as the institutional position is filled and price moves in the intended direction
BSL pools above significant highs are swept — price spikes above to trigger buy stops, filling institutional sell orders
The spike reverses as the selling position is filled
MAGNET is built to detect these pools before the sweep, identify the sweep the moment it occurs, and provide structured entry signals at the precise points where the institutional reversal is most likely to begin. The word "magnet" captures the system's core thesis: liquidity pools are not just price levels to avoid — they are targets that price is attracted to, and the moment after the sweep is the highest-probability institutional entry available.
━━━━━━━━━━━━━━━━━━━━━━━━━━━━━━━━━━━━━━━━
🔍 The Hybrid Pool Detection Engine
MAGNET identifies liquidity pools using two independent methods running simultaneously, then combines their outputs to determine the single most relevant BSL and SSL level at any moment.
━━━━━━━━━━━━━━━━━━━━━━━━━━━━━━━━━━━━━━━━
Method 1 — Pivot Cluster Analysis
The first engine detects fractal swing highs and lows using a configurable pivot length (default: 5 bars each side) and tracks clusters of pivots near the same price level. Rather than marking every single pivot as a liquidity level, MAGNET uses a weighted averaging approach:
When a new pivot forms near an existing pivot level (within 1.5× the ATR pool tolerance), the two pivots are merged — the new cluster level is the weighted average of both, and the touch count increments. When a new pivot forms far from the existing cluster, a new level is established.
A pivot cluster only becomes an active liquidity pool when its touch count meets the minimum threshold (default: 2 pivot touches) and its age exceeds the minimum pool age (default: 3 bars). These two conditions ensure the pool represents genuine accumulated stop orders rather than a single swing point that may not yet have attracted meaningful liquidity.
Why pivot clustering matters: A level touched twice or more has drawn retail traders to place stops at it on multiple occasions. Each time price revisits without breaking, more stops accumulate just beyond it. The cluster represents not a single trader's stop but a compounding concentration of stop orders — the largest and most powerful liquidity pools in the market.
━━━━━━━━━━━━━━━━━━━━━━━━━━━━━━━━━━━━━━━━
Method 2 — Equal High / Equal Low (EQH/EQL) Range Scanning
The second engine scans the entire lookback window (default: 40 bars) to find the highest high and lowest low in the range, then counts how many bars within that window came within the ATR pool tolerance of those extremes. When the touch count meets the minimum EQ touch threshold (default: 2 touches), the extreme qualifies as a genuine Equal High (BSL pool) or Equal Low (SSL pool).
Why EQH/EQL scanning is powerful: The highest level in a range with multiple near-touches is the quintessential Equal Highs pattern — the most widely recognized institutional liquidity target in smart money trading. Every time price approaches but fails to break through the level, another wave of retail traders places buy stops above it "in case it breaks." The more touches, the denser the liquidity cluster above. The EQL range scan identifies these levels objectively and in real time without requiring manual identification.
━━━━━━━━━━━━━━━━━━━━━━━━━━━━━━━━━━━━━━━━
Pool Selection Logic
From both methods, MAGNET selects the single most relevant active BSL and SSL level at any moment. When both methods have identified a valid pool of the same type, the closer one to the current price is selected — the near-term liquidity target takes precedence over a more distant one. The active pools are displayed on the dashboard as exact prices and plotted as dashed lines extending forward on the chart.
Magnet Above / Magnet Below: The active BSL (if above current price) is displayed as MAGNET ABOVE — the level price is currently being drawn toward on the upside. The active SSL (if below price) is MAGNET BELOW — the downside liquidity target. These two levels are also used as the take-profit targets when TP at Opposing Magnet is enabled, with the opposing pool being the natural delivery target after a sweep reversal.
━━━━━━━━━━━━━━━━━━━━━━━━━━━━━━━━━━━━━━━━
⚡ The Sweep State Machine — Separating Sweeps from Entries
One of MAGNET's most important architectural decisions is the separation of the sweep detection from the entry signal. Many liquidity-based systems fire entries on the sweep bar itself — which frequently catches false sweeps, wicks that briefly cross the pool but are part of a larger continuation move, and cascade waterfall bars that are not genuine reversals.
MAGNET uses a dedicated sweep state machine that tracks every sweep event independently from the entry logic:
Sweep detection:
An SSL sweep is detected when the current bar's low extends below the active SSL pool by more than the minimum sweep depth (default: 0.10× ATR). A BSL sweep is detected when the high extends above the active BSL by more than the minimum depth. Both are registered in memory with the bar index and the exact pool level that was swept.
Sweep window tracking:
After a sweep is registered, the system tracks how many bars have elapsed since the sweep. The configurable reclaim window (default: 8 bars) defines how long a sweep remains "fresh" for delayed reclaim entry qualification. The dashboard's SWEEP WINDOW row displays the active sweep state in real time — "SSL 2b ago" means an SSL sweep occurred 2 bars ago and the reclaim window is still open.
Cascade block (same-bar only):
A "cascade" bar is a strong, large-body continuation bar in the trend direction — close below open, body above 0.45× ATR, closing below the structure EMA and 50 EMA (bear cascade). When a sweep coincides with a cascade bar on the same bar , the same-bar sweep entry (Setup A) is blocked — entering against a waterfall candle in the same bar is the highest-risk stop-hunt entry scenario. Critically, this block only applies to same-bar entries — the cascade does not prevent the delayed reclaim entries (Setup B) that fire on subsequent bars once the cascade has resolved.
━━━━━━━━━━━━━━━━━━━━━━━━━━━━━━━━━━━━━━━━
🏷 Four Setup Types — Quality Through Combination
MAGNET's philosophy explicitly rejects quality-through-suppression. Rather than applying increasingly aggressive filters that block more and more signals, MAGNET provides four distinct setup types of varying quality, grades them A or B, scores them through the weighted confluence engine, and lets the score threshold determine which signals reach the chart. Each setup type captures a different institutional entry scenario.
━━━━━━━━━━━━━━━━━━━━━━━━━━━━━━━━━━━━━━━━
Setup A — SSL/BSL Sweep + Same-Bar Reclaim (Grade A, Primary)
The highest-conviction single-bar pattern. Fires when the sweep and the reclaim occur within the same bar — the classic stop-hunt candle.
Long conditions (SSL sweep + reclaim):
Current bar's low extends below the active SSL pool by more than the minimum sweep depth
The bar closes back above the SSL pool — the sweep was rejected within the same candle
A qualifying bull trigger candle is present — close above open, body at least 0.22× ATR, and the close-to-low distance exceeds 50% of total range (strong rejection wick)
The bar is not a cascade/waterfall bar — the same-bar cascade block applies
The institutional sequence: Price spikes below the SSL, triggering retail sell stops and filling institutional buy orders. Buyers immediately overwhelm the sell-stop flow and drive price back above the level within the same bar. This same-bar recovery is the clearest possible sign of genuine institutional absorption — they bought the stop-triggered selling and bid price back up in a single candle.
━━━━━━━━━━━━━━━━━━━━━━━━━━━━━━━━━━━━━━━━
Setup B — Delayed SSL/BSL Reclaim (Grade A, Primary)
The most powerful setup type for catching genuine post-sweep reversals. Fires in the 1 to N bars following a sweep event — capturing entries that miss the same-bar candle.
Long conditions (delayed SSL reclaim):
A qualifying SSL sweep occurred within the reclaim window (1 to 8 bars ago — the current bar is not the sweep bar)
The current bar's low is within ATR tolerance of the swept SSL level — price has returned to test the swept level
The current bar closes above the swept level — reclaiming it from below
A qualifying bull trigger candle confirms the reclaim with body and wick requirements
Why delayed reclaim is the highest-quality setup: Many genuine institutional sweep-and-reversal sequences do not complete in a single bar. After the sweep candle, price may consolidate below the swept level for 1–3 bars as retail traders interpret the sweep as a genuine breakdown and add to short positions. This consolidation below the swept level creates the highest-quality delayed reclaim entry — buying precisely as the "trapped shorts" below the swept level begin to be squeezed on the reclaim. Entries here have the swept level as a natural structural reference for the stop, the opposing BSL pool as a natural target, and the maximum available momentum from both the original sweep exhaustion and the trapped short squeeze.
━━━━━━━━━━━━━━━━━━━━━━━━━━━━━━━━━━━━━━━━
Setup C — SSL/BSL Absorption Pin (Grade B, Secondary)
A volume-confirmed pin bar at the pool zone — institutional absorption without a full sweep event.
Long conditions (SSL absorption):
Price is at or near the active SSL zone (within ATR pool tolerance)
A pin bar forms — lower wick exceeds 42% of the bar range, body is less than 38% of range, bar closes bullish
Volume is spiking above the configured volume threshold (default: 1.05× average) — confirming institutional activity at the zone
The bar closes above the SSL level — the absorption is from the buy side
The absorption scenario: Not every institutional accumulation at a liquidity pool involves a dramatic sweep. Sometimes institutions absorb all available sell-side liquidity at the SSL boundary without price needing to fully breach the level — the large volume at the pin bar low represents the same buying activity, just without the stop-triggering violation. The combination of the pin bar rejection shape and the volume spike at the zone is the visual and volumetric evidence of this absorption.
━━━━━━━━━━━━━━━━━━━━━━━━━━━━━━━━━━━━━━━━
Setup D — FVG + SSL/BSL Magnet Confluence (Grade B, Secondary)
The institutional structure overlap entry — a Fair Value Gap forming directly at the liquidity pool level.
Long conditions (FVG + SSL magnet):
A bullish Fair Value Gap is present on the current bar — the current bar's low is above the high of the bar two bars ago, creating a gap in the price structure
The FVG zone (between the current bar's low and the two-bars-ago high) overlaps with the active SSL pool level within ATR tolerance
A qualifying bull trigger candle confirms
The FVG-liquidity overlap concept: When a bullish FVG coincides with an SSL pool level, two independent institutional frameworks are pointing to the same price zone simultaneously. The FVG represents an imbalance in order flow that price will fill. The SSL pool represents a liquidity concentration that price is magnetically drawn toward. When they overlap at the same level, the zone has double-layer institutional significance — it is both an unfilled order imbalance and a liquidity pool, making it the highest-value structural level available at that moment.
━━━━━━━━━━━━━━━━━━━━━━━━━━━━━━━━━━━━━━━━
📊 Weighted Confluence Scoring — Quality Through Combination
MAGNET uses a weighted scoring system where primary setups (A and B — sweep and reclaim) count for 2 points while secondary setups (C and D — absorption and FVG) count for 1 point. The remaining 7 points come from confluence quality layers. The default minimum threshold is 5 points.
Score structure (maximum: 9 points):
Setup Type (2 points for primary, 1 for secondary) — the foundational quality weighting. A sweep or delayed reclaim inherently carries more institutional evidence than an absorption or FVG overlap
Active Pool Valid (1 point) — the SSL (for bull) or BSL (for bear) pool is currently active and qualified. Signals without a valid pool cannot score this point — there is no institutional liquidity reference without a qualified pool
HTF Bias Alignment (1 point) — the higher timeframe EMA structure agrees with the signal direction. Unlike most AlphaX systems where HTF is a hard block, MAGNET treats HTF as a soft confluence layer — counter-HTF trades can still fire if other confluence is sufficient. This reflects the reality that sweep-and-reclaim sequences frequently work counter-HTF precisely because institutions are sweeping retail positions that were trading with the HTF trend
Volume Layer (1 point) — current bar volume meets or exceeds the volume spike threshold. Confirms institutional participation on the signal bar
Structural Bias (1 point) — price is above the Structure EMA or RSI is above 45 for longs (close > structure EMA or RSI > 45); price below EMA or RSI < 55 for shorts. This dual condition accepts both trend-aligned and momentum-recovering entries
RSI Exhaustion (1 point) — RSI below 38 for longs with a recent SSL sweep, or RSI above 62 for shorts with a recent BSL sweep. This bonus point rewards entries where the RSI is genuinely oversold or overbought at the sweep level — the classic exhaustion reversal condition that historically produces the sharpest recoveries
Non-Chop Market (1 point) — Choppiness Index below the configured threshold (default: 65). Also enforced as a hard gate — unlike the HTF, extreme chop does block all signals regardless of score
At Pool Zone (1 point) — the current bar is within the pool tolerance of the active SSL (bull) or BSL (bear) zone. Rewards entries that are precisely positioned at the institutional level
Score examples:
A primary sweep reclaim (2 points) with valid pool, HTF alignment, volume, structural bias, and non-chop market reaches 7/9 — a high-conviction signal. A secondary FVG entry (1 point) with valid pool, volume, structural bias, and non-chop but no HTF alignment reaches 5/9 — the minimum threshold. The scoring naturally produces a gradient of signal quality without hard-blocking any combination.
━━━━━━━━━━━━━━━━━━━━━━━━━━━━━━━━━━━━━━━━
🎯 Magnet-Anchored Stop Loss and Target
Stop Loss Placement:
For bull signals, the stop is placed at the minimum of the current bar's low and the swept SSL level (using the stored sweep level from the state machine when a sweep occurred), minus the configured ATR buffer (default: 1.0× ATR). For bear signals, the maximum of the bar's high and the swept BSL level plus the ATR buffer.
This produces stops anchored to the structural invalidation point — the level that proves the institutional thesis wrong. A bull stop below the swept SSL means: if price closes below the sweep level after the reclaim, the sweep thesis has failed and institutions are not actually buying at this level.
Take Profit — Opposing Magnet (default: on):
When TP at Opposing Magnet is enabled, the take profit target is automatically set to the opposing liquidity pool — the BSL pool above price for long entries, the SSL pool below for shorts. This is the single most powerful TP mechanic available for liquidity-based trading: after a sweep of the SSL, the natural delivery target is the opposing BSL pool, because institutions who bought the SSL sweep will deliver price toward the next concentration of liquidity above. The magnet-to-magnet target represents the true institutional delivery destination.
When no opposing magnet is available (pool not yet qualified), the fallback is a configurable R-multiple target (default: 2.5R).
━━━━━━━━━━━━━━━━━━━━━━━━━━━━━━━━━━━━━━━━
📊 Live Dashboard
The 17-row real-time dashboard displays the complete internal state across five sections.
LIQUIDITY
BSL (EQH) — the active buy-side liquidity pool price. The current institutional overhead target. Red dashed line on chart with BSL · EQH label
SSL (EQL) — the active sell-side liquidity pool price. The current institutional downside target. Yellow-green dashed line with SSL · EQL label
Magnet Above — the BSL pool when it is above current price — the upside delivery target
Magnet Below — the SSL pool when below current price — the downside delivery target
SWEEP STATE
Sweep Window — live sweep state: "SSL 2b ago" when within the reclaim window, "BSL 3b ago" for BSL sweeps, or — IDLE when no recent sweep is active. This is the critical pre-signal awareness row — when it shows an active sweep state, Setup B entries are monitoring for the reclaim
SETUPS
Long Setup — the currently active long setup type: SWEEP, RECLAIM, ABSORB, FVG, or — when none is active
Short Setup — the currently active short setup type
FILTERS
HTF Bias — ▲ BULL, ▼ BEAR, or — FLAT. Soft confluence layer for scoring
Chop Index — live Choppiness Index value. Orange when above the block threshold — the only hard filter in MAGNET
CONFLUENCE
Bull / Bear — live scores displayed as "x / y" with a ▲ or ▼ arrow when either score meets the minimum threshold
Playbook — the current actionable state: LONG A, SHORT A, LONG B, SHORT B when a signal just fired; WATCH RECLAIM ▲ or ▼ during active sweep windows; WATCH MAGNETS when pools are defined but no active sweep
━━━━━━━━━━━━━━━━━━━━━━━━━━━━━━━━━━━━━━━━
📈 Chart Visual System
BSL Pool Line (red dashed) — the active buy-side liquidity level with "BSL · EQH" label extending to the right. Redrawn on the last bar to reflect the current pool state
SSL Pool Line (yellow-green dashed) — the active sell-side liquidity level with "SSL · EQL" label
▲ Large Triangle (below bar, yellow-green) — Grade A long signal. SSL sweep or delayed reclaim with qualifying confluence
▲ Small Triangle (below bar, dim yellow-green) — Grade B long signal. Absorption pin or FVG magnet setup
▼ Large Triangle (above bar, red) — Grade A short signal
▼ Small Triangle (above bar, dim red) — Grade B short signal
● Sweep Circles (optional, orange) — appear above (BSL sweep) or below (SSL sweep) the bar when a sweep event is detected. Off by default — sweeps are tracked internally regardless of marker visibility
SL Guide (red dotted circles) — sweep-anchored stop loss below or above the pool level
TP Guide (yellow-green dotted circles) — opposing magnet target or R-multiple fallback
Live confluence label — B x · S x near the current price on the last bar, updating in real time
━━━━━━━━━━━━━━━━━━━━━━━━━━━━━━━━━━━━━━━━
🚀 How to Trade with AlphaX MAGNET — Step by Step
Step 1 — Read the Liquidity Map
Check the dashboard BSL and SSL rows. These are the current institutional targets — price will be drawn toward both levels over time. Note which is closer to current price
Check Magnet Above and Magnet Below. These are your directional delivery destinations. If SSL is below and BSL is above, the market is sandwiched between two magnets — the next major move will likely target one of them
Note the Chop Index. When it is approaching or above the threshold (65), the liquidity pool targets lose reliability — pools become harder to reach when the market is oscillating without direction
Step 2 — Monitor the Sweep Window
The Sweep Window row is the most critical pre-signal dashboard row. "SSL 1b ago" means an SSL sweep just occurred one bar ago and the reclaim window is wide open — Setup B is actively scanning the next bars for a qualifying reclaim candle
WATCH RECLAIM ▲ in the Playbook row is the highest-priority alert state. Prepare your entry parameters immediately — the delayed reclaim may fire on the very next qualifying bar
Watch the chart for the reclaim candle forming at or above the swept SSL level with a bullish rejection body
Step 3 — Enter on the MAGNET Signal
A large ▲ triangle (Grade A) confirms a sweep or delayed reclaim with qualifying confluence. This is the primary MAGNET entry
A small ▲ triangle (Grade B) confirms an absorption or FVG setup. Valid entry with slightly lower setup-type evidence — manage with smaller size if preferred
The SL guide is plotted below the swept level plus ATR buffer. Your structural invalidation
The TP guide points to the opposing BSL magnet when available — the institutional delivery target. When this lines up with the opposing pool, you have a magnet-to-magnet trade with a clear institutional narrative
Step 4 — Manage the Trade
Monitor the Sweep Window — if a new sweep of the opposing pool occurs while you are in a trade, it may be a signal that the delivery is completing or extending
When price approaches the MAGNET ABOVE level (for long trades), consider taking partial profit — the opposing pool is the target but also potential new resistance
If a new valid sweep of your entry SSL occurs in the opposite direction during the trade, this could indicate the SSL was not the final sweep — reassess the position
━━━━━━━━━━━━━━━━━━━━━━━━━━━━━━━━━━━━━━━━
⚠ Identifying Low-Quality Conditions — When Not to Trade
Stand aside when:
Chop Index above threshold — this is the only hard filter in MAGNET. All signals are blocked. More importantly, in extreme chop, liquidity pools are being tested repeatedly without producing clean sweeps and reversals — the institutional dynamic is absent
BSL and SSL are very close to each other — when the two magnets are tightly compressed around current price, the market is ranging within a narrow liquidity cluster. Sweeps in this environment frequently continue through multiple levels rather than reversing at the first pool
Sweep Window shows IDLE for an extended period — no sweeps means no primary setup type is available. Only absorption and FVG setups (Grade B) can fire. If you prefer primary setups only, wait for a sweep to register
HTF Bias strongly opposes the signal — while HTF is a soft confluence layer in MAGNET, a strongly opposing HTF reduces the score by 1 point. In these conditions, a Grade B signal at the minimum threshold becomes marginal — consider requiring a higher score for counter-HTF entries
Grade B signals with minimum score (5/9) in a non-trending market — absorption pins and FVG overlaps require more supporting confluence to be reliable in Balance or transitional markets. When Grade B fires at exactly the minimum score without HTF support, reduce size or skip
Multiple consecutive sweeps of the same level without recovery — when price sweeps the SSL three times in succession, each time recovering only partially before sweeping again, the level is being absorbed in stages by a larger institutional seller rather than being swept for a reversal. Do not continue entering on each successive sweep
The ideal MAGNET setup:
Clear, well-aged SSL or BSL pool with multiple touches (3+ pivots or EQ touches)
Clean, decisive sweep below SSL with a single strong bar
1–3 bar consolidation below the swept level (confirming trapped shorts)
Delayed reclaim candle forming at the swept level with bull trigger confirmation
RSI below 38 at the sweep low (exhaustion bonus point)
Volume spike on the reclaim bar
HTF aligned bullish
Opposing BSL pool clearly defined above — the magnet-to-magnet trade
Score at 8–9/9
━━━━━━━━━━━━━━━━━━━━━━━━━━━━━━━━━━━━━━━━
⚡ Key Features
💧 Hybrid dual-method pool detection — pivot cluster analysis (weighted average clustering with touch count and age requirements) combined with Equal High/Equal Low range scanning (touch count across lookback window)
🎯 Active pool selection logic — nearest qualified pool to current price is selected as the active target, ensuring the most immediately relevant liquidity level is always the reference
⚡ Dedicated sweep state machine — sweeps are detected and stored independently from entry logic, enabling delayed reclaim entries 1–8 bars after the sweep event with full state persistence
🛡 Cascade block (same-bar only) — waterfall continuation bars are blocked from triggering same-bar sweep entries while preserving all delayed reclaim opportunities
🏷 Four setup types with grade classification — Setup A (same-bar sweep reclaim), Setup B (delayed reclaim), Setup C (absorption pin), Setup D (FVG liquidity overlap), each graded A or B by primary/secondary classification
📊 Weighted confluence scoring — primary setups count 2 points, secondary count 1, with 7 additional quality layers scoring independently. Quality through combination, not suppression
🔴 RSI exhaustion bonus — extra confluence point when RSI is genuinely exhausted at the sweep level, rewarding the highest-quality reversal conditions
📡 HTF bias as soft layer — higher timeframe alignment adds to the score but does not hard-block counter-HTF entries, reflecting the institutional reality that sweep reversals frequently work counter to the prevailing HTF trend
🎯 Opposing magnet TP system — take profit automatically targets the opposing liquidity pool when available, providing an institutionally justified delivery destination rather than an arbitrary ATR multiple
📍 Sweep-anchored SL placement — stop loss anchored to the swept pool level plus buffer, not an arbitrary ATR distance from entry
💹 Live Sweep Window tracking — dashboard shows active sweep state with bars elapsed since sweep, providing pre-signal awareness before the delayed reclaim fires
📊 Live Playbook row — displays WATCH RECLAIM ▲/▼ during active sweep windows, preparing you for the imminent Setup B signal
📊 17-row live dashboard — Liquidity, Sweep State, Setups, Filters, and Confluence sections updated in real time
🔔 4 alert conditions — long/short entries and SSL/BSL sweep events
🎨 Fully cohesive dual-tone color system — yellow-green for SSL/SSL-related bull elements, red for BSL/BSL-related bear elements, orange for sweep markers and alerts
⚙ Fully configurable — pivot length, EQH/EQL lookback, pool tolerance, touch minimums, pool age, sweep depth, reclaim window, signal body minimum, all four setup enables, confluence minimum, HTF timeframe and EMAs, chop threshold, volume filter, session, SL buffer, TP mode and R-multiple, and all colors are independently adjustable
━━━━━━━━━━━━━━━━━━━━━━━━━━━━━━━━━━━━━━━━
⚙ Settings Reference
Liquidity Pool Engine
Pivot Length — fractal sensitivity for pivot high/low detection (default: 5 bars each side)
EQH/EQL Scan Lookback — bars used for the Equal High/Equal Low range scan (default: 40)
Pool Tolerance (xATR) — ATR multiple defining the zone width around a pool level (default: 0.14)
Min Pivot Touches — minimum pivot cluster touches for a pivot pool to qualify (default: 2)
Min EQ Touches — minimum near-touches for an EQH/EQL level to qualify (default: 2)
Min Pool Age (bars) — minimum bars since first pivot detection before the pool is active (default: 3)
ATR Length — ATR calculation lookback (default: 14)
Sweep & Reclaim
Min Sweep Depth (xATR) — minimum extension beyond the pool for a sweep to register (default: 0.10)
Reclaim Window (bars after sweep) — how many bars after a sweep a delayed reclaim can fire (default: 8)
Min Signal Body (xATR) — minimum candle body size for all entry triggers (default: 0.22)
Show Sweep Markers — toggle optional orange circle markers at sweep detection bars (default: off)
Entry Setups
A · SSL Sweep + Reclaim / A · BSL Sweep + Reclaim — toggle same-bar sweep entries
B · Delayed SSL Reclaim / B · Delayed BSL Reclaim — toggle delayed reclaim entries
C · SSL Absorption Pin / C · BSL Absorption Pin — toggle absorption pin bar entries
D · FVG + SSL Magnet / D · FVG + BSL Magnet — toggle FVG-liquidity overlap entries
Min Confluence Score — minimum weighted score required for a signal (default: 5)
Show Entry Signals — toggle signal triangles
Show Confluence Label — toggle the live B/S score label near the current price
Signal Cooldown (bars) — minimum bars between consecutive signals (default: 5)
Grade Signals (A / B) — when on, primary setups show as large triangles, secondary as small triangles
Filters
HTF Bias Layer — adds 1 confluence point when HTF agrees (does not hard-block counter-trend)
HTF Timeframe / HTF Fast / Slow EMA — higher timeframe parameters (defaults: 60-minute / 21 / 55)
Block Extreme Chop — when on, Choppiness Index above threshold blocks all signals (the only hard filter)
Choppiness Length / Chop Block Above — CI parameters (defaults: 14 / 65.0)
Volume Layer — adds 1 confluence point when volume exceeds threshold
Volume Spike Threshold / Volume Avg Length — volume parameters (defaults: 1.05 / 20)
Session Filter / Active Session — trading hours restriction (default: off)
Structure EMA — EMA used for the structural bias confluence layer (default: 21)
Exit Guidance
Show SL / TP Guides — toggle stop and target dotted circle plots
SL Beyond Sweep (xATR) — ATR buffer beyond the swept pool level for stop placement (default: 1.0)
TP at Opposing Magnet — when on, TP targets the opposing active liquidity pool (default: on)
TP Reward (R) if no magnet — fallback R-multiple target when no opposing pool is available (default: 2.5)
Display
Show Liquidity Pool Lines — toggle BSL and SSL dashed reference lines
Show Dashboard — toggle the full dashboard
Dashboard Position — Top Left / Top Right / Bottom Left / Bottom Right
Colors
Bull / Bull Bright — yellow-green family for all bullish signals and SSL elements
Bear / Bear Bright — red family for all bearish signals and BSL elements
Sweep / Alert — orange for sweep markers and active alert states
BSL Pool (EQH) / SSL Pool (EQL) — individual pool line colors
SL Guide / TP Guide — stop and target circle colors
Dash Text / Dash BG / Dash Header / Dash Section / Dash Frame — full dashboard color control
━━━━━━━━━━━━━━━━━━━━━━━━━━━━━━━━━━━━━━━━
🔔 Alert Conditions (4 total)
Entry Alerts
Magnet Long — all conditions confirmed. Long signal fired across any qualifying setup type
Magnet Short — all conditions confirmed. Short signal fired
Sweep Alerts
Magnet SSL Swept — sell-side liquidity pool has been swept. Watch for reclaim within the configured window — Setup B is now monitoring
Magnet BSL Swept — buy-side liquidity pool has been swept. Watch for reclaim — Setup B monitoring active
All alert messages are formatted as const strings for clean webhook and notification platform integration.
━━━━━━━━━━━━━━━━━━━━━━━━━━━━━━━━━━━━━━━━
🎯 Recommended Settings by Instrument & Timeframe
The default configuration is optimized for XAUUSD, major forex pairs, and crypto on M5–M15 :
Pivot Length at 5 — standard fractal sensitivity for intraday instruments. Captures meaningful swing points without over-sensitivity to micro-noise
EQL Lookback at 40 — approximately 3–4 hours on M5, covering the relevant intraday Equal High/Low structure
Pool Tolerance at 0.14× ATR — tight enough to require genuine proximity to the pool level without missing valid touches due to spread variation
Reclaim Window at 8 bars — on M5 this is 40 minutes, sufficient to capture post-sweep consolidation and delayed reversal entries
HTF at 60-minute as soft layer — adds score for alignment without blocking the counter-HTF sweeps that are often the most powerful entries
For other instruments or timeframes, adjust:
M1–M3 scalping — reduce Pivot Length to 3, reduce Pool Tolerance to 0.10, reduce Reclaim Window to 4–5 bars, reduce Cooldown to 3, increase Min Sweep Depth to 0.15 for tighter scalp sweeps
H1–H4 swing trading — increase EQL Lookback to 80–100, increase Pivot Length to 7–8, increase Reclaim Window to 12–15, increase TP Reward to 3.5–5.0R for wider swing targets
Crypto (BTC, ETH) — increase Pool Tolerance to 0.18–0.22 for the wider tick structure, increase Min Sweep Depth to 0.15–0.20, increase Chop Block to 68–70 for crypto's naturally higher choppiness
Indices (NAS100, US30) — use session filter for cash market hours, increase Pool Tolerance slightly to 0.16, consider reducing EQL Lookback to 25–30 for the shorter-lived Equal High/Low structures in index futures
More primary setups (A and B) — reduce Reclaim Window minimum expectation by ensuring both Setup A and B are enabled, and watch the Sweep Window row actively rather than waiting for signals
Grade A signals only — disable Setup C (absorption) and Setup D (FVG), raise Min Confluence to 6. Only sweep and delayed reclaim entries with strong supporting factors will fire
━━━━━━━━━━━━━━━━━━━━━━━━━━━━━━━━━━━━━━━━
👥 Who This Is For
💧 Liquidity sweep traders and stop-hunt entry specialists — MAGNET is the most complete and technically sophisticated liquidity sweep system in the AlphaX suite. Every component — pool detection, sweep state machine, cascade blocking, delayed reclaim, magnet TP — is designed specifically for the institutional stop-hunt-and-reverse pattern
🏦 Smart money concepts and ICT methodology traders — the SSL/BSL, EQH/EQL, and sweep-reclaim framework directly implements the core ICT liquidity concepts with quantitative precision
🥇 Gold (XAUUSD) and forex traders — liquidity sweeps are most consistent and most powerful on institutional instruments where market makers actively hunt stops. Default settings are calibrated for gold intraday
🎯 Traders who want the highest-quality post-sweep entries — the delayed reclaim (Setup B) is the system's most powerful setup type and is specifically designed for traders who have experienced the frustration of missing same-bar sweep reversals only to watch price surge without them
🧠 Systematic traders who want quantified liquidity analysis — the hybrid pool detection, weighted scoring, and sweep state machine replace entirely subjective liquidity level identification with objective, repeatable criteria
📈 Traders who struggle with stop placement on liquidity entries — the sweep-anchored stop placement and opposing magnet TP provide the most structurally appropriate risk parameters available for liquidity-based trading
⚠ Traders who have been stopped out by cascading waterfall bars — the cascade block on same-bar entries and the delayed reclaim system together prevent the most common failure mode of liquidity trading: entering during a genuine continuation move rather than a reversal
━━━━━━━━━━━━━━━━━━━━━━━━━━━━━━━━━━━━━━━━
📝 Notes
All signals are confirmed on bar close — the indicator is non-repainting by design. Pool states, sweep state machine, setup conditions, and confluence scoring all finalize on confirmed bars only
The pivot cluster averaging system means that as new pivots near the same level form, the pool level gradually adjusts toward the weighted average. This means the active pool level may shift slightly over time as new evidence accumulates — this is intentional and produces more accurate pool level estimates than using only the first or last pivot
The cascade block applies only to the same-bar sweep entry (Setup A). Delayed reclaim entries (Setup B) are never blocked by cascade conditions — this is by design, as the cascade's resolution in subsequent bars is precisely the entry condition for Setup B
The delayed reclaim window starts from 1 bar after the sweep (barsSinceSslSweep >= 1). Same-bar reclaims are handled exclusively by Setup A. There is no overlap between the two setup types
When useMagnetTp is on and no opposing magnet is currently active (the opposing pool has not qualified or has been swept/invalidated), the system falls back automatically to the R-multiple TP without any gap in functionality
The Choppiness Index is the only hard filter in MAGNET. All other filters (HTF, volume, structural bias) are soft confluence layers that add or do not add to the score. This reflects the intentional philosophy that quality through combination is superior to quality through suppression
Maximum 500 labels and 500 lines are rendered. Pool lines are redrawn on the last bar, so they do not accumulate over history
The indicator does not track open positions or P&L and does not connect to any broker or account
━━━━━━━━━━━━━━━━━━━━━━━━━━━━━━━━━━━━━━━━
⚠ Disclaimer
This indicator is a technical analysis and visualization tool intended for educational and informational purposes only. It does not constitute financial advice or a recommendation to buy or sell any financial instrument. All signals are generated from historical and real-time price data using mathematical calculations — their accuracy or profitability is not guaranteed. Past performance of any signal type does not guarantee future results. Always conduct your own analysis, use proper risk management, and consult a licensed financial advisor before making any trading decisions. The author accepts no responsibility for any losses incurred from the use of this indicator.
━━━━━━━━━━━━━━━━━━━━━━━━━━━━━━━━━━━━━━━━
Built for traders who understand that price does not move randomly — it moves with purpose, toward the liquidity that institutions need, and away from it once that liquidity has been consumed. Indikator

Indikator
Indikator

SMT Sniper Entry Engine [trade_w_samet]🎯 SMT Sniper Entry Engine
SMT Sniper Entry Engine is a structured correlated-market divergence and confirmation indicator designed to help traders study liquidity sweeps, SMT divergence, reclaim quality, pair correlation, external-range location, displacement, Fair Value Gap evidence, micro-structure confirmation, and permanent bar-close UP or DOWN signals through one coordinated workflow.
The script is built around one central idea:
An SMT divergence should not automatically become an entry signal.
Instead of treating every difference between two correlated markets as equally meaningful, the engine first identifies a one-market liquidity sweep, then evaluates reclaim behavior, ATR-normalized sweep depth, candle direction, rejection quality, range expansion, pair correlation, external-range location, and divergence separation before the SMT event is accepted.
A qualified SMT event still does not create an immediate final signal.
The accepted SMT event arms a temporary confirmation sequence.
The engine then waits for directional displacement, a confirmed break of the SMT candle, and the additional evidence required by the active Engine Preset before a permanent UP or DOWN label is printed.
The indicator includes:
• Automatic comparison-symbol selection for supported metals, indices, cryptocurrencies, forex majors, and common forex crosses
• Manual comparison-symbol mode
• Same-timeframe comparison-market data
• Closed-bar rolling liquidity references
• Current-bar-close SMT divergence detection
• Either-market sweep acceptance
• Same-bar liquidity reclaim validation
• ATR-normalized sweep-depth measurement
• Chart-candle direction filtering
• Rejection-close filtering
• Minimum range-expansion filtering
• Separate bullish and bearish 0–100 Base Quality Scores
• Log-return pair-correlation analysis
• External-range location filtering
• ATR-normalized divergence-separation analysis
• Separate bullish and bearish 0–100 Sniper Scores
• Standard, Sniper, and Elite Engine Presets
• A temporary eight-bar confirmation window
• Sequential evidence accumulation across separate closed candles
• Directional displacement confirmation
• SMT-candle break confirmation
• Fair Value Gap confirmation
• Micro-structure break confirmation
• ATR-buffered setup invalidation
• Setup expiration
• Directional SMT cooldown
• Final signal cooldown
• One final UP or DOWN signal per completed SMT sequence
• Minimal historical SMT markers
• Dotted historical SMT reference lines
• Blue UP and orange DOWN labels
• Adjustable UP / DOWN label size
• Signal-confirming FVG boxes
• Recent-only chart-object
• A premium bottom-right dashboard
• Static TradingView alert conditions
• Combined dynamic alert() support
• “Any alert() function call” compatibility
• Data Window diagnostics
• Confirmed-close permanent signals
• No pivot functions
• No future-bar confirmation
• No historical signal backplotting
The purpose of this script is to provide a structured way to study when a correlated-market divergence is supported by sufficient liquidity, correlation, location, reaction, and confirmation evidence.
It is not financial advice.
It is not an automated trading system.
It does not guarantee profitable trades.
It does not execute broker orders.
It does not calculate position size.
It does not include a built-in TP / SL trade-management engine.
It does not provide verified win-rate or profitability statistics.
It does not replace independent analysis, execution planning, or risk management.
━━━━━━━━━━━━━━━━━━━━━━
📌 OVERVIEW
━━━━━━━━━━━━━━━━━━━━━━
At a high level, SMT Sniper Entry Engine does the following:
• Selects a comparison market automatically or manually.
• Requests the comparison market’s open, high, low, close, and ATR data on the chart timeframe.
• Builds rolling liquidity references from already completed candles.
• Checks whether only one market swept its corresponding liquidity reference.
• Requires the sweeping market to reclaim the reference on the same completed candle.
• Measures sweep depth relative to ATR.
• Evaluates chart-candle direction.
• Evaluates the candle’s closing position.
• Evaluates minimum range expansion relative to ATR.
• Produces separate bullish and bearish 0–100 Base Quality Scores.
• Measures the relationship between chart and comparison-market returns.
• Evaluates whether bullish SMT appears near the lower portion of the external range.
• Evaluates whether bearish SMT appears near the upper portion of the external range.
• Measures how clearly the non-sweeping market held its own liquidity reference.
• Produces separate bullish and bearish 0–100 Sniper Scores.
• Applies Standard, Sniper, or Elite acceptance thresholds.
• Confirms a qualified SMT event only after the current candle closes.
• Arms a temporary sequential confirmation window.
• Accumulates displacement, SMT-candle break, FVG, and structure evidence.
• Invalidates the setup if price closes beyond the SMT extreme by the stored ATR buffer.
• Expires the setup when confirmation does not arrive inside the available window.
• Applies final signal cooldown protection.
• Prints a permanent blue UP or orange DOWN label only after every required condition is confirmed.
• Optionally draws the FVG associated with the final signal.
• Displays current engine state, comparison symbol, correlation, active score, and signal counts in the dashboard.
• Provides separate static alert conditions.
• Provides one combined dynamic final-signal alert workflow.
• Exposes internal diagnostic values through TradingView’s Data Window.
The indicator does not use machine-learning prediction.
Its scores are not probabilities.
Its signal counts are not wins and losses.
Its labels do not promise future direction.
The script is a rule-based educational framework that explains how a raw correlated-market divergence becomes an accepted, rejected, invalidated, expired, or finally confirmed setup.
━━━━━━━━━━━━━━━━━━━━━━
🧠 CORE IDEA
━━━━━━━━━━━━━━━━━━━━━━
The core idea behind SMT Sniper Entry Engine is that two markets with a meaningful positive relationship do not always take corresponding liquidity at the same time.
When one market trades beyond a prior liquidity reference while the other market holds its own reference, the difference can create an SMT divergence.
However, the divergence alone contains limited information.
A basic SMT event does not automatically explain:
• whether the sweep was meaningful relative to volatility
• whether the sweeping market reclaimed the reference
• whether the chart candle closed with directional rejection
• whether the candle range expanded enough to matter
• whether the selected markets remain sufficiently correlated
• whether the event occurred near a useful external-range location
• whether the non-sweeping market clearly held its own level
• whether price produced directional displacement afterward
• whether the SMT candle was actually broken
• whether an FVG or micro-structure break confirmed the reaction
• whether the setup remained valid during the confirmation window
• whether another recent final signal is still inside the cooldown period
The engine therefore uses a staged sequence:
comparison-market selection
→ closed-bar liquidity references
→ one-market sweep
→ same-bar reclaim
→ Base Quality Score
→ pair-correlation validation
→ external-range location
→ divergence-separation validation
→ Sniper Score
→ confirmed SMT event
→ temporary setup arming
→ sequential reaction evidence
→ invalidation or expiration control
→ permanent UP or DOWN signal
For bullish conditions, the engine studies prior-low liquidity, bullish rejection, lower external-range location, directional displacement, a close above the SMT candle high, and bullish confirmation evidence.
For bearish conditions, the same process is mirrored around prior highs.
The purpose is not to produce the largest possible number of signals.
The purpose is to make the acceptance process selective, visible, and understandable.
━━━━━━━━━━━━━━━━━━━━━━
🧩 WHY THIS SCRIPT IS NOT A SIMPLE BUY/SELL INDICATOR
━━━━━━━━━━━━━━━━━━━━━━
SMT Sniper Entry Engine is not designed to be used as a blind signal generator.
A raw correlated-market divergence must move through multiple stages:
One market sweeps liquidity
→ the comparison market does not make the same sweep
→ the sweeping market reclaims its reference
→ sweep depth is evaluated
→ chart-candle direction is checked
→ rejection-close quality is checked
→ range expansion is checked
→ the Base Quality Score is calculated
→ pair correlation is checked
→ external-range location is checked
→ divergence separation is checked
→ the Sniper Score is calculated
→ the SMT event is accepted
→ the confirmation window opens
→ directional displacement is accumulated
→ the SMT candle must be broken
→ FVG and/or micro-structure evidence is accumulated
→ the setup must avoid invalidation
→ the setup must confirm before expiration
→ the final UP or DOWN label appears
Each module serves a different purpose.
The comparison engine defines the external market used for SMT analysis.
The liquidity engine identifies the one-market sweep.
The reclaim engine checks whether the liquidity event closed back inside the reference.
The Base Quality Score evaluates the completed SMT candle.
The Sniper Context Engine evaluates correlation, location, separation, and sweep quality.
The sequential confirmation engine evaluates what price does after the SMT event.
The invalidation and expiration controls remove setups that no longer satisfy the intended sequence.
The dashboard explains the current engine state.
This makes the script a coordinated SMT-confirmation workflow rather than a simple divergence marker.
━━━━━━━━━━━━━━━━━━━━━━
⚙️ HOW THE SCRIPT WORKS
━━━━━━━━━━━━━━━━━━━━━━
The script operates through connected calculation stages.
First, the engine selects a comparison symbol.
Auto mode uses the built-in symbol matrix.
Manual mode uses the symbol selected by the user.
The comparison market is requested on the same timeframe as the chart.
= request.security(
comparisonSymbol,
timeframe.period,
,
gaps = barmerge.gaps_off,
lookahead = barmerge.lookahead_off,
ignore_invalid_symbol = true)
The request uses lookahead_off.
The engine then calculates rolling chart and comparison-market liquidity references while excluding the current candle.
float chartPriorLow = ta.lowest(low , referenceLookback)
float chartPriorHigh = ta.highest(high , referenceLookback)
float comparisonPriorLow = ta.lowest(comparisonLow , referenceLookback)
float comparisonPriorHigh = ta.highest(comparisonHigh , referenceLookback)
The default reference lookback is 12 bars.
A bullish divergence is possible when one market sweeps a prior low and the other market does not.
A bearish divergence is possible when one market sweeps a prior high and the other market does not.
The sweeping market must reclaim the level on the same completed candle.
The candidate is then evaluated through:
• ATR-normalized sweep depth
• chart-candle direction
• close location
• range expansion
• Base Quality Score
• pair correlation
• external-range location
• divergence separation
• Sniper Score
• directional cooldown
When the SMT event is accepted, the engine stores:
• setup direction
• SMT bar
• SMT extreme
• SMT reaction trigger
• current ATR
• Base Quality Score
• Sniper Score
• sequential evidence states
• first confirmed FVG coordinates
The engine then monitors the next closed candles.
A final signal is accepted only when the active preset’s required evidence is present and the setup has not invalidated or expired.
━━━━━━━━━━━━━━━━━━━━━━
🟢 BULLISH SMT LOGIC
━━━━━━━━━━━━━━━━━━━━━━
A bullish SMT candidate begins at prior lows.
The engine checks the chart symbol and comparison market together.
A bullish sweep divergence exists when either:
• the chart symbol trades below its prior low while the comparison market does not trade below its corresponding prior low
• the comparison market trades below its prior low while the chart symbol does not trade below its corresponding prior low
The engine accepts a sweep from either market.
The sweeping market must reclaim the prior-low reference when reclaim validation is active.
The completed chart candle must also satisfy the active quality requirements.
The default Sniper profile evaluates:
• sufficient ATR-normalized sweep depth
• bullish chart-candle direction
• a close in the stronger portion of the candle
• minimum candle-range expansion
• minimum Base Quality Score
• minimum positive pair correlation
• location near the lower portion of the external range
• minimum divergence separation
• minimum Sniper Score
• directional SMT cooldown availability
bool bullishSmtEvent =
bullishRawSmtCandidate and
bullishSniperPass and
bullishCooldownPass
When the bullish SMT event is confirmed, the engine stores:
• the SMT low as the bullish invalidation extreme
• the SMT high as the bullish reaction-break trigger
• the current ATR
• the current Base Quality Score
• the current Sniper Score
The confirmation sequence then waits for:
• bullish displacement
• a close above the SMT candle high
• FVG and/or micro-structure evidence according to the active preset
The bullish SMT marker is context.
The final blue UP label is the completed signal.
━━━━━━━━━━━━━━━━━━━━━━
🔴 BEARISH SMT LOGIC
━━━━━━━━━━━━━━━━━━━━━━
A bearish SMT candidate begins at prior highs.
A bearish sweep divergence exists when either:
• the chart symbol trades above its prior high while the comparison market does not trade above its corresponding prior high
• the comparison market trades above its prior high while the chart symbol does not trade above its corresponding prior high
The sweeping market must reclaim the prior-high reference when reclaim validation is active.
The completed chart candle must also satisfy the active quality requirements.
The default Sniper profile evaluates:
• sufficient ATR-normalized sweep depth
• bearish chart-candle direction
• a close in the weaker portion of the candle
• minimum candle-range expansion
• minimum Base Quality Score
• minimum positive pair correlation
• location near the upper portion of the external range
• minimum divergence separation
• minimum Sniper Score
• directional SMT cooldown availability
When the bearish SMT event is confirmed, the engine stores:
• the SMT high as the bearish invalidation extreme
• the SMT low as the bearish reaction-break trigger
• the current ATR
• the current Base Quality Score
• the current Sniper Score
The confirmation sequence then waits for:
• bearish displacement
• a close below the SMT candle low
• FVG and/or micro-structure evidence according to the active preset
The bearish SMT marker is context.
The final orange DOWN label is the completed signal.
━━━━━━━━━━━━━━━━━━━━━━
💎 SMT QUALITY FILTER SYSTEM
━━━━━━━━━━━━━━━━━━━━━━
The script calculates separate bullish and bearish Base Quality Scores.
The score evaluates the completed SMT candle and its underlying liquidity event.
Each score is limited to 0–100.
The components are:
Sweep Role — maximum 25 points
The event must contain a valid one-market liquidity sweep.
Only one market should take the corresponding prior high or prior low.
Reclaim — maximum 20 points
The sweeping market must close back inside its prior liquidity reference.
Sweep Depth — maximum 20 points
The distance beyond the reference is measured relative to the corresponding market’s ATR.
Chart Candle Direction — maximum 15 points
Bullish SMT prefers a bullish chart candle.
Bearish SMT prefers a bearish chart candle.
Rejection Close — maximum 10 points
Bullish SMT prefers the chart close toward the high of the candle.
Bearish SMT prefers the chart close toward the low.
Range Expansion — maximum 10 points
The chart candle’s total range is compared with chart ATR.
The total score structure is:
25 + 20 + 20 + 15 + 10 + 10 = 100 points.
Preset-dependent minimum Base Quality Scores are:
• Standard: 60
• Sniper: 75
• Elite: 85
The Base Quality Score is not a win rate.
It is not a probability.
It measures how closely the completed SMT event matches the engine’s liquidity and candle-quality framework.
━━━━━━━━━━━━━━━━━━━━━━
📏 VOLATILITY / ATR NORMALIZATION FILTER
━━━━━━━━━━━━━━━━━━━━━━
The indicator uses ATR normalization to compare distances across changing volatility conditions.
ATR normalization is applied to:
• chart-side sweep depth
• comparison-side sweep depth
• divergence separation
• displacement body size
• setup invalidation buffer
• chart-candle range expansion
Sweep depth is calculated in relation to the ATR of the market that performed the sweep.
For example:
Chart Sweep Depth = distance beyond chart reference / chart ATR.
Comparison Sweep Depth = distance beyond comparison reference / comparison ATR.
Preset-dependent minimum sweep depth is:
• Standard: 0.04 ATR
• Sniper: 0.10 ATR
• Elite: 0.18 ATR
The chart candle must also meet a minimum range-to-ATR requirement:
• Standard: 0.40 ATR
• Sniper: 0.60 ATR
• Elite: 0.85 ATR
The setup invalidation buffer is based on the ATR stored when the SMT event occurs.
The default buffer is 0.10 ATR beyond the SMT extreme.
ATR normalization helps reduce dependence on raw price units.
It does not make one configuration universal.
Different symbols, sessions, data feeds, and market conditions can still produce different behavior.
━━━━━━━━━━━━━━━━━━━━━━
🕯️ DISPLACEMENT QUALITY FILTER
━━━━━━━━━━━━━━━━━━━━━━
After an SMT event is accepted, the engine requires directional displacement before a final signal can appear.
A bullish displacement candle requires:
• a confirmed closed candle
• close above open
• body size of at least 0.45 ATR
• body-to-range ratio of at least 0.55
• upper wick no greater than 0.35 of the full candle range
A bearish displacement candle requires:
• a confirmed closed candle
• close below open
• body size of at least 0.45 ATR
• body-to-range ratio of at least 0.55
• lower wick no greater than 0.35 of the full candle range
bool bullishDisplacement =
barstate.isconfirmed and
close > open and
signalCandleBody >= chartAtr * displacementBodyAtr and
signalBodyRatio >= displacementBodyPercent and
bullishOppositeWickRatio <= maximumOppositeWickPercent and
bullishPreviousBreakPass
The bearish process is mirrored.
The previous-bar break option is disabled in the locked default engine.
The more important directional reaction requirement is the SMT-candle break.
Displacement confirms that the market produced a completed directional response after the SMT event.
It does not guarantee continuation.
━━━━━━━━━━━━━━━━━━━━━━
📊 REACTION STRENGTH FILTER
━━━━━━━━━━━━━━━━━━━━━━
The engine does not require every confirmation component to appear on the same candle.
Instead, reaction evidence can accumulate across separate closed candles inside the temporary confirmation window.
The engine tracks:
• displacement
• SMT-candle break
• Fair Value Gap
• micro-structure break
Bullish SMT-candle break:
• price must close above the stored SMT candle high
Bearish SMT-candle break:
• price must close below the stored SMT candle low
Bullish FVG:
• current low is above the high from two bars earlier
Bearish FVG:
• current high is below the low from two bars earlier
Bullish micro-structure break:
• current close exceeds the highest high from the previous five closed bars
Bearish micro-structure break:
• current close falls below the lowest low from the previous five closed bars
Evidence is persistent while the setup remains active.
For example:
SMT event
→ displacement appears
→ FVG appears later
→ structure break appears on another candle
→ final signal confirms
The active Engine Preset determines which accumulated evidence is required.
━━━━━━━━━━━━━━━━━━━━━━
🧼 CONFIRMED SIGNAL FILTER
━━━━━━━━━━━━━━━━━━━━━━
Permanent SMT events and final UP / DOWN labels wait for candle close.
The engine uses confirmed-bar checks for:
• raw SMT candidates
• final SMT acceptance
• displacement
• FVG detection
• micro-structure breaks
• setup invalidation
• final UP signals
• final DOWN signals
The comparison-market request uses lookahead_off.
Rolling liquidity references exclude the current candle.
No future candle is used to decide whether the current candle contains an SMT event.
No final signal is plotted back onto the original SMT candle after later evidence becomes available.
The confirmation opportunity is temporary.
The default window is eight bars.
The minimum delay is one bar after the SMT event.
If the active evidence does not complete in time, the setup expires.
Historical output can still change when:
• Engine Preset changes
• comparison symbol changes
• Auto or Manual mode changes
• chart symbol changes
• timeframe changes
• exchange or broker feed changes
• historical data is revised
• the loaded history range changes
Confirmed-close logic prevents unfinished-candle conditions from becoming permanent chart signals.
It does not mean all brokers or data feeds will produce identical historical output.
━━━━━━━━━━━━━━━━━━━━━━
🎯 ENTRY MODEL
━━━━━━━━━━━━━━━━━━━━━━
SMT Sniper Entry Engine uses a confirmed-signal entry model rather than a built-in broker-order model.
A final directional setup is created only when:
• a qualified SMT event exists
• the confirmation window is open
• the setup has not invalidated
• all preset-required evidence has been accumulated
• final signal cooldown is available
• the current candle is confirmed
The final signal reference is the close of the candle where the UP or DOWN label is printed.
For an UP setup:
• the label appears below the confirmed signal candle
• the signal represents completed bullish SMT confirmation
For a DOWN setup:
• the label appears above the confirmed signal candle
• the signal represents completed bearish SMT confirmation
The script does not automatically calculate:
• an entry line
• a stop-loss level
• take-profit targets
• position size
• account risk
• broker quantity
• trade outcome
The final signal-bar close can be used as an analytical reference.
It is not a guaranteed fill.
Users must define their own execution, invalidation, stop, target, and risk model.
━━━━━━━━━━━━━━━━━━━━━━
🔗 COMPARISON MARKET MODEL
━━━━━━━━━━━━━━━━━━━━━━
The indicator supports Auto and Manual comparison-symbol modes.
Auto mode recognizes common ticker text and assigns a predefined positively related market.
Built-in mappings include:
Metals
• XAU or GOLD → OANDA:XAGUSD
• XAG or SILVER → OANDA:XAUUSD
Indices
• NAS, US100, USTEC, NDX, or NQ → OANDA:SPX500USD
• SPX, US500, SP500, or ES → OANDA:NAS100USD
• US30, DJI, DOW, or YM → OANDA:SPX500USD
Cryptocurrencies
• BTC → BINANCE:ETHUSDT
• ETH → BINANCE:BTCUSDT
Forex majors
• EURUSD ↔ GBPUSD
• AUDUSD ↔ NZDUSD
• USDCAD ↔ USDCHF
• USDJPY → CADJPY
JPY crosses
• EURJPY ↔ GBPJPY
• AUDJPY ↔ NZDJPY
• CADJPY → USDJPY
• CHFJPY → EURJPY
EUR and GBP crosses
• EURAUD ↔ GBPAUD
• EURNZD ↔ GBPNZD
• EURCAD ↔ GBPCAD
• EURCHF ↔ GBPCHF
• EURGBP → GBPUSD
AUD and NZD crosses
• AUDCAD ↔ NZDCAD
• AUDCHF ↔ NZDCHF
• AUDNZD → NZDUSD
Auto mode is based on ticker-name recognition.
Broker symbols can include prefixes, suffixes, futures contract codes, or synthetic names that are not recognized by the built-in matrix.
When the chart symbol is not recognized, the engine can fall back to the Manual Comparison Symbol value.
The dashboard should therefore be checked before relying on Auto mode.
Manual mode allows the user to select the comparison market directly.
The current engine is designed for positively correlated relationships.
Selecting an inversely related market can make the correlation and SMT logic unsuitable.
━━━━━━━━━━━━━━━━━━━━━━
🎯 SNIPER SCORE MODEL
━━━━━━━━━━━━━━━━━━━━━━
The engine produces separate bullish and bearish Sniper Scores.
The Sniper Score evaluates broader context around the SMT event.
The maximum score is 100.
The structure is:
Base SMT Quality — maximum 35 points
The 0–100 Base Quality Score contributes 35% of its value.
Pair Correlation — maximum 25 points
Positive effective correlation contributes proportionally.
External-Range Location — maximum 20 points
Bullish SMT receives this component when it occurs below the active maximum bullish range position.
Bearish SMT receives this component when it occurs above the active minimum bearish range position.
Divergence Separation — maximum 10 points
The event receives this component when the non-sweeping market holds its reference by at least the required ATR-normalized distance.
Sweep Depth — maximum 10 points
A valid minimum sweep receives five points.
A sweep at least 1.5 times the minimum depth receives ten points.
Minimum accepted Sniper Scores are:
• Standard: 60
• Sniper: 78
• Elite: 88
Minimum positive pair correlation is:
• Standard: 0.35
• Sniper: 0.55
• Elite: 0.70
External-range requirements are:
Bullish maximum position
• Standard: 0.45
• Sniper: 0.33
• Elite: 0.25
Bearish minimum position
• Standard: 0.55
• Sniper: 0.67
• Elite: 0.75
Minimum divergence separation is:
• Standard: 0.00 ATR
• Sniper: 0.03 ATR
• Elite: 0.08 ATR
The Sniper Score is not a probability.
A score of 88 does not mean an 88% probability of success.
It measures rule-based confluence according to this script’s internal framework.
━━━━━━━━━━━━━━━━━━━━━━
📦 ACTIVE SMT / FVG VISUAL SYSTEM
━━━━━━━━━━━━━━━━━━━━━━
The script separates SMT context from final signal confirmation.
Historical SMT visuals can include:
• a dotted line from the prior chart-side liquidity reference to the SMT candle
• a minimal bullish or bearish marker near the SMT event
The default historical visual system keeps recent objects only.
The default limits are:
• eight bullish SMT lines
• eight bullish SMT markers
• eight bearish SMT lines
• eight bearish SMT markers
• ten final signal labels
• six signal FVG boxes
Older visual objects can be removed when the corresponding recent-only limit is exceeded.
This is chart-object management.
It does not move a signal to another candle.
Final signal visuals include:
UP
• blue label
• white bold-italic text
• printed below the confirmed signal candle
DOWN
• orange label
• white bold-italic text
• printed above the confirmed signal candle
Signal FVG Box
• appears only when stored FVG evidence exists
• uses the FVG that participated in the active confirmation sequence
• extends 12 bars to the right
• uses a lightly shaded bullish or bearish fill
The FVG box is an analytical confirmation visual.
It is not a guaranteed support, resistance, entry, stop, or target zone.
━━━━━━━━━━━━━━━━━━━━━━
🚦 ONE ACTIVE SMT SETUP AT A TIME
━━━━━━━━━━━━━━━━━━━━━━
The script maintains one active pending SMT confirmation sequence at a time.
When a qualified bullish SMT event appears:
• the active setup direction becomes bullish
• the bullish SMT extreme and trigger are stored
• the evidence state is reset
When a qualified bearish SMT event appears:
• the active setup direction becomes bearish
• the bearish SMT extreme and trigger are stored
• the evidence state is reset
A newly accepted SMT event can therefore replace the currently stored pending setup state.
The active setup remains in memory until:
• the final UP signal confirms
• the final DOWN signal confirms
• the setup invalidates
• the setup expires
• another accepted SMT event overwrites the pending state
This design prevents multiple overlapping confirmation sequences from creating an unclear chart state.
It does not prevent the user from performing independent analysis on other markets or timeframes.
━━━━━━━━━━━━━━━━━━━━━━
⚠️ SEQUENTIAL CONFIRMATION WINDOW HANDLING
━━━━━━━━━━━━━━━━━━━━━━
The default confirmation window is eight bars.
The final signal cannot appear on the original SMT candle because the minimum bars after SMT is one.
The engine monitors each completed candle inside the window.
Evidence can be accumulated in different orders.
For example:
SMT
→ displacement
→ SMT-candle break
→ FVG
→ final signal
or:
SMT
→ FVG
→ displacement
→ SMT-candle break
→ structure break
→ final signal
Preset behavior:
Standard
Uses Reactive confirmation.
Requires:
• displacement
• SMT-candle break
Sniper
Uses Confirmed confirmation.
Requires:
• displacement
• SMT-candle break
• FVG or micro-structure break
Elite
Uses Elite confirmation.
Requires:
• displacement
• SMT-candle break
• FVG
• micro-structure break
The engine does not use the historical high-low sequence inside a candle to simulate order execution.
It evaluates whether each closed candle satisfied a defined piece of evidence.
If the setup does not complete inside the window, it expires.
━━━━━━━━━━━━━━━━━━━━━━
🏷️ SMT SNIPER LABELS
━━━━━━━━━━━━━━━━━━━━━━
The indicator uses separate context and final-signal labels.
SMT Context Markers
The default SMT marker layout is Minimal.
Bullish SMT uses an upward marker.
Bearish SMT uses a downward marker.
The marker appears on the actual SMT confirmation candle.
Its tooltip can include:
• bullish or bearish SMT direction
• Sniper Score
• Base Quality Score
• effective pair correlation
• active comparison symbol
Final Signal Labels
The final labels display:
𝙐𝙋
or:
𝘿𝙊𝙒𝙉
UP uses a blue background.
DOWN uses an orange background.
The text is white.
Available final-label sizes are:
• Tiny
• Small
• Normal
• Large
• Huge
Normal is the default.
The UP tooltip can include:
• bullish SMT confirmation mode
• final stored Sniper Score
• final stored Base Quality Score
The DOWN tooltip contains the mirrored information.
The SMT marker and final signal label serve different purposes.
The SMT marker identifies the qualified correlated-market divergence.
The UP or DOWN label identifies the completed sequential confirmation.
━━━━━━━━━━━━━━━━━━━━━━
📍 SMT DISPLAY MODES
━━━━━━━━━━━━━━━━━━━━━━
The indicator operates directly on the main price chart.
The public Display settings provide control over:
Show SMT
Shows or hides historical SMT markers and reference lines.
Show UP / DOWN
Shows or hides final signal labels.
UP / DOWN Label Size
Controls the size of final UP and DOWN labels.
Show Signal FVG
Shows or hides the stored FVG box associated with a final signal.
Show Dashboard
Shows or hides the premium bottom-right dashboard.
The internal visual profile uses:
• Clean layout
• Recent Only historical display
• dotted SMT reference lines
• minimal SMT markers
• normal SMT marker size
• limited historical object counts
• no separate displacement circles by default
Input values are hidden from TradingView’s status line.
Diagnostic plots remain available in the Data Window without adding visible price-scale clutter.
━━━━━━━━━━━━━━━━━━━━━━
🧹 SETUP INVALIDATION
━━━━━━━━━━━━━━━━━━━━━━
Not every accepted SMT event remains eligible.
A bullish setup invalidates when a completed candle closes below:
SMT low − stored SMT ATR × 0.10.
A bearish setup invalidates when a completed candle closes above:
SMT high + stored SMT ATR × 0.10.
The ATR value is stored when the SMT event appears.
This keeps the invalidation buffer linked to the volatility present when the setup was created.
A setup can also fail to produce a final signal because:
• the confirmation window expires
• displacement never appears
• the SMT candle is not broken
• required FVG evidence does not appear
• required structure evidence does not appear
• the final signal cooldown is active
• a newly accepted SMT event replaces the pending state
The directional SMT cooldown is 15 bars.
The final signal cooldown is eight bars.
A rejected, invalidated, or expired pending sequence does not print a final UP or DOWN label.
━━━━━━━━━━━━━━━━━━━━━━
📟 DASHBOARD
━━━━━━━━━━━━━━━━━━━━━━
The indicator includes a premium dashboard in the bottom-right corner of the chart.
The header displays:
trade_w_samet • SMT SNIPER
Current State
Possible states include:
• SCANNING MARKET
• BULLISH SMT DETECTED
• BEARISH SMT DETECTED
• BULLISH SETUP BUILDING
• BEARISH SETUP BUILDING
• UP SIGNAL CONFIRMED
• DOWN SIGNAL CONFIRMED
Comparison
Displays the active comparison symbol.
Correlation
Displays the current effective pair correlation.
Engine
Displays:
• STANDARD
• SNIPER
• ELITE
Pair Mode
Displays:
• AUTO
• MANUAL
Signal Score
When a relevant setup is active, the dashboard displays:
current Sniper Score / required Sniper Score.
When no setup is active, it displays:
NO ACTIVE SETUP.
UP / DOWN Counts
Displays the number of final confirmed UP and DOWN signals calculated on the loaded chart history.
Footer
Displays:
• BAR-CLOSE
• NON-REPAINT
• LIVE
The dashboard is not TradingView Strategy Tester.
It does not display:
• win rate
• profit factor
• expectancy
• drawdown
• net profit
• broker-verified results
UP and DOWN counts are signal counts only.
“LIVE” means the dashboard updates with the latest available script state.
It does not mean the script predicts unfinished intrabar outcomes.
━━━━━━━━━━━━━━━━━━━━━━
🚨 ALERT SYSTEM
━━━━━━━━━━━━━━━━━━━━━━
SMT Sniper Entry Engine includes static TradingView alert conditions for:
• Bullish SMT
• Bearish SMT
• UP
• DOWN
• Any Signal
• Any SMT
Bullish SMT
Triggers when a bullish SMT event passes the complete Base Quality and Sniper acceptance process.
Bearish SMT
Triggers when a bearish SMT event passes the mirrored acceptance process.
UP
Triggers when the bullish sequential confirmation process is complete.
DOWN
Triggers when the bearish sequential confirmation process is complete.
Any Signal
Combines final UP and DOWN conditions.
Any SMT
Combines bullish and bearish SMT conditions.
The script also includes dynamic alert() messages for final UP and DOWN signals.
Dynamic messages can include:
• product name
• direction
• chart ticker
• chart timeframe
• confirmed close price
• active comparison symbol
if enableAlerts
if buySignal
alert(
"SMT Sniper | UP | " +
syminfo.ticker +
" | " +
timeframe.period +
" | Close: " +
str.tostring(close, format.mintick) +
" | Comparison: " +
comparisonSymbol,
alert.freq_once_per_bar_close)
The DOWN dynamic message uses the mirrored format.
Dynamic final-signal alerts use once-per-bar-close frequency.
Alerts are monitoring tools.
They do not place, modify, or close broker orders.
━━━━━━━━━━━━━━━━━━━━━━
🔔 HOW TO USE ALERTS
━━━━━━━━━━━━━━━━━━━━━━
For separate static conditions:
1. Add SMT Sniper Entry Engine to the chart.
2. Open TradingView’s Create Alert window.
3. Select SMT Sniper as the condition.
4. Choose Bullish SMT, Bearish SMT, UP, DOWN, Any Signal, or Any SMT.
5. Select the desired notification method.
6. Use a confirmed-bar frequency where appropriate.
7. Test the alert before relying on it.
For one combined dynamic final-signal alert:
1. Enable Alerts in the indicator settings.
2. Open TradingView’s Create Alert window.
3. Select SMT Sniper.
4. Select Any alert() function call.
5. Configure the delivery method.
6. Test the UP and DOWN message format.
The combined dynamic alert sends final UP and DOWN events through one TradingView alert.
Static Any Signal also combines UP and DOWN conditions, but uses the static alertcondition() message.
When indicator settings, code, symbol, or timeframe are materially changed, an already-created TradingView alert can continue using the script snapshot stored when that alert was created.
Recreate alerts after important configuration changes.
Alert delivery can depend on:
• TradingView servers
• selected symbol
• selected timeframe
• market-data availability
• realtime feed status
• symbol session
• user alert configuration
• webhook or external-service availability
Creating an alert does not guarantee broker execution.
━━━━━━━━━━━━━━━━━━━━━━
🧪 HOW TO USE THE INDICATOR
━━━━━━━━━━━━━━━━━━━━━━
A practical workflow:
1. Add SMT Sniper Entry Engine to a standard candlestick chart.
2. Begin with Engine Preset set to Sniper.
3. Keep Comparison Symbol Mode on Auto for supported symbols.
4. Review the Comparison field in the dashboard.
5. If the automatic market is not appropriate, switch to Manual.
6. Select a positively related comparison market.
7. Keep Show SMT enabled while learning the setup sequence.
8. Observe the historical liquidity reference line.
9. Observe the minimal SMT marker.
10. Treat the SMT marker as context, not as the final signal.
11. Watch the dashboard state.
12. Wait for a blue UP or orange DOWN label.
13. Review the active Sniper Score and required threshold.
14. Review the correlation value.
15. Review the signal FVG box when one is available.
16. Use alerts for monitoring rather than blind execution.
17. Evaluate broader market structure independently.
18. Review session conditions, volatility, spread, and news risk.
19. Define personal entry, invalidation, stop, target, and position-size rules.
20. Test the exact symbol, timeframe, exchange, broker feed, and comparison pair personally used.
The indicator is designed for structured review.
It should not be treated as an automatic decision-maker.
━━━━━━━━━━━━━━━━━━━━━━
⚙️ SETTINGS REFERENCE
━━━━━━━━━━━━━━━━━━━━━━
The public settings menu is intentionally simplified.
Advanced thresholds remain locked inside the engine to reduce configuration clutter and preserve consistent preset behavior.
⚙️ Engine
Engine Preset
Selects:
• Standard
• Sniper
• Elite
Standard
Produces more accepted setups.
Uses Balanced Base Quality, Standard Sniper thresholds, and Reactive confirmation.
Sniper
The default profile.
Uses Strict Base Quality, Sniper context thresholds, and Confirmed evidence requirements.
Elite
The most selective profile.
Uses Elite Base Quality, Elite context thresholds, and the strictest sequential evidence requirement.
A stricter preset does not guarantee better trading results.
━━━━━━━━━━━━━━━━━━━━━━
🔗 Comparison Market
Comparison Symbol Mode
Auto
Uses the internal ticker-recognition matrix.
Manual
Uses the selected Manual Comparison Symbol.
Manual Comparison Symbol
Selects the external market used by the SMT engine.
This field is active only when Comparison Symbol Mode is Manual.
Use a positively related comparison market.
━━━━━━━━━━━━━━━━━━━━━━
🎨 Display
Show SMT
Shows or hides historical SMT reference lines and markers.
Show UP / DOWN
Shows or hides final signal labels.
UP / DOWN Label Size
Selects:
• Tiny
• Small
• Normal
• Large
• Huge
Normal is the default.
Show Signal FVG
Shows or hides the stored FVG box associated with a final signal.
Show Dashboard
Shows or hides the bottom-right premium dashboard.
━━━━━━━━━━━━━━━━━━━━━━
🔔 Alerts
Enable Alerts
Enables the script’s static alert conditions and dynamic alert() calls.
For one combined runtime UP / DOWN alert, create the TradingView alert using:
Any alert() function call.
All public input values use hidden status-line display.
Diagnostic values remain available through TradingView’s Data Window.
━━━━━━━━━━━━━━━━━━━━━━
🧠 WHAT MAKES THIS SCRIPT ORIGINAL
━━━━━━━━━━━━━━━━━━━━━━
SMT divergence, liquidity sweeps, correlation, ATR, Fair Value Gaps, and structure breaks are familiar technical-analysis concepts.
These concepts are not unique by themselves.
The originality of SMT Sniper Entry Engine lies in the coordinated process applied to them:
automatic comparison-market selection
→ closed-bar rolling liquidity references
→ one-market liquidity sweep
→ same-bar reclaim
→ ATR-normalized Base Quality Score
→ log-return pair correlation
→ external-range location
→ ATR-normalized divergence separation
→ 0–100 Sniper Score
→ preset-driven SMT acceptance
→ temporary sequential confirmation
→ displacement evidence
→ SMT-candle break
→ FVG and micro-structure evidence
→ ATR-buffered invalidation
→ setup expiration
→ permanent UP or DOWN signal
→ recent-only visual management
→ static and dynamic alerts
→ premium diagnostic dashboard
Distinctive implementation features include:
• accepting a valid sweep from either market
• using rolling closed-bar references instead of pivot confirmation
• separating the SMT event from the final signal
• calculating separate Base Quality and Sniper Scores
• requiring positive pair correlation according to preset
• using preset-specific external-range thresholds
• measuring divergence separation relative to ATR
• accumulating confirmation evidence across separate candles
• storing the SMT candle as the reaction trigger
• storing ATR at the moment the setup is armed
• using different confirmation strictness for Standard, Sniper, and Elite
• limiting historical objects without relocating signals
• providing automatic comparison-market assistance with manual override
• supporting both static and combined dynamic alerts
• exposing detailed diagnostics through the Data Window
The script is not a simple combination of unrelated indicators.
Every module supports the same objective: determining whether a closed-bar SMT divergence has enough liquidity, correlation, location, reaction, and confirmation evidence to become a permanent final signal.
━━━━━━━━━━━━━━━━━━━━━━
⚠️ IMPORTANT PRACTICAL NOTES
━━━━━━━━━━━━━━━━━━━━━━
Signal frequency depends on:
• Engine Preset
• chart symbol
• comparison symbol
• ticker naming
• timeframe
• session
• volatility
• pair correlation
• liquidity-reference structure
• sweep depth
• chart-candle quality
• external-range location
• divergence separation
• directional cooldown
• post-SMT displacement
• SMT-candle break
• FVG evidence
• micro-structure evidence
• final signal cooldown
• available history
• data provider
Standard can produce more setups.
Elite can produce substantially fewer setups.
Fewer signals do not guarantee better results.
The built-in Auto matrix uses predefined OANDA and BINANCE symbols.
The chart symbol can come from another broker or exchange.
Different feeds can produce:
• different highs and lows
• different candle closes
• different ATR values
• different liquidity sweeps
• different correlation readings
• different final signals
Manual mode can be used when comparison-feed consistency is important.
The current engine expects a positive relationship.
An inversely related comparison market should not be selected.
The dashboard’s UP and DOWN values are signal counts.
They are not wins and losses.
The Signal Score is a confluence score.
It is not historical accuracy.
The SMT marker is not the final signal.
The final UP or DOWN label appears after post-SMT confirmation.
Changing settings recalculates historical conditions.
Changing the comparison market can materially change the script’s output.
━━━━━━━━━━━━━━━━━━━━━━
⚠️ LIMITATIONS AND SHORTCOMINGS
━━━━━━━━━━━━━━━━━━━━━━
This script has important limitations:
It does not guarantee profitable trades.
It does not predict future price movement.
It does not execute orders.
It does not place broker stops.
It does not place take-profit orders.
It does not calculate position size.
It does not include spread.
It does not include commission.
It does not include slippage.
It does not include latency.
It does not model partial fills.
It does not model financing or swap.
It does not evaluate order-book conditions.
It does not evaluate news risk.
It uses bar-based OHLC data.
It does not reconstruct exact intrabar price sequence.
It assumes a positive comparison relationship.
Its automatic matrix cannot recognize every broker symbol.
Unsupported Auto symbols can use the Manual Comparison fallback.
Correlation can change over time.
A historically correlated pair can temporarily decouple.
A confirmed SMT divergence can fail.
A displacement candle can be followed by reversal.
An FVG can be filled immediately.
A micro-structure break can become a false break.
A high Base Quality Score can still fail.
A high Sniper Score can still fail.
The Signal Score is not a win probability.
The dashboard is not TradingView Strategy Tester.
Signal counts are not audited account performance.
The script does not provide verified profitability statistics.
The script does not provide broker-verified trade outcomes.
Alert delivery depends on TradingView and user configuration.
Changing settings changes historical calculations.
Changing symbol, exchange, session, timeframe, or feed can change signals.
Available history can affect rolling calculations.
Permanent final signals wait for candle close.
The final label can therefore appear later than a discretionary intrabar entry.
For these reasons, the indicator should be used as an educational decision-support tool, not as a standalone automated strategy.
━━━━━━━━━━━━━━━━━━━━━━
👤 WHO THIS SCRIPT MAY BE USEFUL FOR
━━━━━━━━━━━━━━━━━━━━━━
This script may be useful for traders who:
• understand basic SMT divergence
• compare positively related markets
• study liquidity sweeps and reclaims
• want more context than a raw SMT marker
• prefer confirmed-close signals
• want selective preset modes
• use displacement as confirmation
• use Fair Value Gap concepts
• use micro-structure breaks
• want automatic comparison-market assistance
• want a manual comparison override
• want transparent quality scoring
• want a compact public settings menu
• want a premium dashboard
• want separate SMT and final-signal alerts
• want one combined UP / DOWN dynamic alert
• want Data Window diagnostics
It may be less suitable for users who:
• want guaranteed signals
• want every raw SMT divergence displayed
• want a fully automated trading bot
• want built-in TP and SL management
• want verified Strategy Tester performance
• want inverse-correlation SMT analysis
• expect one comparison pair to work on every feed
• require tick-level execution modeling
• want signals before candle close
• expect a score to equal probability
• want the indicator to replace personal judgment
• expect alerts to execute broker orders automatically
━━━━━━━━━━━━━━━━━━━━━━
🧭 BEST PRACTICE SUGGESTIONS
━━━━━━━━━━━━━━━━━━━━━━
For the default selective profile:
• use standard candlesticks
• begin with Sniper preset
• keep Auto mode only when the dashboard comparison is appropriate
• use Manual mode for broker-specific comparison control
• select positively related markets
• keep Show SMT enabled while learning
• distinguish the SMT marker from the final signal
• wait for the final UP or DOWN label
• review the correlation value
• review the active Signal Score
• review external market structure independently
• consider session liquidity and volatility
• use personal stop placement
• use personal target planning
• use personal position sizing
• test alerts before depending on them
• test the exact symbol and timeframe personally used
For additional frequency:
• use Standard preset
Standard reduces:
• Base Quality requirements
• correlation requirements
• range-location restrictions
• divergence-separation requirements
• Sniper Score threshold
• final confirmation evidence
For additional selectivity:
• use Elite preset
Elite increases:
• minimum sweep depth
• rejection-close requirement
• minimum range expansion
• Base Quality threshold
• correlation threshold
• external-range restriction
• divergence-separation threshold
• Sniper Score threshold
• final evidence requirement
Always:
• wait for the candle to close
• verify the active comparison symbol
• use the SMT marker as context
• use the final signal as confirmation
• review broader structure independently
• review personal risk before any trade
• treat alerts as monitoring tools
• remember that every confirmed setup can fail
━━━━━━━━━━━━━━━━━━━━━━
🔓 PUBLICATION NOTE
━━━━━━━━━━━━━━━━━━━━━━
SMT Sniper Entry Engine is published as an educational correlated-market divergence and confirmation tool.
The purpose of this description is to explain:
• how the comparison market is selected
• how Auto and Manual modes differ
• which markets are included in the automatic comparison matrix
• how closed-bar liquidity references are calculated
• how a one-market sweep is identified
• how reclaim validation works
• how sweep depth is normalized by ATR
• how chart-candle direction and rejection quality are evaluated
• how the Base Quality Score is constructed
• how pair correlation is calculated and filtered
• how external-range location is evaluated
• how divergence separation is measured
• how the Sniper Score is constructed
• how Standard, Sniper, and Elite differ
• how a qualified SMT event arms the confirmation engine
• how the temporary confirmation window works
• how evidence is accumulated across separate closed candles
• how displacement is detected
• how the SMT-candle break is used
• how Fair Value Gap evidence is detected
• how micro-structure evidence is detected
• how setup invalidation works
• how setup expiration works
• when final UP and DOWN labels appear
• what the SMT markers and dotted reference lines represent
• what the signal FVG box represents
• what the dashboard displays
• what the static alerts contain
• how “Any alert() function call” works
• what diagnostic values are available in the Data Window
• how confirmed-close timing works
• what the engine does not simulate
• why familiar SMT concepts are organized into an original workflow
The script is designed to support structured analysis.
It does not promise profitable results.
It does not remove market risk.
It does not execute trades.
It does not calculate position size.
It does not provide a built-in TP / SL trade-management model.
It should not be used as a blind UP / DOWN system.
Repainting and Timing Disclosure
SMT Sniper Entry Engine is designed around confirmed-bar calculations.
Permanent SMT events and final UP / DOWN labels use barstate.isconfirmed.
The comparison-market request uses:
• barmerge.gaps_off
• barmerge.lookahead_off
Liquidity references use previous closed candles.
The current candle is excluded from the prior-reference calculation.
The script does not use:
• pivot-high functions
• pivot-low functions
• future-bar confirmation
• negative plot offsets
• historical signal backplotting
• later relocation of final signal labels
A final UP or DOWN signal appears on the candle where the complete confirmation sequence becomes valid.
It is not moved backward to the original SMT candle.
Historical drawing cleanup can delete older lines, markers, labels, or boxes when the recent-object limit is exceeded.
Deleting an old drawing is not repainting.
The original signal bar is not changed.
Historical results can still differ when:
• settings are changed
• comparison symbols are changed
• Auto or Manual mode is changed
• chart symbols are changed
• timeframes are changed
• broker or exchange feeds are changed
• historical data is revised
• available chart history is changed
Realtime behavior also depends on when TradingView receives the final data for the closing candle.
Confirmed-close design reduces unfinished-candle changes.
It does not eliminate market risk, data-feed differences, or alert-delivery limitations.
━━━━━━━━━━━━━━━━━━━━━━
🛡️ DISCLAIMER
━━━━━━━━━━━━━━━━━━━━━━
SMT Sniper Entry Engine is provided for educational and informational purposes only.
It does not constitute financial, investment, trading, legal, or tax advice.
No indicator can guarantee future results.
Markets are uncertain.
Correlation changes.
Liquidity changes.
Volatility changes.
Market structure changes.
Historical chart behavior does not ensure future performance.
Every user is responsible for their own:
• analysis
• validation
• comparison-market selection
• execution planning
• stop placement
• target planning
• position sizing
• risk management
• alert configuration
• trading decisions
• broker execution
• legal obligations
• tax obligations
The liquidity references, SMT markers, dotted lines, Base Quality Scores, Sniper Scores, correlation values, external-range filters, divergence-separation values, displacement conditions, Fair Value Gap boxes, micro-structure conditions, UP labels, DOWN labels, dashboard states, Data Window values, signal counts, and alerts are visual analysis tools only.
The SMT marker is not a guaranteed reversal.
The UP label is not a guaranteed profitable long trade.
The DOWN label is not a guaranteed profitable short trade.
The Signal Score is not a win probability.
The Base Quality Score is not a probability.
The correlation reading is not a guarantee that two markets will continue moving together.
The automatic comparison symbol is not guaranteed to be suitable for every broker feed.
The FVG box is not a guaranteed support or resistance zone.
The micro-structure break is not a guarantee of continuation.
The final signal-bar close is not a guaranteed fill.
The script does not include spread, commission, slippage, latency, financing, contract specifications, order rejection, partial fills, or broker-specific execution behavior.
Use this script as a structured SMT divergence-review and confirmation framework, not as a promise of profitability or a substitute for independent judgment.
Indikator
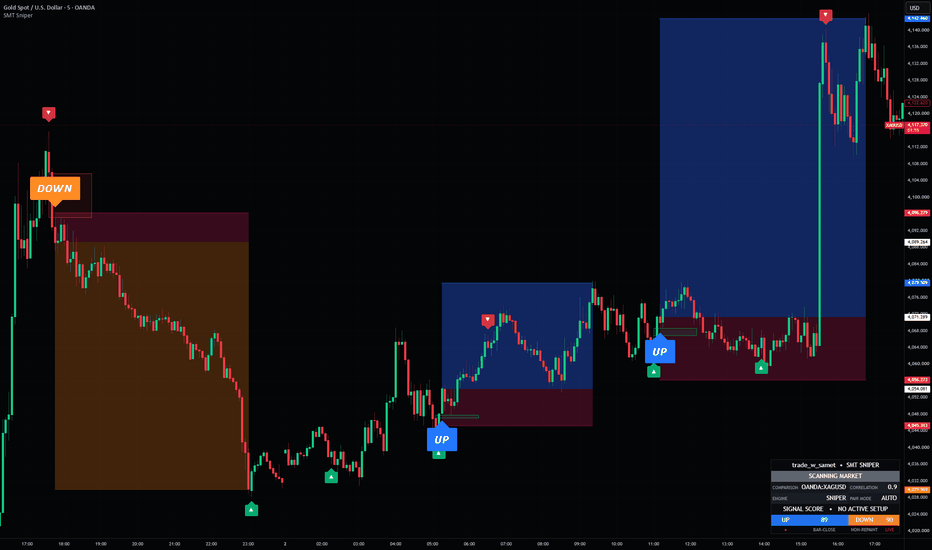
Distributional Shift Sentinel Wasserstein Regime MonitorDistributional-Shift Sentinel — Wasserstein Regime Monitor
Detects when the SHAPE of returns changes — not just the average or the variance. It claims a change, never a direction.
What it does
Most regime tools watch a moving average or a volatility band, so they only react to changes in LEVEL or SPREAD. But a market can keep the same mean and variance while its return distribution quietly changes shape — skew flips, tails fatten, the character of the auction turns. Those are the shifts that moment-based tools see late. This sentinel compares the recent return distribution against a reference window using the Wasserstein-1 ("earth-mover") distance — a metric sensitive to the whole shape — and raises a flag when the shape has moved unusually far.
How it works, and why these components together
This is a deliberate synthesis of three parts, each covering the previous one's weakness:
The Wasserstein-1 distance (optimal-transport statistics: Monge; Kantorovich). For one-dimensional data it is simply the average gap between the two windows' matched order-statistics: sort both return windows and average the absolute differences. Unlike KL/JS divergence it registers both the location and the magnitude of the difference, so a fattening tail or a skew flip shows up even when mean and variance are unchanged. Weakness it leaves open: the raw number is meaningless in isolation — "0.4" is not a shift.
A self-calibrated alarm. The distance is normalized by the reference dispersion (comparable across symbols) and ranked against its own recent history; a shift is flagged only when the reading is unusually large for this symbol and timeframe (percentile input). No fixed magic threshold. Weakness it leaves open: readings near the alarm line flicker.
A minimum-dwell announcement filter (the standard anti-chattering design from switched-systems control): SHIFT/STABLE is announced only after surviving a set number of confirmed bars. Cost: that many bars of lag — stated and adjustable.
When a shift fires, the dashboard decomposes it into what moved — location (median), scale (dispersion), shape (skew) — so the flag is informative, not just a light.
How to read it (all visuals)
Shift lane — the thin strip at the pane bottom: amber = distribution shifted, green = stable. Alert colors (change/normal), never direction. The one-glance read.
Dashboard — SHIFT/STABLE headline; shift rank; normalized distance; DRIVER (loc/scale/shape); STABILITY (% of the last 50 bars in the current state); PENDING (a forming state with countdown); windows and alarm settings.
HTF STACK — the raw shift state on three higher timeframes derived as multiples of the chart (defaults 3×, 5×, 15× — a 5m chart reads 15m/25m/75m automatically). ✓ = every timeframe agrees; ⚠ = a higher timeframe has shifted while the chart looks stable — a shape change above your resolution. Note: the deeper slots need many bars of their own timeframe (reference + calibration windows), so they warm up slowly on intraday charts; "—" for a while is correct.
SHIFT tags print on announced changes; a subtle background tint marks shifted spans.
How to use it
Treat a SHIFT as an early warning to widen stops, cut size, or re-evaluate any model or setup that assumed the old regime — not as a buy or sell. It pairs naturally with trend, structure, and fragility tools: they tell you what the regime is; this tells you when the regime's distributional character stopped being what it was. Alerts fire on shift start and shift end.
Non-repaint
Windows, the distance, the alarm, and all state announcements advance only on CONFIRMED bars; the live bar is provisional. Higher-timeframe requests use lookahead-off. No lower-timeframe data is used anywhere, so the script runs identically on every plan and symbol.
Use on any market
Price source, return type, window lengths, and the alarm percentile are all inputs; the metric is scale-relative (normalized by reference dispersion). Defaults suit liquid intraday index futures.
Originality & credits
The synthesis — sorted-sample Wasserstein-1 on a rolling chart window, dispersion normalization, self-calibrated percentile alarm, dwell-filtered state, driver decomposition, and the multi-timeframe stack — is original work for this publication. Concept credits: optimal transport / earth-mover distance — G. Monge, L. Kantorovich; Wasserstein two-sample comparison for change/drift detection — standard optimal-transport statistics literature. Implementation and charting design are the author's own.
Disclaimer
Research and education only. NOT financial advice, NOT a signal service, NOT a guarantee of future results. A detected shift is a descriptive statement about the past distribution on this chart; it does not predict direction or magnitude. Regimes change without warning. Validate independently and manage your own risk. Indikator

Ghost Zones GTI - Adaptive Demand & Supply Zones────────────────────
Adaptive Demand & Supply Zones (ADSZ)
━━━━━━━━━━━━━━━━━━━━━━━━━━━━━━━━━━
Automatically plots dynamic demand and supply zones on daily and weekly timeframes. Unlike static support/resistance levels, these zones adapt in real-time to market volatility using ATR (Average True Range) — expanding during volatile markets and contracting during calm periods.
Works universally on any instrument: Stocks, Indices, Crypto, Commodities, and Forex.
🔍 HOW IT WORKS
The indicator computes Effective Volatility from the annualized ATR percentage, then derives statistically-grounded zone levels:
● Strong Zones (Demand & Supply) — placed at ±1σ from the session open. These represent high-probability reversal areas where price is statistically likely to find strong support or resistance.
● Weak Zones — placed closer to the open at ±σ/(2√2). These act as early warning levels — initial reaction zones where price may pause or consolidate before continuing.
● Zone Width — scales proportionally with volatility using the golden ratio (φ = 1.618). Strong zones are wider than weak zones, reflecting higher conviction at extreme levels.
● Weekly Point of Control (WPOC) — a key weekly pivot level anchored to Monday's open.
The Math:
Effective Volatility = ATR Slope × Annualized ATR%
σ (sigma) = Price × EffVol / (100 × √252)
Strong zones: Open ± σ
Weak zones: Open ± σ/(2√2)
Strong width: σ/4
Weak width: σ/(4×φ)
📊 ZONE GUIDE
🟢 Strong Demand (Green) — High-probability buy zone, price stretched to the downside
🟩 Weak Demand (Lime) — Early demand area, potential bounce or consolidation
🟧 Weak Supply (Orange) — Early supply area, potential rejection or consolidation
🔴 Strong Supply (Red) — High-probability sell zone, price stretched to the upside
🟡 WPOC (Gold) — Weekly Point of Control, key weekly pivot
⚙️ SETTINGS
Daily Parameters: • Daily ATR Period (default: 20) — ATR lookback on daily bars (~1 trading month) • Daily ATR Slope (default: 0.69) — Multiplier for zone width. Higher = wider zones • Daily Intercept (default: 0.0) — Keep at 0 for best cross-regime stability
Weekly Parameters: • Weekly ATR Period (default: 5) — ATR lookback on weekly bars (~1 trading month) • Weekly ATR Slope (default: 0.68) — Multiplier for zone width. Higher = wider zones • Weekly Intercept (default: 0.0) — Keep at 0 for best cross-regime stability
💡 HOW TO USE
1. Intraday Trading — Use daily zones as key levels for entries, exits, and stop-loss placement. Strong zones offer the highest probability reversals.
2. Swing Trading — Combine daily and weekly zones. When a daily strong demand aligns with weekly demand, it creates a confluence zone — very high probability entry.
3. Risk Management — Zone boundaries provide natural stop-loss levels. Place stops just beyond the strong zone boundary.
4. Volatility Awareness — Watch how zones expand and contract. Wider zones signal higher expected moves — adjust position sizing accordingly.
5. WPOC — Price above WPOC suggests bullish bias, below suggests bearish.
🔧 TUNING FOR DIFFERENT INSTRUMENTS
Defaults optimized for Indian indices (Nifty 50). For other instruments: • Higher slope (0.72–0.80) → more volatile (small-caps, crypto) • Lower slope (0.60–0.68) → less volatile (large-cap US stocks, bonds)
✅ KEY FEATURES
● Universal — works on any instrument, no external data dependencies
● Adaptive — zones auto-scale with market volatility via ATR
● Dual Timeframe — daily and weekly zones plotted simultaneously
● Statistically Grounded — annualized volatility + golden ratio geometry
● Fully Customizable — all parameters adjustable in settings
● Clean Display — toggle individual components on/off
━━━━━━━━━━━━━━━━━━━━━━━━━━━━━━━━━━
Tip: For the cleanest chart, use on 5min or 15min timeframes with daily zones enabled, and use on 1-hr timeframe with weekly zones enabled
──────────────────── Indikator

Strategie

Triple Confluence Navigator [MarkitTick]💡 A highly sophisticated analytical framework designed to identify high-probability market setups by demanding alignment across three distinct dimensions of market data: momentum crossovers, adaptive volatility momentum tracking, and structural price action. Instead of relying on a single lagging variable, this system synthesizes traditional oscillators, advanced digital signal processing (such as Kalman filtering), and structural swing analysis. By integrating automated risk management, multi-take-profit targeting, and a real-time tracking dashboard, it operates as a comprehensive suite for systematic market analysis.
✨ Originality and Utility
● A Multi-Dimensional Consensus Model
Most standard technical tools assess the market through a single lens, such as pure price action or pure momentum. The originality of this system lies in its stringent confluence requirements. It isolates three independent mathematical models and requires all of them to agree within a user-defined chronological window. This significantly filters out market noise and reduces the frequency of false positive signals commonly associated with sideways or choppy conditions.
● Oscillatory Supertrend Application
While a Supertrend is traditionally overlaid on raw price action, this script innovates by calculating an Average True Range (ATR) directly on the Adaptive RSI (ARSI) oscillator. By establishing a Supertrend over momentum rather than price, the tool identifies the structural trend of the underlying momentum itself, offering a preemptive view of market shifts before they fully materialize in physical price movement.
● Dynamic Risk-Bounding
The utility is heavily elevated by its integrated risk management architecture. Rather than relying on static pip/tick stops, the system calculates dynamic risk parameters comparing structural pivot ranges against ATR-capped maximums. This ensures that the generated stop-loss levels are mathematically sound, adapting to prevailing market volatility while adhering to strict structural invalidation points.
🔬 Methodology and Concepts
• Pillar One: The Cardwell Momentum Averages
The first confluence pillar focuses on moving average crossovers applied to the Relative Strength Index (RSI). Instead of standard Simple Moving Averages, the system utilizes advanced smoothing algorithms—specifically Kalman Filters or Low Latency Adaptive Moving Averages (LLAMA). This separates the underlying momentum signal from high-frequency market noise, establishing a primary directional bias.
• Pillar Two: Adaptive RSI and Oscillator Supertrend
The second pillar generates an Adaptive RSI (ARSI), normalizing the absolute differences of price movement against historical highest highs and lowest lows. This adaptive data stream is then heavily filtered and paired with a momentum-based Supertrend. A crossover between the ARSI and its own moving/volatility band dictates the secondary momentum confirmation.
• Pillar Three: Market Structure and Swing Pivots
The third pillar grounds the mathematical momentum in tangible price action. The engine calculates precise pivot highs and pivot lows over a specified lookback period. A confirmed signal requires price to physically breach these structural swing levels, registering a Break of Structure (BoS) or a Change of Character (ChoCh).
• The Confluence Window and HTF Bias
Signals from these three pillars rarely occur on the exact same bar. The system tracks the bars elapsed since each respective signal. If all three pillars trigger in the same direction within the defined confluence window, a master setup is generated. Furthermore, an overarching Higher Timeframe (HTF) security check ensures that these local confluences do not contradict the macro directional trend.
🎨 Visual Guide
• On-Chart Trade Mapping
Entry Line: A dashed line indicating the exact closing price of the signal bar.
Stop Loss (SL) Line: A dashed line representing the structural or volatility-based invalidation point, labeled with an X.
Take Profit (TP) Lines: Three distinct dashed lines projecting the target levels based on the calculated risk multiplier.
• Signal Markers and Fills
Labels: Distinct textual markers reading BUY or SELL highlight the precise candle where the triple confluence is met.
Risk Zone: A translucent shaded area bridging the Entry line and the Stop Loss line, visualizing the total capital exposure.
Reward Zone: A differently colored translucent shading extending from the Entry to the final Take Profit (TP3) level.
• Real-Time Dashboard
The Heads-Up Display (HUD) is a table anchored to the chart corner. It outputs the live status of the Cardwell MA, Adaptive ARSI, and Structure modules. It includes dynamic visual bars indicating current RSI and ADX levels, displays the state of the HTF bias, and calculates the live floating risk-to-reward ratio of an active setup.
📖 How to Use
• Identifying Setups
Monitor the chart for the appearance of the signal labels. When a setup is validated, the system will immediately draft the Entry, SL, and TP lines on the chart. Assess the Risk Zone and Reward Zone visuals to ensure the potential setup aligns with your personal risk tolerance.
• Dashboard Monitoring
Use the dashboard to evaluate the health of the confluence. If the ADX visual bar is extremely low, it indicates market chop, suggesting that even a confluence signal might suffer from lack of follow-through. Monitor the structural trend state in the dashboard to understand the broader context of the immediate signal.
• Trade Management
The predefined TP1, TP2, and TP3 lines serve as partial profit-taking areas. As price achieves TP1, consider shifting risk to breakeven, utilizing the subsequent lines as trailing markers. The HUD's Live R metric tracks the real-time fractional gain or loss based on the initial risk unit.
⚙️ Inputs and Settings
• Momentum & Averages
RSI Len: Defines the lookback period for the base oscillator.
Fast/Slow Len: Defines the lookback for the moving averages applied to the oscillator.
Filter Type: Dropdown to select between standard RMA, recursive Kalman Filtering, or adaptive LLAMA.
• Adaptive Volatility
Kalman Process & Measurement Noise: Granular inputs adjusting the responsiveness and smoothness of the Kalman state estimation.
LLAMA Min/Max Alpha: Bounds for the dynamic efficiency ratio used in the adaptive moving average.
ST Factor: The volatility multiplier that determines the width of the ARSI Supertrend band.
• Structure & Trade Configuration
Swing Len: The number of bars required to confirm a structural high or low.
SL ATR Mult: The maximum allowable distance for a stop loss, based on True Range.
SL Struct Buffer: The fractional ATR distance placed beyond a swing pivot to prevent premature stop outs.
TP1/TP2/TP3 R:R: The dynamic risk multiples used to project the take profit levels.
Confluence Window: The maximum number of bars allowed to pass between the three distinct pillar signals for them to remain valid together.
🔍 Deconstruction of the Underlying Scientific and Academic Framework
• Recursive State Estimation (Kalman Filter)
The inclusion of a Kalman-inspired filter applies concepts from control theory and digital signal processing. Unlike simple averaging which inherently introduces phase lag, this algorithm estimates the true state of the momentum by predicting the next value and updating its estimation based on the actual measured value. By weighing the process noise against the measurement noise, the script aggressively smooths erratic momentum spikes while instantly snapping to genuine directional shifts.
• Adaptive Linear Regression (LLAMA)
The Low Latency Adaptive Moving Average applies statistical regression to determine the current market phase. It calculates the slope of the data over a set period and compares it to the absolute range of that period to derive an Efficiency Ratio. This ratio acts as a dynamic alpha coefficient. In highly efficient, directional markets, the alpha increases, forcing the average to tightly track the data. In inefficient, mean-reverting markets, the alpha decreases, flattening the average to ignore statistical noise.
• Statistical Variance and Orthogonal Agreement
By mandating a Triple Confluence, the system relies on the reduction of statistical variance. The three pillars—price structure, base momentum, and adaptive momentum bands—are mathematically orthogonal; they calculate market state using distinctly different algorithms. The probability of all three aligning purely by chance (random walk) is exceptionally low. Therefore, when confluence is achieved, it represents a statistically significant deviation from market equilibrium, highlighting a high-probability directional vector.
⚠️ Disclaimer
All provided scripts and indicators are strictly for educational exploration and must not be interpreted as financial advice or a recommendation to execute trades. We expressly disclaim all liability for any financial losses or damages that may result, directly or indirectly, from the reliance on or application of these tools. Market participation carries inherent risk where past performance never guarantees future returns, leaving all investment decisions and due diligence solely at your own discretion. Indikator
Demand Supply Zone MatrixDemand Supply Zone Matrix by DayTradeSetup
Demand Supply Zone Matrix is an automatic Demand & Supply Zone indicator designed to help traders identify important price areas more clearly without manually drawing every zone.
The system detects potential Supply and Demand zones based on market momentum, volume activity, and the strength of price movement. It also includes zone grading, touch tracking, mitigation reference levels, alerts, and a dashboard summary to help traders filter key zones more efficiently.
Key Features
• Automatic Demand & Supply Zones
Automatically detects potential Supply and Demand zones based on strong directional price movement.
• Strength Grade / Score
Each zone is graded with an A / B / C score to help traders evaluate the quality and strength of each zone more easily.
• 50% Mitigation Line
Displays the midpoint of each zone, which can be used as a reference area for mitigation, retest, or reaction analysis.
• Touch Counter
Tracks how many times price has returned to test a zone, helping traders identify whether a zone is still fresh or has already been tested.
• Zone Retest Alert
Sends an alert when price comes back to test an active Supply or Demand zone.
• Zone Break Alert
Sends an alert when a zone is invalidated or broken by price action.
• Dashboard Summary
Includes a dashboard showing Supply/Demand zone count, best grade, total volume, and overall market bias.
How to Use
This indicator is designed to be used as a technical analysis tool for identifying areas where buying or selling pressure may appear.
Suggested workflow:
1. Check whether Supply or Demand is currently dominant.
2. Focus on higher-grade zones such as A or B.
3. Wait for price to return and test the zone.
4. Use additional confirmation such as Price Action, Market Structure, Trend Direction, or Risk Management before entering a trade.
Suitable For
This indicator is suitable for traders who use concepts such as:
Demand & Supply
Smart Money Concepts
Price Action
Retest Zones
Momentum Trading
Intraday Trading
It can be applied to multiple markets, including XAUUSD, Forex, Crypto, Indices, and different timeframes depending on the trader’s strategy.
Disclaimer
This indicator is a technical analysis tool only. It is not a direct Buy/Sell signal and does not guarantee trading results. Traders should always combine it with their own trading plan, risk management, and additional confirmation before making any trading decisions.
Risk Warning: Trading involves risk. Please study and understand the risks carefully before making any investment or trading decision. Indikator

Adaptive Market Suite [Jayadev Rana]Overview
Adaptive Market Suite is a four-module analysis toolkit that draws on the price chart. Each module is independent: turn any of them on or off, and each has its own settings group. It shows context, not buy or sell arrows. The four modules are an adaptive trend, volatility bands, market structure with order blocks and fair-value gaps, and an order-flow oscillator. You read the confluence and make your own decisions.
Module 1 - Adaptive Trend and Regime
A moving average whose smoothing adapts to Kaufman's efficiency ratio: the net distance price travelled divided by the total path it took to get there. In clean trends the ratio is high and the average speeds up to hug price; in chop it is low and the average slows and flattens. The line is coloured by its slope, and the info panel reports whether the market is trending or ranging from the same ratio.
Module 2 - Expected-Move Bands
Volatility bands around the adaptive basis. Instead of a fixed multiple of range, the band width scales with where the current Average True Range sits in its own recent history (its percentile), so the bands contract in quiet conditions and expand when volatility rises. A nearer pair and a wider pair mark two envelopes.
Module 3 - Liquidity and Structure
Market structure from confirmed swing pivots, labelled as Break of Structure and Change of Character. Because the pivots are symmetric (confirmed on both sides), they are fixed before they are drawn and do not repaint afterward. On a structure break the tool marks the order block behind the move (the last opposite-direction candle before the push) and it tracks fair-value gaps, which are three-bar imbalances. Each zone follows a mitigation lifecycle: it is extended while it is live and greyed once price trades through it, and only the most recent zones per type are kept so the chart stays readable.
Module 4 - Order-Flow Oscillator
A normalised buy and sell pressure read in the indicator pane. For each bar it combines where price closed within the bar's range with how large that bar's volume was relative to its recent average. Sustained closes near the highs on strong volume push the oscillator positive; the mirror pushes it negative. An absorption marker highlights bars with heavy volume but a small range, where effort is not producing movement.
Info panel
An optional compact table summarises the current trend direction, the regime read, the volatility percentile, and the current order-flow side. It is context only.
Inputs
Inputs are grouped per module: General (ATR length); Module 1 (efficiency length, fast and slow smoothing, regime threshold, colours); Module 2 (volatility lookback, base and extra width, colour); Module 3 (swing length, order-block lookback, max zones per type, toggles for structure, order blocks and fair-value gaps, colours); Module 4 (pressure smoothing, absorption threshold, colours); plus an info-panel toggle. Every module has a single enable switch.
Alerts
Bullish and bearish structure break, and the order-flow oscillator crossing above or below zero.
How to use it
Treat it as a confluence map rather than a signal. For example, price reaching an order block near the lower band, with the order-flow oscillator turning up while the adaptive trend is still rising, is a stronger context than any one of those alone. Turn off the modules you do not need: if you only trade structure, disable the other three groups for a clean map. It is intended for liquid instruments and works across timeframes; the demonstration chart is Gold on the 1-hour timeframe.
Limitations
The structure module confirms swings with bars on both sides, so its labels and order blocks appear a fixed number of bars after the pivot forms. That delay is the trade-off that keeps them from repainting. The bands, the oscillator and the info panel read the current bar and update as it forms, like any live calculation. This is an analysis tool, not a strategy: it places no orders, makes no performance claim, and there is no win rate because it does not promise trades.
Disclaimer
For education and research only. This is not financial advice, and past chart behaviour does not predict future results. Test any approach yourself and manage your own risk. Indikator

Participation-Adjusted Momentum [TradeDots]Participation-Adjusted Momentum
Summary
This indicator computes a momentum oscillator that has been adjusted by participation quality . Raw momentum (standardized rate-of-change) is multiplied by a quality blend derived from volume percentile, close-location alignment within the bar, and range-per-volume efficiency. The intent is to differentiate strong momentum supported by participation from moves that look impressive on price alone but occur on thin volume or wide ranges with little net travel. The histogram is colored by one of five interpretable states (Strong Bull, Strong Bear, Thin, Quiet Accumulation, Noisy) so users see at a glance whether to trust a momentum reading.
What is original here
Momentum oscillators (rate-of-change, MACD, RSI) and volume oscillators (volume percentile, MFI) are widely available. This script's contribution is the deliberate combination into a single adjusted reading, plus the five-state classification that maps raw-momentum / participation combinations to labelled regimes. The "Quiet Accumulation" state (low momentum but rising volume percentile) and the "Thin" state (strong momentum but low participation) are specifically called out because they are the most actionable readings — both indicate that the price reading and the order-flow reading disagree, and that disagreement deserves a label.
How it works
Each bar, the following quantities are computed.
Raw momentum. Rate-of-change of close over a configurable length, then z-scored (subtract the mean, divide by the standard deviation) over the normalization lookback. The result is approximately bounded but can exceed plus or minus 3 in extreme moves.
EMA slope. A 50-period EMA's change over a configurable lookback, min-max normalized to 0-100. Used as a secondary directional bias (computed and exposed as a hidden plot, but not directly added to the displayed oscillator).
Volume percentile. Volume rank over the normalization lookback (typically 100 bars).
Close-location value. Where the close sits within the bar's high-low range, expressed as a percentage. For an upward-direction reading, a close near the bar's high indicates buyers won the bar; for a downward-direction reading, a close near the bar's low indicates sellers won.
Participation. Volume percentile (divided by 100) multiplied by direction-aligned close-location value (also normalized to 0-1). Result is in ; higher means "good participation".
Range per volume. Bar range divided by volume. High range per volume means a wide candle moved on thin flow — typical of news spikes, illiquid prints, or false moves. The percentile rank of range-per-volume is inverted (low range-per-volume gives a high "efficiency score") and used as a quality factor.
Quality blend. A weighted combination: 0.4 * participation + 0.4 * range_efficiency + 0.2. The +0.2 floor ensures that even with zero participation and zero efficiency, the adjusted momentum retains 20% of the raw signal so the oscillator does not flatline completely.
Adjusted momentum = raw momentum × quality blend.
State classification (mutually exclusive):
Strong Bull : raw momentum at or above +threshold and participation at or above 0.55
Strong Bear : raw momentum at or below −threshold and participation at or above 0.55
Thin : absolute raw momentum at or above threshold and participation below 0.35 — momentum without volume, a warning state
Quiet Accumulation : absolute raw momentum below the quiet threshold and volume percentile above the quiet-volume floor — flat price but rising participation
Noisy / Low Quality : the catch-all when none of the above apply
The histogram bar color reflects the current state.
Repainting and data integrity
All factors are computed on confirmed bar values; alerts are gated by barstate.isconfirmed. No request.security() calls are made — the script operates entirely on the chart timeframe.
How to read the chart
The primary plot is the adjusted-momentum histogram, colored by state.
A thin overlay line shows the same value with continuous color for easy zero-line reading.
Reference lines at zero and at ±1 standard deviation provide context for how extreme the current reading is.
Hidden plots expose raw momentum, participation, volume percentile, and direction so they are available in the Data Window.
The dashboard panel shows the current state in the header, then numeric readings for raw momentum (in z-units), adjusted momentum, volume percentile, participation, range efficiency, and the quality blend.
Inputs
Inputs are grouped into three sections.
Core Settings : ROC length, percentile / z-score lookback, EMA slope length, slope lookback bars, strong-momentum z-threshold, quiet-accumulation maximum z, quiet-accumulation minimum volume percentile.
Visual Settings : zero-line toggle, ±1σ band toggle, dashboard toggle, panel position and size, panel background color.
Any Alert() function call conditions : per-alert toggles.
Alerts
Four alert conditions are provided, each firing on the first bar the state is entered:
Strong Bull Momentum
Strong Bear Momentum
Quiet Accumulation Detected
Momentum Without Volume (the "Thin" warning state)
Each is declared via alertcondition() and is fired programmatically through alert() when the corresponding input toggle is enabled, with alert.freq_once_per_bar_close. Alert messages include {{ticker}} and {{interval}} placeholders.
How to use this script
This is a confirmation indicator. It does not generate entries on its own.
When considering an entry on price strength alone, check this indicator. A Strong Bull or Strong Bear state confirms that volume and close location support the move.
The "Thin" state is a warning. A breakout that prints during a Thin reading should be treated more cautiously than the same breakout during Strong Bull.
The Quiet Accumulation state can identify periods of base-building before a move and is useful as a "watchlist" signal.
Use alongside a setup-specific indicator for entry timing.
Limitations and honest caveats
Volume quality varies dramatically between markets. On crypto exchanges, wash-trading and bot-driven order flow can produce misleading volume percentile readings. Apply with awareness.
Z-score normalization requires the lookback to contain a representative variety of states. On instruments with strong regime changes, early-bar z-scores may be unreliable until the lookback fills.
The close-location alignment factor reads single-bar close behavior. On gappy markets or after market closes, the alignment may not reflect intraday order flow.
The script does not signal direction independently; it adjusts and labels momentum that is already present.
The +0.2 floor in the quality blend is a design choice to avoid flat-lining the oscillator. Users who want a strict "zero adjustment when participation is zero" reading can set the participation weights higher and adjust the floor by modifying the source code.
Disclaimer
This script is published for informational and educational purposes. It is not investment advice and is not a recommendation to buy or sell any instrument. Adjusted momentum is a descriptive measure, not a prediction of future price. Users are solely responsible for their own trading decisions and risk management.
Indikator

Indikator

GreenStar ATR% Extension MonitorGreenStar ATR% Extension Monitor
The GreenStar ATR% Extension Monitor answers two questions in one window:
1) How volatile is the name? (14-period ATR as a percent of price)
2) How far has price stretched from a moving average, in relation to historical data?
Some names routinely stretch to 10-12x before mean-reverting. Others rarely clear 5x.
Scroll back on a daily chart to see extension habits for that symbol.
Why extension matters
Dollar distance from a 50-day MA does not compare a $15 name to a $400 name.
Dividing percent gain from the MA by ATR% provides a multiple of normal daily range.
That is the blue xFromMA line.
The green ATR% stepline shows the denominator: typical range relative to price.
These are separate formulas on the same pane and timeline to show correlation.
(It does not draw on the price chart.)
Two plots with independent calculations
ATR% (green stepline): 14-period ATR as a percent of price. Typical daily range relative to price level.
xFromMA (blue line): how many ATR% units price sits above or below the MA.
ATR% = ATR(14) / close x 100
xFromMA = ((close - MA) / MA x 100) / ATR%
Zero on xFromMA means price is at the MA.
A negative value indicates price is currently below the MA level.
Reading the pane
Both lines declining together often means the name is compressing toward the MA. Volatility and stretch easing at the same time.
Both rising means it's expanding.
Diverging slopes happen too.
xFromMA climbing while ATR% falls can mean price drifting from the MA while day-to-day volatility cools.
Read each line first, then note whether they agree.
Note: The lines share a pane for context, not because they combine into a signal.
A green/blue touch or cross is not a buy or sell event.
Visible-range markers (optional)
High, low, and mean for xFromMA are calculated from the visible bars on the chart.
There is no fixed lookback period.
They update on scroll or zoom, comparing current stretch to recent visible history.
The mean is the average xFromMA over those visible bars, not the midpoint between high and low.
Visible-range mean requires high/low lines enabled in the same settings group.
Optional zero line (dotted): xFromMA = 0, full width of the pane.
ATR% high/low bands exist too, off by default.
Settings
MA period (default 50)
MA type (default SMA)
ATR period (default 14)
Line colors and widths (default: dark green ATR%, blue xFromMA)
Zero line (default on)
High/low bands, xFromMA (default on)
Visible-range mean (default on)
ATR% high/low bands (default off)
Disclaimer
Context tool only. Not a signal, not financial advice. No entry or exit triggers. Past extension habits do not predict future price action.
Indikator
Two Sigma Factor Composite [JOAT]TWO SIGMA FACTOR COMPOSITE
A tribute to the multi-factor approach pioneered by Two Sigma — long-only, long/short, and risk-premia funds that decompose returns into orthogonal factor exposures, normalise each factor onto the same statistical scale, and combine them into a single signed score. Two Sigma Factor Composite builds five canonical factors (Momentum, Quality, Value, Volatility, Mean-Reversion), Z-normalises each against a rolling baseline, sum-normalises the user-controllable weights, and outputs a composite score with signal labels, factor sparklines on the chart, and a rolling hit-rate backtest.
The five factors
Each factor is computed independently and Z-normalised over a configurable window (default 100 bars) with optional outlier clipping (default ±4σ):
Momentum — return / volatility over the configurable momentum window (default 50 bars). The classic "trend" factor.
Quality — inverse of recent realised volatility (default 50-bar window). Lower volatility = higher quality; an asset that has been calmer is treated as higher quality, consistent with academic factor research.
Value — deviation from a long mean (default 200-bar SMA). Negative deviation = "cheap" (positive value factor exposure); positive deviation = "expensive". The classical cross-sectional value definition, adapted to time series.
Volatility — percentile rank of recent realised volatility (default 20-bar stdev percentile-ranked over 252 bars). High vol = negative factor; low vol = positive factor.
Mean-Reversion — signed deviation from a 20-bar mean (default). Captures short-term reversion bias.
Each factor's window is independently configurable. All five outputs are Z-scores capped at ±4σ to prevent any single outlier from dominating the composite.
Sum-normalised weights
Five weight sliders (default 1.0 each) are normalised internally so any positive combination is valid. Default equal weight is the most defensible baseline; tune individual weights to bias the composite. Want a pure momentum + quality read? Set the others to 0.1 and Momentum/Quality to 2.0. The composite reshapes itself live.
Signal engine — bounded composite with three tiers
The composite is bounded by the clipping cap. The signal engine layers three thresholds:
Buy — composite crosses above the buy threshold (default +1.0σ).
Sell — composite crosses below the sell threshold (default −1.0σ).
Extreme Bull / Extreme Bear — |composite| crosses ±2.0σ. The script's strongest read.
A configurable signal cooldown (default 10 bars) prevents clustering.
Factor sparklines (the signature visual)
The script renders inline sparklines on the chart for all five factors — small line plots that visually show each factor's recent Z trajectory. Configurable base offset (vertical position below zero), row spacing, amplitude, and per-row transparency mapping. At a glance you see which factors are driving the composite and which are flat.
When all five sparklines lean the same way, the composite is high-confidence. When they disagree, the composite is a weighted compromise — the sparklines tell you the truth that a single number cannot.
Visual system
Composite line (configurable width, default 3px) with sign-coloured fill toward zero (configurable transparency).
Threshold lines at ±buyTH and ±extremeTH (configurable transparency).
Buy / Sell labels on chart on threshold crosses.
Factor sparklines — five inline Z-trajectory plots in the pane.
Optional chart-background override to follow chart.bg_color.
A locked Emerald Night palette: vivid green bull / vivid red bear / sage mid on a deep emerald background — strict 2-hue discipline with bg. No third colour invented anywhere; all variations are transparency-only.
Dashboard
Monospaced table positionable to any of eight corners. Surfaces:
Composite Z value and sign.
Per-factor Z rows (Momentum / Quality / Value / Volatility / Mean-Reversion).
Factor agreement percentage (how many factors agree with composite sign).
Last signal direction with bars-ago.
Weight configuration in use.
Backtest stats row — rolling forward-N-bar hit rate (configurable lookahead, default 10 bars). The script's own performance audit.
Alerts
Five alert conditions, each independently controllable:
BUY Cross (composite crosses above buy threshold)
SELL Cross
Extreme Bull (composite > +2.0σ)
Extreme Bear (composite < −2.0σ)
Low Factor Agreement (% of factors agreeing falls below the configurable threshold, default 40%) — the script's "no edge" warning.
How to read it
Three reads, in order of conviction:
Extreme score with high factor agreement (e.g. composite > +2.0σ AND agreement > 80%) — the highest-conviction read the script produces. Four or five factors are pointing decisively one way, and the composite is at a statistical extreme.
Buy / Sell with sparkline confirmation — visual confirmation that the directional read is being driven by multiple factors, not just one. If the composite is bullish but only the Momentum sparkline is leaning, the read is fragile; if Momentum + Quality + Value + Mean-Reversion all lean, the read is robust.
Low Agreement alert — stand-aside signal. The factors disagree internally; the composite is a wash. Wait for re-alignment.
Suggested settings
Defaults (momentum 50 / quality vol 50 / value 200 / vol 20/252 / MR 20, Z window 100, ±4σ clip, ±1.0 buy/sell, ±2.0 extreme, 10-bar cooldown) are tuned for daily charts on broad indices — the timeframes where factor approaches are statistically meaningful. For lower timeframes drop all windows proportionally. For weekly+ keep defaults; factor reads on weekly are the canonical institutional horizons.
Originality / what's reused
The factor-investing framework is published academic finance — Fama-French 1992, Carhart 1997, AQR 2013, and many others. The five factors used here (Momentum, Quality, Value, Volatility, Mean-Reversion) are the canonical institutional factor set. The implementation here — the five-factor pipeline with each factor's window independently configurable, the rolling Z-normalisation with outlier clipping, the sum-normalised five-weight composition, the bounded-composite signal engine with three-tier thresholds, the inline factor sparklines render in the same pane, the rolling forward-bar hit-rate backtest, and the strict 2-hue alpha-only palette — is JOAT-original. No third-party code reused. The script is a tribute to Two Sigma-style factor-composite portfolio construction, not a direct replication of any proprietary Two Sigma model.
Limitations
The five factors are computed from chart data only — they are time-series proxies of the cross-sectional factors used in true multi-asset portfolios. The Z-normalisation needs the window populated; early bars give a warm-up read. The forward-N-bar hit-rate backtest is descriptive of recent signal behaviour under the current settings; it is not a predictive metric. Factor exposures historically underperform for extended periods — the dashboard's agreement row and the low-agreement alert exist specifically to warn you when the model is breaking down.
—
-made with passion by jackofalltrades
Indikator

VWAP Choppy Market Detector [TradingFinder] Trend Range🔵 Introduction
Markets are not always clean. Sometimes price moves with a clear bullish or bearish direction, sometimes it stays inside a range, and sometimes it keeps shifting back and forth with no reliable structure. This indicator uses VWAP-based bands to make these market conditions easier to read directly on the chart, showing trend, range, and choppy price action through simple visual zones.
In trending markets, the bands remain more stable and highlight the dominant side of the market. Green zones show bullish pressure, while red zones show bearish pressure. When price moves sideways, the indicator marks the range area with purple zones and shows the Range High and Range Low, making the upper and lower limits of the consolidation easier to follow.
The choppy market signal comes from the behavior of the colors themselves. When the chart keeps changing between bullish, bearish, and range states, it reflects unstable price action, frequent market behavior shifts, and chaotic volatility. This makes the indicator useful for reading when the market has a clean direction, when it is trapped inside a range, and when price movement becomes too noisy or uncertain.
🔵 How to Use
Start by looking at the overall color behavior on the chart. The main purpose of this indicator is to show the current market environment through VWAP-based bands, so the first step is not to look for a single signal, but to understand the condition of the market. When the colors stay stable for a longer period, the market is usually showing a clearer structure. When the colors change repeatedly, the market is shifting between different states and price action is becoming less stable.
Green areas show bullish trend conditions. In this state, price is trading with stronger upward pressure and the market is moving with a clearer bullish bias. Traders can use this condition as a trend filter, a continuation filter, or a confirmation tool before looking for long setups with their own strategy. A stable green zone usually means the market is cleaner for bullish trend-following ideas compared to a market where the color keeps changing.
Red areas show bearish trend conditions. In this state, price is trading with stronger downward pressure and the market is moving with a clearer bearish bias. Traders can use this condition to filter short setups, confirm bearish continuation, or avoid taking long trades against the dominant market behavior. When the red zone remains stable, it shows that the bearish side of the market is more consistent.
Purple areas show range market conditions. In this state, price is moving inside a more limited structure instead of trending strongly in one direction. The upper and lower range boundaries can be used to understand where the market is consolidating. The upper boundary works as the Range High, while the lower boundary works as the Range Low. These levels help traders see the current sideways structure more clearly and follow how price reacts inside the range.
In a range market, traders can use the Range High and Range Low as visual reference levels. Price near the upper boundary may show that the market is testing the top of the range, while price near the lower boundary may show that the market is testing the bottom of the range. This can be useful for range analysis, mean-reversion setups, support and resistance reading, and identifying where price is likely to react inside a consolidation area.
Choppy market behavior is read through frequent color changes. When the chart keeps switching between green, red, and purple, it shows that the market does not have a clean direction. This kind of behavior usually means price is unstable, market bias is changing quickly, and volatility is becoming chaotic. Instead of treating these color changes as random noise, they should be read as the main warning sign of a choppy market.
One of the most useful applications of this indicator is avoiding poor trading conditions. Many strategies perform well in clean trends but struggle when the market becomes choppy. If the colors change too often and price fails to hold a stable condition, traders can use that information to reduce exposure, wait for a clearer structure, avoid overtrading, or be more selective with entries.
The indicator can also be used as a trend-following filter. When the market remains green, traders can focus more on bullish setups. When the market remains red, traders can focus more on bearish setups. This does not mean every green area is a buy signal or every red area is a sell signal. It means the market condition is more aligned with that side, and traders can combine it with their own entry model, price action setup, support and resistance level, or risk management plan.
Another use case is range detection. When the indicator marks a purple range, traders can quickly see that price is no longer moving with strong directional pressure. This helps separate trending conditions from sideways conditions. Range detection can be useful for traders who use consolidation breakouts, range trading, mean reversion, liquidity sweeps, or support and resistance reactions.
The indicator can also help with breakout context. Before a breakout, price often spends time inside a range. By watching the Range High and Range Low, traders can better understand where the range is forming and where a breakout attempt is happening. If price leaves the purple range and the market shifts into a stable green or red condition, traders can use that as extra context that the market behavior has changed from consolidation to directional movement.
For choppy market analysis, the most important thing is the speed and frequency of the color changes. A few normal changes can happen during transitions, but repeated switching shows that the market is unstable. This can help traders recognize fake breakouts, messy pullbacks, weak trend conditions, and periods where price does not respect a clean structure.
The timeframe setting controls the VWAP anchor period. Daily mode is more suitable for short-term and intraday analysis. Weekly mode gives a broader view of the current week’s VWAP structure. Monthly mode provides a higher-timeframe view and can be useful for swing trading or larger market context. Traders can choose the anchor timeframe based on the way they trade and the amount of market structure they want to see.
The Band Multiplier controls the width of the main VWAP bands. A wider band gives a broader market structure, while a smaller band keeps the bands closer to price. This setting affects how the trend and volatility structure is displayed on the chart. Traders can use it to match the indicator with different symbols, sessions, and volatility conditions.
The Range Multiplier controls the sensitivity of the range detector. A lower value makes the range detection more sensitive, so range areas may appear more actively. A higher value makes the range detection more conservative, so the indicator becomes more selective when marking range conditions. This setting is useful because different markets do not move the same way; some symbols are naturally smoother, while others are more volatile and noisy.
The VWAP line can be shown or hidden depending on the trader’s preference. When enabled, it gives a direct view of the VWAP reference line inside the band structure. Some traders may use it as a central fair-value reference, while others may prefer to keep the chart cleaner and focus only on the colored bands and market regime zones.
This indicator can be used by scalpers, intraday traders, swing traders, and market structure traders. Scalpers may use it to avoid fast choppy conditions and focus on cleaner short-term movement. Intraday traders can use it to read the daily or weekly VWAP structure. Swing traders can use weekly or monthly mode to understand broader market behavior. Price action traders can use it as a visual filter for trend, range, and unstable market conditions.
The best way to use the indicator is as a market condition tool, not as a standalone entry system. Its main value is helping traders understand when the market is trending, when it is ranging, and when price action is too choppy to read clearly. Once the market condition is clear, traders can apply their own strategy with better context.
🔵 Settings
TimeFrame : This setting defines the VWAP anchor period used by the indicator. Traders can choose between Daily, Weekly, and Monthly modes. Daily mode follows the current day’s VWAP structure, Weekly mode uses the current week’s VWAP structure, and Monthly mode shows a broader VWAP structure based on the current month.
Band Multiplier : The Band Multiplier controls the width of the main VWAP bands. A higher value makes the bands wider and gives more space around price, while a lower value keeps the bands closer to price. This setting affects how the indicator displays the main trend and volatility structure.
Range Multiplier : The Range Multiplier controls the sensitivity of the range detector. Lower values create High Range Sensitivity, so the indicator detects range conditions more actively. Higher values create Low Range Sensitivity, making range detection more selective and conservative.
Show VWAP Line : This option shows or hides the VWAP line on the chart. When enabled, the VWAP line can be used as the central reference inside the band structure. When disabled, the chart stays cleaner and the focus remains on the colored market condition zones.
🔵 Conclusion
Market conditions can change quickly, and not every move has the same quality. A clean trend, a structured range, and a choppy market need to be read differently. This indicator helps make that difference more visible by using VWAP-based bands and color behavior to show when price is moving with direction, when it is consolidating, and when the market is becoming unstable.
The main strength of the tool is its visual reading of market behavior. Stable green or red zones make trending conditions easier to follow, while purple zones highlight range structures with clear upper and lower boundaries. When the colors start changing frequently, that shift itself becomes an important warning that price action is noisy, unstable, and moving without a clean direction.
Overall, the indicator gives traders a clearer way to read trend, range, and choppy market conditions before making trading decisions. It is best used as a market environment filter, helping traders understand the current price behavior and decide whether the market is clean enough for their strategy or too chaotic to trade confidently.
Indikator
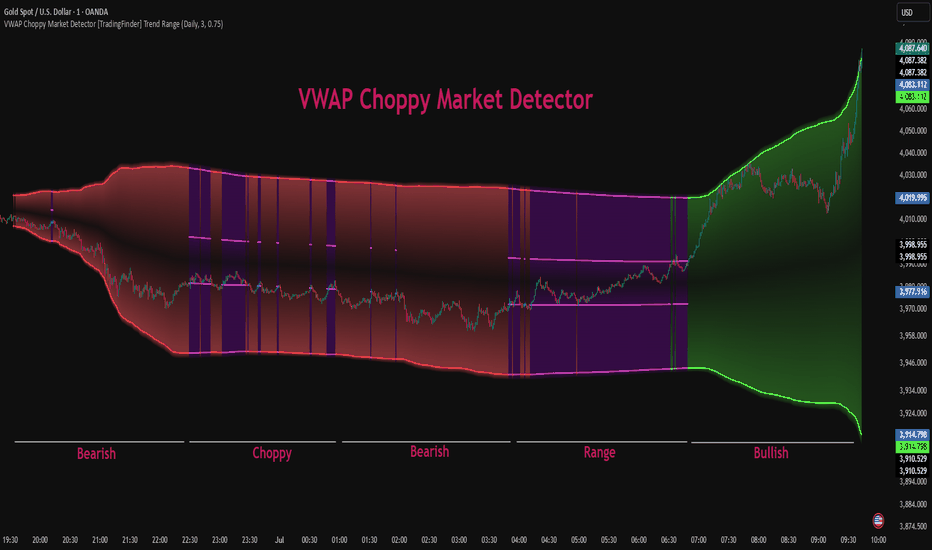
Indikator

Conformal Reversion Bands Self-Calibrating CoverageConformal Reversion Bands — Self-Calibrating Coverage
What it is
Ordinary bands lie about themselves. A Bollinger "2σ" band or an ATR band asserts a coverage it does not deliver — real price isn't Gaussian, so the band that's supposed to contain 95% of bars might actually contain 88% or 98%, and that fraction drifts as volatility changes. The label and the chart disagree.
Conformal Reversion Bands fix this. You choose the coverage you want (e.g. 90%), and the band's half-width is a nonconformity quantile that is tracked online so the realised coverage actually converges to your target — and self-corrects when it drifts. The indicator then displays target vs realised coverage live, so you can see the guarantee holding instead of taking it on faith. A breach of a calibrated 95% band means something precise: price did what it does under about 5% of the time — a genuine rare excursion, and a mean-reversion (fade) candidate back toward fair value.
How it works (and why this specific method)
Centre — a fair-value line the bands revert to: session VWAP by default (auto-fallback to a robust rolling median on symbols without reliable volume), or EMA / median by choice.
Score — the absolute deviation of price from the centre. Its running quantile is the band half-width.
Online calibration — this uses the quantile tracker ("conformal P control") of Angelopoulos, Candès & Tibshirani (2023), with an optional error integrator ("PI control"). This is deliberately chosen over the older Adaptive Conformal Inference (ACI): ACI adapts the significance level and can occasionally produce infinite or null intervals; tracking the quantile on the scale of the scores cannot degenerate that way, so the bands stay finite and well-behaved on live charts. ACI is in fact a special case of the tracker.
Volatility-normalized scores (locally adaptive) — scores are normalized by a local volatility estimate before calibration (the Papadopoulos–Gammerman–Vovk normalized-nonconformity idea), so the band width breathes with volatility bar-by-bar. This targets conditional coverage — not too wide in calm tape, not too narrow in fast tape — instead of only a global average.
Decaying step size — the learning step shrinks as calibration matures (Angelopoulos–Barber–Bates) for tighter long-run coverage, floored so the bands never stop adapting to new regimes.
Self-check — a trailing window measures realised coverage for both bands and reports how closely it tracks target. That readout is the whole point: it makes the band's core claim verifiable on your own chart. Note the honest theoretical ceiling: exact conditional coverage is impossible distribution-free; normalization gets most of the practical way there at negligible cost.
Everything advances only on confirmed bars: the band shown on a bar is calibrated on scores up to the previous bar, then that bar is tested against it — no hindsight fitting.
How to use it
Add to any liquid symbol/timeframe; set the coverage you want for the inner and outer bands. Defaults suit index futures; change the price/volume sources in Data source for any other market.
Read the dashboard headline first: it states CALIBRATED / ADAPTING / WARMING in plain language, with a colour anyone can read at a glance. When the inner and outer rows show target and realised % matching (✓), the bands are provably doing their job.
Treat an outer-band breach as a statistically rare excursion — a fade-toward-centre candidate (optional close-back-inside confirmation).
Watch COMPRESSION: a low band-width percentile means the bands are unusually tight (a volatility squeeze — expansion often follows); a high percentile means unusually wide.
Divergences (price vs the band's own normalized deviation, or RSI — your choice) are drawn as lines on price for context.
The dashboard and the identity label are separate toggles; the price/volume sources, coverage targets and every window are adjustable. Works as an honest, self-calibrating replacement for Bollinger/Keltner/ATR bands anywhere you use deviation bands.
What makes it original
Almost nothing on TradingView ships real conformal prediction, and — as far as the author is aware — nothing ships the modern quantile-tracker / PI-control variant with a live coverage readout that proves the band's claim on-chart. The contribution is bringing a 2023-frontier uncertainty-quantification method to price bands in a form a trader can verify at a glance, rather than a σ-multiplier that only pretends to a coverage level. The band-width compression read and the band-native divergence are natural, honest by-products of the same construction — context, not a signal service.
Concept credits
Conformal prediction — V. Vovk, A. Gammerman, G. Shafer. Normalized nonconformity — H. Papadopoulos, A. Gammerman, V. Vovk (2008). Adaptive Conformal Inference — I. Gibbs & E. Candès (2021). Quantile tracker / Conformal PID control — A. Angelopoulos, E. Candès & R. Tibshirani (2023). Decaying step — A. Angelopoulos, R. Barber, S. Bates (2024). VWAP — classical. Implementation and charting design are the author's own.
Important disclaimer
Research and education only. Not financial advice, not a signal service, not a guarantee of future results. Coverage is a statistical property of the band width — it is not a claim that fading breaches is profitable. The readout is descriptive of the past on the current chart, not a forward guarantee. Validate independently, apply realistic costs and slippage, and manage your own risk. Indikator

Grimes KC: MTF Volatility Regimes### 🌐 Overview
**Grimes KC: MTF Volatility Regimes** is an advanced Multi-Timeframe (MTF) Volatility Regime Mapping System. The indicator is built upon the robust foundation of **Adam Grimes' Keltner Channels (KC)** and synthesized with the multi-layered volatility analysis inspired by **Mark Whistler's Wave PM** and **John Carter's TTM Squeeze**.
This indicator is NOT just a tool that paints colors on your background. It is a high-dimensional market map that seamlessly merges **Statistical Price Extremes (Spatial Dimension)** with **MTF Volatility Cycles (Temporal Dimension)** through a two-step framework.
---
### 🔬 The Two-Step Analytical Framework
#### Step 1: Statistical Price Extremes & Tail Events (Spatial Dimension)
The core structure utilizes a dual-layered MTF Keltner Channel. Statistically, the probability of price simultaneously piercing outside the outer bands of **both the Chart Timeframe and the Higher Timeframe at the exact same time is extremely low (a rare tail event)**.
However, this extreme breakthrough presents **two diametrically opposed possibilities**: it could either be the birth of a massive, explosive **"Band-Walk" (institutional trend initiation)**, or a severe **"Mean-Reversion Snapback" (an overextended statistical anomaly ripe for a fade)**. By plotting these multi-layered price boundaries, the indicator visually maps these high-stakes junctions, allowing traders to monitor which of the two opposite paths the market will choose.
#### Step 2: Quantified Volatility Cycle Serialization (Temporal Dimension)
To eliminate raw price noise, the indicator continuously measures the historical percentile (0–100%) of the band widths over a user-defined lookback period. It dynamically normalizes and serializes the MTF volatility cycle (Contraction & Expansion). The interplay between long-term institutional compression and short-term retail momentum is instantly visualized, telling you whether the market is loading energy, expanding in a healthy trend, or reaching statistical exhaustion.
---
### 🎨 The 4 Volatility Regimes & Actionable Strategies
#### 1. 🟦 Double Squeeze (Both Timeframes <= 10%)
* **Market State:** Severe volatility compression across both short-term retail and long-term institutional participants. The market energy is coiled like a tight spring.
* **Strategy:** **Prepare for Breakout.** Do not trade inside this zone. Wait for the background color to turn off and look for a heavy momentum expansion.
#### 2. 🟨 Early Breakout / Volatility Illusion (Chart TF >= 90% / HTF <= 10%)
* **Market State:** Short-term volatility spikes while the macro timeframe remains in a heavy squeeze. According to **Mark Whistler's theory**, this represents a *"Volatility Illusion"* that lacks true institutional liquidity.
* **Strategy:** **Monitor for Fade or Breakout.** This regime presents **two diametrically opposed scenarios**:
1) **The Fade (Mean-Reversion):** The price expansion fails as a "False Breakout," and the price is rapidly snapped back to the center by the gravity of the HTF squeeze. This offers a high-probability short-term counter-trend entry.
2) **The Lead (Trend Initiation):** The short-term momentum is so powerful that it forces the higher timeframe to break its squeeze, dragging the HTF into an expansion and starting a massive **"Band-Walk"**.
Always wait for price action to confirm which scenario unfolds before execution.
#### 3. 🟪 Pullback / Trend Continuation (Chart TF <= 10% / HTF >= 90%)
* **Market State:** The higher timeframe is in a powerful, established trend, while the lower timeframe chart takes a temporary breath (forming tight ranges, flags, or pennants).
* **Strategy:** **High-Probability Pullback Entry.** This is the ideal regime for trend-followers. Look to buy the dips or sell the rallies when the short-term chart expands back out in the alignment direction of the HTF trend.
#### 4. 🟥 Double Expansion (Both Timeframes >= 90%)
* **Market State:** Statistical exhaustion. Both macro and micro trends have reached their theoretical and statistical upper limit over the lookback history.
* **Strategy:** **Take Profit / Do Not Chase.** The market is severely overextended. Tighten trailing stops or secure your profits immediately. Absolutely avoid chasing new positions here.
---
### ⚠️ Crucial Trading Guide
**IMPORTANT:** This indicator is a Volatility Regime Map, NOT a raw buy/sell signal generator. It provides 1-dimensional volatility structure (width) and multi-timeframe regime contexts.
To achieve a complete institutional execution setup, you must combine these background colors with a directional tool, such as the slope of the Moving Average or price action breakout direction, to filter your trades.
---
### ⚙️ Best Practices & Inputs
* **Timeframe Selection (HTF Input):** It is **highly recommended** to set the Higher Timeframe (HTF) to **1-Hour (60) or higher** (e.g., 240 or D) relative to your lower timeframe charts (like 5-min or 15-min). This allows the algorithm to accurately capture macro institutional cycles.
* **Fully Customizable Visuals:** Unlike rigid scripts, you can customize all 4 regime colors, line colors, and background opacities directly from the Input Parameter settings to seamlessly match your Dark or Light chart themes.
---
*Credits: Conceptualized based on the volatility market microstructures of Adam Grimes and Mark Whistler. Developed with the assistance of an AI coding partner.*
Indikator