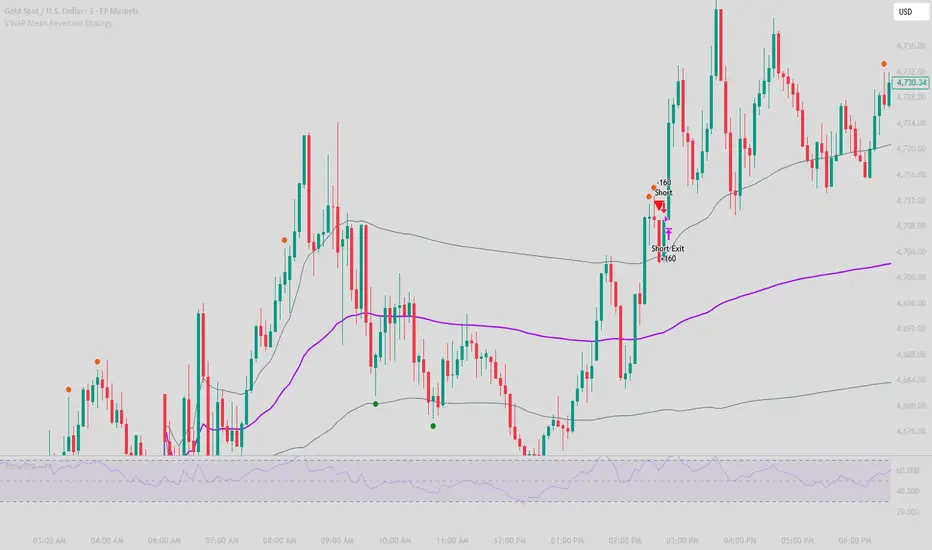
Rolling VWAP with StdDev BandsRolling VWAP with StdDev Bands (RVWAP+SD)
This indicator calculates a Rolling Volume-Weighted Average Price (RVWAP) over a configurable rolling time window (default: 10 hours), with volume-weighted standard deviation bands overlaid above and below. Unlike session-anchored VWAP, this indicator never resets at session boundaries, making it equally effective on crypto, forex, and equity markets at any timeframe.
What it does
RVWAP : Volume-weighted average price computed over the last N hours of bars using the PineCoders ConditionalAverages library for time-based aggregation. Smoothed with SWMA + RMA(6) to reduce noise.
StdDev Bands : Upper and lower bands at RVWAP +/- (multiplier x volumeWeightedStdDev). Bands are derived from: Variance = SUM((hlc3 - RVWAP)^2 * volume) / SUM(volume), giving true volume-weighted statistical envelopes.
Trend Colouring : RVWAP turns GREEN when it is rising and close > upper band (strong trend up), RED when falling and close < lower band (strong trend down), and WHITE when price oscillates within the bands (neutral / mean-reversion environment). Trend lookback is automatically synchronised to the RVWAP timeframe.
How to use
Trend following : Trade in the direction of a green or red RVWAP when price breaks and holds outside the bands.
Mean reversion : When RVWAP is white (neutral), band tags are potential mean-reversion entries back toward the RVWAP.
Alerts : Two built-in alert conditions are included for price crossing above the upper band or below the lower band.
Inputs
RVWAP Timeframe — Resolution for VWAP aggregation (default: 3-minute). Should be >= your chart timeframe.
RVWAP Time Period in Hours — Rolling window for VWAP calculation (default: 10 hours).
Standard Deviation Multiplier — Band width in standard deviation units (default: 2.0).
Show Bands / Show Fill — Toggle band lines and fill visibility independently.
Important notes
This indicator uses lookahead=barmerge.lookahead_off on all request.security() calls. The last bar may update as real-time volume changes — this is normal VWAP behaviour and not a repainting issue.
The SWMA + RMA smoothing introduces some lag and is not intended for tick-level scalping.
Works on all markets and timeframes. On very thin/illiquid instruments, VWAP reliability depends on volume data quality.
Credits
Rolling time-window aggregation uses the PineCoders/ConditionalAverages/2 library (PineCoders, public domain per TV House Rules). All other code — volume-weighted standard deviation, timeframe synchronisation, trend state logic, and smoothing pipeline — is original.
Indikator

Indikator

VWAP Volatility Bands [BOSWaves]VWAP Volatility Bands - T3-Smoothed VWAP System with Dynamically Scaled Volatility Bands
Overview
VWAP Volatility Bands is a tension-aware trend following system that anchors directional bias to a T3-smoothed Volume Weighted Average Price, where volatility bands dynamically scale with to reflect real market conditions and automatically generate directional signals when price interacts with band extremes.
Instead of relying on raw VWAP lines or static envelope channels, trend state, band visibility, and signal generation are determined through T3-smoothed VWAP direction, ATR-normalized band construction, and score-based logic that surfaces only the most relevant visual context for the current trend.
This creates dynamic volatility boundaries that reflect actual price tension relative to the volume-weighted mean rather than arbitrary fixed offsets - compressing during low-volatility conditions, expanding during high-volatility periods, and capturing overextension signals at band extremes where price demonstrates significant deviation from fair value.
Price is therefore evaluated relative to bands that adapt to volatility dynamics and volume-weighted equilibrium rather than conventional price-only moving averages.
Conceptual Framework
VWAP Volatility Bands is founded on the principle that meaningful trend signals emerge when price maintains position relative to a T3-smoothed VWAP that filters short-term noise, while significant overextension zones form at ATR-scaled distances that reflect genuine volatility rather than static multipliers.
Traditional VWAP approaches plot raw cumulative values without smoothing, making them reactive to short-term volume spikes and difficult to read in trend context. This framework replaces raw VWAP plotting as the primary reference with T3-smoothed VWAP direction, using the raw line only as an optional secondary reference for confluence.
Three core principles guide the design:
Trend direction should be determined by the slope of T3-smoothed VWAP, filtering noise inherent in raw cumulative VWAP readings.
Volatility bands should scale dynamically with ATR, ensuring band distances represent statistically meaningful deviations across varying market conditions.
Only directionally relevant bands should be displayed at any time - bullish bands below during uptrends, bearish bands above during downtrends - reducing visual noise and reinforcing directional context.
This shifts VWAP analysis from a single reference line into a full tension-aware volatility framework with intelligent band management.
Theoretical Foundation
The indicator combines anchored VWAP accumulation, T3 exponential smoothing, Average True Range volatility measurement, slope-based score logic, and overextension signal detection methodology.
A user-configurable VWAP anchor (Session, Week, Month) provides the volume-weighted price reference that resets at meaningful market boundaries, while T3 smoothing applies a six-stage EMA cascade with configurable volume factor to eliminate noise without introducing excessive lag. ATR measurement provides volatility-normalized scaling for band construction. Score logic encodes T3 slope direction into a persistent state that governs band visibility and bar coloring.
Four internal systems operate in tandem:
VWAP Accumulation Engine : Computes cumulative volume-weighted typical price across the selected anchor period, resetting at session, weekly, or monthly boundaries.
T3 Smoothing System : Applies six-stage EMA cascade with configurable length and volume factor to produce a smooth, low-lag trend baseline from raw VWAP.
ATR Band Construction : Scales four band pairs above and below T3 baseline using fixed ATR multipliers (0.5, 1.0, 1.5, 2.2) to define volatility zones of increasing significance.
Score and Signal Engine : Tracks T3 slope direction as a persistent score state, governs which band set is displayed, generates entry diamonds at slope changes, and fires TP signals at band extreme crossovers.
This design allows volatility boundaries to reflect actual market tension relative to volume-weighted fair value rather than reacting mechanically to price-only calculations.
How It Works
VWAP Volatility Bands evaluates price through a sequence of volume-weighted, tension-aware processes:
Anchor Reset Detection : System identifies session, weekly, or monthly boundaries and resets cumulative volume and volume-weighted price accumulators accordingly.
VWAP Accumulation : Typical price multiplied by volume accumulates alongside raw volume across the anchor period, producing a continuously updating raw VWAP value.
T3 Smoothing : Raw VWAP passes through a six-EMA T3 cascade using configurable length and factor parameters, producing a smooth directional baseline.
ATR Calculation : 14-period ATR provides volatility-normalized distance measurement for all band construction.
Band Calculation : Four upper and four lower bands are computed at 0.5, 1.0, 1.5, and 2.2 ATR distances from the T3 baseline.
Score Assignment : T3 slope is evaluated each bar; rising slope sets score to +1 (bullish), falling slope sets score to -1 (bearish), flat slope persists prior state.
Directional Band Display : Score +1 renders lower bands only; score -1 renders upper bands only, ensuring only contextually relevant zones are visible.
Gradient Fill Construction : Progressive opacity fills between band pairs create a visual tension gradient, with outer fill intensity scaling dynamically based on price proximity to the extreme band.
Entry Signal Generation : T3 slope crossover (bullish) plots a diamond at the lower extreme band; T3 slope crossunder (bearish) plots a diamond at the upper extreme band.
TP Signal Generation : Price closing beyond the outer band against the current trend direction triggers a take-profit marker, identifying overextension relative to the volatility envelope.
Bar Coloring : Each bar is tinted based on trend score and distance from T3 baseline, with intensity scaling proportionally to deviation up to the outer band distance.
Together, these elements form a continuously updating volatility framework anchored in volume-weighted price dynamics and ATR-normalized tension measurement.
Interpretation
VWAP Volatility Bands should be interpreted as volume-anchored volatility boundaries with automated overextension detection:
Bullish Trend State (Green) : Established when T3-smoothed VWAP slope is rising, with lower volatility bands displayed as dynamic support zones beneath price.
Bearish Trend State (Red) : Established when T3-smoothed VWAP slope is falling, with upper volatility bands displayed as dynamic resistance zones above price.
Elastic Cloud : Progressive gradient fills between band pairs create a visual tension zone, with outer fill darkening as price pushes toward the extreme band.
Raw VWAP Line : Optional dotted reference displaying the unsmoothed cumulative VWAP for confluence analysis against the T3 baseline.
Tension Dynamics : Price operating near T3 baseline indicates low tension and equilibrium; price near outer bands (2.2 ATR) indicates high tension and potential overextension.
◆ Entry Signals : Green diamond at lower band marks T3 slope turning bullish; red diamond at upper band marks T3 slope turning bearish, indicating directional momentum shifts.
⬨ TP Signals : Take-profit markers appear when price closes beyond the outer band against the prevailing trend direction, signaling potential exhaustion and mean reversion opportunity.
Colored Candles : Bar tinting reflects current trend state and distance from T3 baseline, with gray bars near the baseline and full-color bars at maximum tension distance.
T3 slope direction, band interaction, and tension proximity outweigh isolated price movements when interpreting the indicator.
Signal Logic & Visual Cues
VWAP Volatility Bands presents three primary interaction signals:
Buy Signal (◆) : Green diamond appears at the lower extreme band when T3-smoothed VWAP slope crosses upward, suggesting bullish momentum shift with lower volatility bands now acting as dynamic support structure.
Sell Signal (◆) : Red diamond displays at the upper extreme band when T3-smoothed VWAP slope crosses downward, indicating bearish momentum shift with upper volatility bands now acting as dynamic resistance structure.
Take Profit Signal (⬨) : Small markers appear when price crosses beyond the outer extreme band against the prevailing trend direction, identifying overextension relative to the ATR-normalized volatility envelope and suggesting potential mean reversion back toward the T3 baseline.
Band gradient intensity provides continuous visual feedback on tension buildup without requiring separate oscillator panels.
Alert generation covers trend state switches (bullish/bearish entry signals) and take-profit occurrences for systematic monitoring.
Strategy Integration
VWAP Volatility Bands fits within adaptive trend-following and volatility-envelope approaches:
Band-Based Position Management : Use inner bands (0.5–1.0 ATR) as continuation zones and outer bands (1.5–2.2 ATR) as overextension warnings during active trends.
TP Signal Profit-Taking : Scale out of positions when price triggers outer band TP signals, as these mark statistically significant deviation from the volume-weighted mean.
T3 Baseline Re-entry : Look for re-entry opportunities when price pulls back toward T3 baseline during trending conditions without breaching trend direction.
Raw VWAP Confluence : Use optional raw VWAP display alongside T3 baseline to identify alignment between smoothed and unsmoothed references as higher-confidence zones.
Tension-Aware Sizing : Reduce position sizing when price operates near outer bands as overextension conditions carry elevated mean-reversion risk.
Anchor Period Selection : Match VWAP anchor to trading timeframe - Session for intraday, Week for swing, Month for position trading - to ensure volume weighting reflects relevant market participation.
Multi-Timeframe Confirmation : Apply higher-timeframe VWAP Volatility Bands trend state as directional filter for lower-timeframe entry precision, entering only when T3 slopes align across timeframes.
Technical Implementation Details
Core Engine : Anchored VWAP accumulation with configurable reset boundary (Session, Week, Month) and T3-smoothed baseline
Smoothing Model : Six-stage EMA cascade (T3) with configurable length and volume factor parameters
Band Model : Four ATR-scaled band pairs at fixed multipliers (0.5, 1.0, 1.5, 2.2) from T3 baseline
Score System : Persistent slope-based directional state with single-bar crossover detection
Visualization : Progressive gradient fills with dynamic outer opacity, directional bar coloring scaling with tension distance
Signal Logic : Slope crossover entry diamonds at outer band level, outer band breach TP markers with directional filtering
Performance Profile : Optimized for real-time execution across all timeframes with efficient cumulative accumulation logic
Optimal Application Parameters
Timeframe Guidance:
1 - 5 min : Intraday scalping with Session anchor and responsive T3 length settings
15 - 60 min : Intraday momentum following with Session or Week anchor for balanced band behavior
4H - Daily : Swing-level trend identification with Week or Month anchor for sustained volatility context
Suggested Baseline Configuration:
VWAP Anchor : Session
T3 Length : 28
T3 Factor : 0.7
ATR Length : 14
Show Raw VWAP : Enabled
Show TP Signals : Enabled
Color Bars : Enabled
Bullish Color : Bright Green (#00FF44)
Bearish Color : Pink-Red (#FF0066)
These suggested parameters should be used as a baseline; their effectiveness depends on the asset's volatility profile, trending characteristics, and anchor period alignment with the trading timeframe, so fine-tuning is expected for optimal performance.
Parameter Calibration Notes
Use the following adjustments to refine behavior without altering the core logic:
T3 too slow/fast : Adjust T3 Length to control smoothing speed - lower values produce a more responsive baseline with earlier slope changes, higher values create a smoother baseline with more persistent trend states.
T3 too smooth/jagged : Adjust T3 Factor between 0.0 and 1.0 - higher values increase smoothness with additional lag, lower values reduce lag at the cost of more noise in the baseline.
Bands too wide/narrow : Adjust ATR Length to control band scaling - lower values make bands more reactive to recent volatility, higher values produce more stable band distances.
Too many TP signals : TP signals fire at the 2.2 ATR outer band by design; if frequency is excessive, consider increasing ATR Length to stabilize the outer band distance.
VWAP anchor misaligned : Switch anchor period to match the dominant trading session or timeframe - Session for intraday, Week for multi-day swing, Month for longer-term positioning.
Excessive bar color noise : Disable Color Bars to remove tinting and focus purely on band and signal interaction without bar-level visual feedback.
Raw VWAP divergence : Large gaps between raw VWAP and T3 baseline indicate high smoothing lag; reduce T3 Length or Factor to bring baseline closer to raw VWAP in fast-moving conditions.
Adjustments should be incremental and evaluated across multiple session types rather than isolated market conditions.
Performance Characteristics
High Effectiveness:
Trending markets with sustained directional movement away from the volume-weighted mean
Instruments with consistent intraday volume profiles where VWAP anchoring provides meaningful fair value reference
Momentum continuation strategies using inner bands as dynamic support/resistance during active trends
Overextension identification approaches benefiting from ATR-normalized outer band signals at tension extremes
Session-based trading where VWAP anchor resets align with institutional volume participation boundaries
Reduced Effectiveness:
Choppy, range-bound markets with frequent T3 slope reversals producing whipsaw entry signals
Low-volume instruments where VWAP accumulation becomes distorted by thin participation and erratic volume spikes
Pre-market or extended-hours sessions where volume profiles differ significantly from regular session dynamics
Highly gapped markets where price discontinuities bypass band interaction logic between sessions
Consolidation and sideways price action where trend-following methodologies inherently struggle due to lack of sustained directional movement
Integration Guidelines
Confluence : Combine with BOSWaves structure analysis, momentum oscillators, or volume profile tools for multi-factor confirmation
Band Respect : Honor outer band TP signals as primary overextension alerts - consider reducing exposure when price reaches 2.2 ATR deviation from T3 baseline
Baseline Awareness : Monitor price relationship to T3 baseline as the primary equilibrium reference - sustained distance indicates trend conviction, proximity indicates consolidation
Tension Monitoring : Track band gradient intensity to identify building tension conditions that may precede acceleration or reversal
Anchor Discipline : Maintain consistent anchor period selection aligned with the primary trading timeframe rather than switching anchors to fit recent price behavior
State Discipline : Maintain directional bias aligned with current T3 slope state until a confirmed slope reversal occurs
Multi-Timeframe Alignment : Use higher timeframe T3 slope direction as a filter for lower timeframe entries to ensure confluence across time horizons
Disclaimer
VWAP Volatility Bands is a professional-grade trend following and volatility band system. It uses T3-smoothed VWAP with ATR-normalized band construction but does not predict future price movements. Results depend on market conditions, volatility characteristics, anchor period selection, and disciplined execution. BOSWaves recommends deploying this indicator within a broader analytical framework that incorporates price structure, volume context, and comprehensive risk management. Indikator

Key Level SuiteKey Level Suite is a comprehensive label indicator that displays the most important price levels directly on your chart — always anchored to the right edge so they stay out of your price action and are easy to read at a glance.
Instead of drawing horizontal lines across the entire chart, Key Levels renders clean, minimal text labels at each price level. When multiple levels converge within a configurable threshold, they are automatically merged into a single label showing all contributing names (e.g. wVWAP | mH | pdVAH), making confluences immediately visible without any manual work.
📌 Levels Included
🔹 VWAP & Value Area (VAH / VAL)
Session VWAP with one standard-deviation bands for Daily, Weekly, Monthly, Quarterly, and Yearly periods.
🔹 Previous VWAP & Value Area
The final VWAP, VAH, and VAL from the completed prior session — Daily through Yearly.
🔹 Rolling VWAP & Value Area
Volume-weighted average price over rolling windows of 1, 7, 30, 90, and 365 days, each with its own VAH/VAL band.
🔹 Highs & Lows
Current and previous session high/low for all five periods.
🔹 Opens
Session open price for Daily, Weekly, Monthly, Quarterly, and Yearly.
🔹 EMA (10 slots)
Up to 10 exponential moving averages with independently configurable length and timeframe per slot. Leave the timeframe blank to use the chart timeframe.
⚙️ Settings
Style
Choose label text size: Tiny, Small, Normal, or Large.
Colors
Individual color pickers for each timeframe group — Daily, Weekly, Monthly, Quarterly, Yearly — plus separate colors for High/Low, Open, and EMA labels. All current, previous, and rolling levels of the same timeframe share one color, making it immediately clear which timeframe a level belongs to.
Merge
Enable or disable automatic label merging and set the proximity threshold as a percentage. Levels within this distance of each other are combined into a single label listing all contributing names — no more overlapping text at confluence zones.
VWAP / Previous VWAP / Rolling VWAP / Statics / EMA
Every individual level and group can be toggled on or off independently, so you only see what is relevant to your trading style. Indikator

Indikator

Indikator

Indikator

Indikator

Indikator

Indikator

Indikator

Advanced Volume [v3.1]Advanced Volume Indicator & Divergence Dashboard -
Volume is the fuel that drives market structure. While price dictates *where* the market is going, volume reveals *how much conviction* is behind the move.
The **Advanced Volume Indicator** is a comprehensive, multi-factor analysis toolkit designed to move beyond single-metric volume analysis. By aggregating seven distinct volume indicators, a cooldown-aware divergence engine, and a dynamic scoring dashboard, this tool provides a complete, institutional-grade picture of market participation and order flow.
Core Metrics Included
You can select any of the following primary oscillators to display on your main indicator pane. Regardless of your visual selection, the background engine continuously tracks all of them:
* **Chaikin Money Flow (CMF):** Measures the balance of accumulation and distribution over a rolling period.
* **Money Flow Index (MFI):** A volume-weighted relative strength index used to spot volume exhaustion and overbought/oversold extremes.
* **Volume RSI:** Applies momentum calculations strictly to volume, identifying periods of expanding or contracting participation.
* **Relative Volume (RVOL):** Compares the current bar's volume against a rolling baseline average to highlight significant spikes.
* **Volume Oscillator:** Tracks the percentage spread between short-term and long-term volume moving averages to determine volume trend direction.
* **VWAP Position:** Evaluates price action relative to the session's Volume Weighted Average Price (an institutional benchmark).
* **Estimated Cumulative Volume Delta (CVD):** Approximates net buying and selling pressure.
The Weighted Aggregate Dashboard
The centrepiece of this indicator is the on-chart Heads-Up Display (HUD). It provides real-time status updates for all seven metrics and combines them into a **Weighted Aggregate Signal**.
The engine evaluates all data points simultaneously and outputs a directional score ranging from **-9 (Strong Sell)** to **+9 (Strong Buy)**.
The scoring is weighted based on metric reliability:
* **CMF:** ±2 points (Primary money flow driver)
* **MFI:** +2 (oversold), +1 (neutral bullish), or -1 (overbought/bearish bias)
* **Volume Oscillator:** ±1 to ±2 points (Based on trend expansion strength)
* **Volume RSI:** ±1 point
* **VWAP Position:** ±1 point
* **Volume Trend (vs 20 SMA):** ±1 point
Smart Divergence Engine
The script features a robust momentum divergence engine applied to your chosen primary oscillator. It includes three distinct filters to prevent false signals and alert spam:
1. **Divergence Strength Scoring:** Evaluates the severity of both the price displacement and the oscillator displacement.
2. **Minimum Strength Filter:** Allows you to ignore weak, insignificant divergences. (A typical strong signal scores between 1.0 and 5.0).
3. **Cooldown Gate:** Requires a minimum number of bars between signals of the same direction, preventing the engine from spamming repeated alerts during a slow, grinding trend.
Actionable Signals & Alerts
The indicator provides visual markers and fully configurable alerts for:
* **Bullish & Bearish Divergences:** Confirmed momentum shifts.
* **Volume Spikes:** Bars exceeding your custom RVOL threshold (default 2.0x average).
* **Hidden Liquidity:** High-volume Doji candles. These represent extreme volume participation resulting in price indecision—often a footprint of institutional absorption or hidden liquidity resting in the order book.
Recommended Settings by Trading Style
* **Scalping (1m–5m):** Lookback = 3, Cooldown = 5, Min Strength = 0.5, Session CVD Reset = ON
* **Day Trading (15m–1H):** Lookback = 5, Cooldown = 10, Min Strength = 1.0, Session CVD Reset = ON
* **Swing Trading (4H–D):** Lookback = 5, Cooldown = 15, Min Strength = 2.0, Session CVD Reset = OFF
* **Portfolio/Macro (D–W):** Lookback = 8, Cooldown = 20, Min Strength = 1.0, Session CVD Reset = OFF
Strategy Integration
This script exports its internal data silently to the TradingView Data Window. You can easily import these values into your own automated strategy scripts using the `request.security()` function. The exported plots are: `Export_CMF`, `Export_MFI`, `Export_RVOL`, and `Export_DivStrength`.
---
MANDATORY MODERATION DISCLOSURES
**1. Historical Plotting / Offset Confirmation**
By design, the divergence markers plotted by this script appear in the past. To ensure a divergence signal is permanently locked in and mathematically valid, the engine waits for `div_lookback` bars to close *after* the suspected pivot high/low before confirming it. Once confirmed, it plots the marker backward onto the actual pivot bar using a negative offset. **This is not a repainting bug.** It is a strict, standard confirmation feature to prevent repainting and false signals mid-move. Alerts can be set to fire only upon bar close.
**2. Estimated CVD Calculation**
True Cumulative Volume Delta requires tick-by-tick bid/ask order flow data, which is not available on standard TradingView chart feeds. The CVD in this script is explicitly an **Estimated CVD**. It uses the intra-bar close position relative to the high/low range as a mathematical proxy to approximate net buying and selling pressure. A "Session Reset" toggle is included (and recommended) for equities and futures to restart the accumulation daily, mitigating gap-open distortion. Indikator

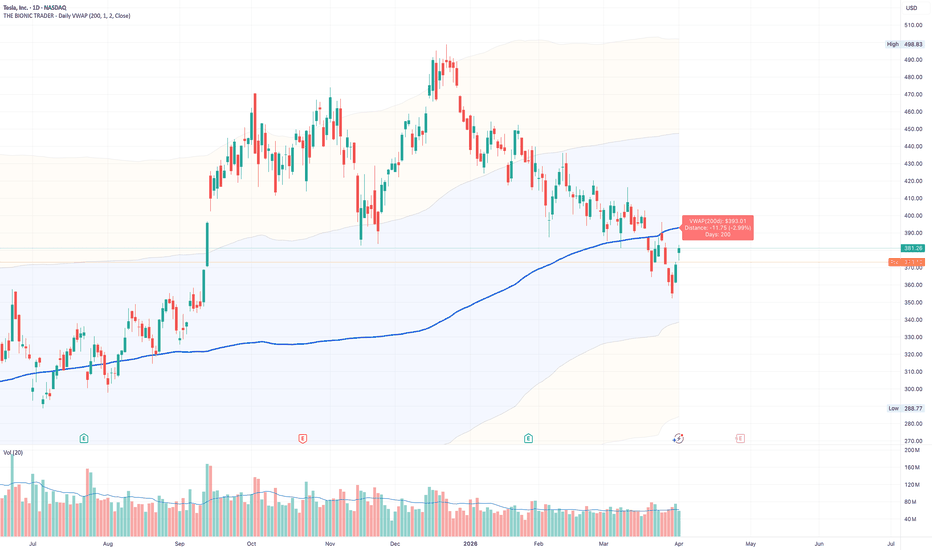
THE BIONIC TRADER - Daily VWAPTHE BIONIC TRADER – Daily VWAP is a long-term Volume-Weighted Average Price indicator that calculates a rolling VWAP across up to 200 daily bars, overlaid on any intraday or daily chart. Unlike session-based VWAP indicators that reset at the start of each trading day, this indicator maintains a continuous rolling window — giving you a macro-level view of where the "fair value" price sits relative to actual traded volume over weeks and months.
How It Works
The indicator fetches daily close prices and daily volume via request.security() and maintains a rolling array of price×volume products. On each new daily bar, the oldest entry is dropped and the newest is added, keeping the calculation window at the user-defined length (default: 200 days). The VWAP is then computed as:
VWAP = Σ(Price × Volume) / Σ(Volume)
Standard deviation bands are calculated using a volume-weighted variance, meaning price deviations are weighted by their respective daily volume — giving higher-volume days a proportionally larger influence on the band width.
Features
Rolling Daily VWAP — configurable from 5 to 200 days
Volume-Weighted Standard Deviation Bands — 1σ and 2σ levels above and below VWAP
Multiple Price Sources — Close, Typical (HLC/3), or HLC3
Dynamic Info Label — displays the current VWAP value, dollar distance, percentage distance, and the active number of days in the calculation window
Color-coded Label — green when price is above VWAP, red when below
Band Fill Zones — subtle shading for the 1σ and 2σ regions
Built-in Alert Conditions — fires on VWAP crossovers, crossunders, and 2σ extensions in both directions
Practical Use Cases
Identify whether a stock is trading at a discount or premium relative to its long-term volume-weighted fair value
Use the 2σ bands as mean reversion zones — extended moves beyond ±2σ historically tend to revert toward the mean
Use the VWAP line as a dynamic support/resistance level on daily and weekly timeframes
Combine with intraday RVOL or gap analysis to assess whether a stock is approaching a significant long-term level
Inputs
Parameter / Default / Description
VWAP Length / 200 / Number of daily bars in the rolling window
Show Bands / true / Toggle standard deviation bands on/off
Band 1 Multiplier / 1.0 / Width of the inner band (1σ)
Band 2 Multiplier / 2.0 / Width of the outer band (2σ)
Price Source / Close / Daily price used for VWAP calculation
Show Info Label / true / Toggle the info label at the last bar
Disclaimer
This indicator is provided for informational and educational purposes only. While every effort has been made to ensure the accuracy of the calculations, the author makes no guarantee of correctness, completeness, or fitness for any particular purpose. The results produced by this script depend on the data provided by your broker/data feed and may differ from other VWAP implementations. This indicator does not constitute financial advice and should not be used as the sole basis for any trading decision. Trading involves substantial risk of loss. Always do your own research and consult a qualified financial advisor before making investment decisions. Past performance is not indicative of future results. Indikator
Indikator
Indikator

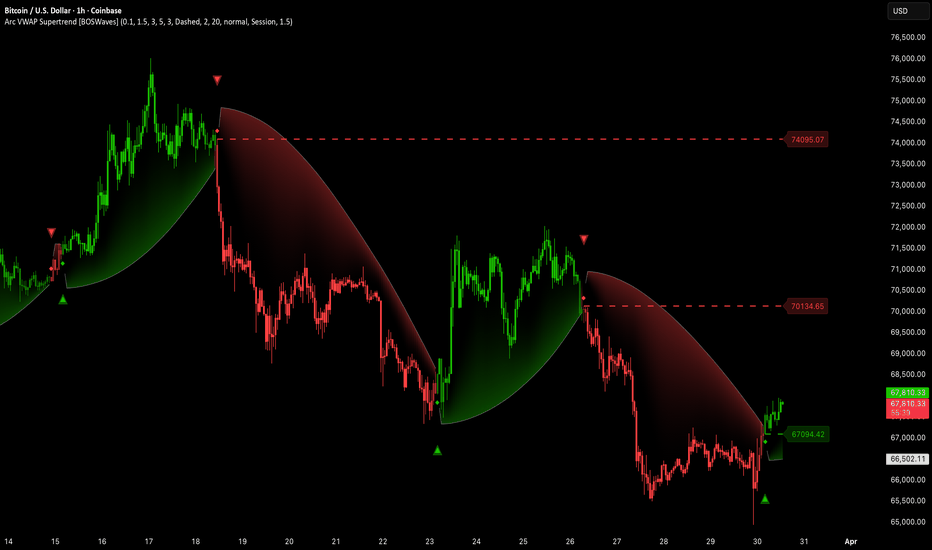
Arc VWAP Supertrend [BOSWaves]Arc VWAP Supertrend - Momentum-Adaptive Trend Engine with VWAP-Confirmed Structure
Overview
Arc VWAP Supertrend is a dynamic trend-following system built around a self-accelerating arc that continuously repositions relative to price, combined with a multi-period VWAP confirmation layer that filters directional flips against prevailing volume-weighted price context.
Rather than applying a static band or fixed multiplier envelope around price, the arc responds to both structural momentum and the distance between price and VWAP. As price extends further from the volume-anchored reference, the arc accelerates its chase, producing tighter trend adherence during high-conviction moves and broader breathing room during consolidation. This creates an inherently adaptive system that scales its sensitivity to actual market behaviour rather than a fixed parameter.
Trend flips are assessed against session, weekly, and monthly VWAP simultaneously. Each flip is classified as confirmed when VWAP agrees with the directional change, or filtered when VWAP context conflicts with the signal, giving traders immediate visibility into the structural quality of each transition without additional overlay indicators.
Conceptual Framework
Arc VWAP Supertrend is built on the premise that trend-following tools should respond proportionally to the conditions they are measuring. A trend system applying identical sensitivity during a low-volatility consolidation and a high-momentum breakout treats structurally different environments as equivalent, introducing unnecessary noise in one context and unacceptable lag in the other.
The arc mechanism addresses this through velocity-based acceleration. When a new trend begins, the arc is placed at a measured ATR distance from price, establishing structural breathing room. From that anchor point it begins accelerating toward price at a rate that scales with VWAP distance, moving faster when price is extended and easing when price is contained near the volume-weighted mean.
Three principles shape the design:
Trend direction should be confirmed by the market's own volume-weighted price context rather than a pure momentum or volatility calculation alone.
Arc sensitivity should increase when price behaviour warrants it and reduce when conditions are contained.
Structural flip levels should be maintained as actionable reference points only while they remain unbroken, disappearing immediately upon invalidation rather than cluttering the chart with historical noise.
Theoretical Foundation
The indicator combines a velocity-accumulating arc engine, ATR-scaled positioning, multi-period VWAP construction, and a distance-normalised acceleration boost into a single cohesive system.
Arc velocity accumulates from zero on each new flip, increasing each smoothing interval by the base acceleration rate scaled by VWAP distance normalisation. This means the arc moves slowly immediately after a flip, when trend conviction is unproven, and progressively faster as the trend matures and price distance from VWAP grows. A slow ATR, calculated across 100 bars, provides a stable volatility reference governing initial arc placement and step size, insulating the system from transient volatility spikes that would otherwise cause erratic repositioning.
VWAP is computed independently across three anchor periods: session, week, and month, each resetting cleanly at its respective boundary. The configurable filter mode allows traders to define which period must agree with a flip, whether any single agreement suffices, or whether full alignment across all three is required before a flip qualifies as confirmed. This creates a spectrum of filtering strictness suited to different trading approaches and timeframe contexts.
Four systems operate in coordination:
Arc Engine : Manages velocity accumulation, step progression, and directional positioning.
VWAP Layer : Handles multi-period construction, distance normalisation, and flip qualification.
Flip Level System : Creates, extends, and instantly removes horizontal structural reference lines.
Visualisation Layer : Renders a candle gradient, cloud fill, and directional markers calibrated to current trend state.
How It Works
Arc VWAP Supertrend processes each bar through a structured sequence of operations:
Initialisation : Occurs once sufficient ATR history exists, placing the arc below price at a configurable ATR multiple and establishing the opening trend direction.
Trend State Logic : Close relative to arc governs trend state each bar, with a close below flipping to bearish and a close above flipping to bullish.
Flip Processing : On each flip, the arc repositions to the opposite side of price at the full starting distance, velocity resets to zero, and a flip level is drawn at the pivot extreme.
Arc Acceleration : The arc begins accelerating toward price at a rate scaled by both the base acceleration input and the current VWAP distance factor, with smoothing applied across a configurable bar window to reduce noise without introducing meaningful structural lag.
VWAP Assessment : Each flip is simultaneously assessed against the selected VWAP filter, classifying transitions as confirmed where VWAP agrees with the new direction, or filtered where VWAP context conflicts.
Flip Level Management : Flip levels extend rightward bar by bar until price closes through them, at which point the line and its associated label are deleted immediately.
Visualisation Update : A candle gradient reflects both trend direction and distance from the arc, with colour intensity increasing as price extends further from the arc surface. A cloud fill between arc and price provides continuous directional context across the full visible chart range.
Interpretation
Arc VWAP Supertrend should be read as a continuous directional framework with structural quality classification at each transition point:
Arc Surface : Functions as dynamic support or resistance depending on trend direction. While price holds above the arc in a bullish trend, the arc traces an accelerating floor beneath the advance. In a bearish trend the arc descends as an accelerating ceiling above price.
Candle Gradient : Communicates extension relative to the arc, with bright candles indicating price is well extended from the arc and faded candles indicating proximity and potential inflection.
Confirmed Flips : Carry the weight of VWAP alignment, where price is not only crossing the arc but doing so from a position consistent with the volume-weighted price context.
Filtered Flips : Warrant additional validation, as VWAP is positioned counter to the new direction. Acting on filtered signals without supplementary confirmation introduces structural risk that confirmed signals do not carry.
Flip Levels : Mark the price at which each directional change originated. While intact they serve as reference boundaries for re-entry, stop placement, and structural assessment. Their immediate removal on breach keeps the chart unambiguous, with only levels of ongoing structural relevance remaining visible.
Cloud Fill Width : Gives a continuous visual measure of how aggressively the arc is tracking the current trend. A narrow cloud indicates close arc proximity and elevated flip risk; a wide cloud reflects a well-developed, momentum-backed trend with the arc accelerating firmly behind price.
Signal Logic & Visual Cues
Arc VWAP Supertrend communicates through four concurrent visual systems:
Arc Line : Traces the current trend boundary, smoothed across the configured window and suppressed at flip bars to avoid visual discontinuity.
Cloud Fill : Grades from the trend colour at arc proximity to full saturation at price, with transparency rendering it unobtrusive during normal trend conditions.
Candle Colouring : Applies a gradient from the current trend colour at low distance to full saturation at high distance, with distance normalised against three ATR units, producing a live visualisation of trend extension directly on the price bars.
Flip Markers : A pair of layered triangles, one solid and one semi-transparent glow, positioned at a configurable ATR offset from the arc to ensure visibility above candle wicks.
Flip Level Lines : Extend from the pivot price rightward until breach, each accompanied by a price label whose size is configurable independently of the line style.
Four alert conditions cover bullish and bearish transitions in both confirmed and filtered states, enabling automated monitoring of trend changes classified by their VWAP context.
Strategy Integration
Arc VWAP Supertrend applies across trend-following, momentum, and structure-based methodologies:
Trailing Reference : The arc surface provides a natural trailing stop. As velocity accumulates and the arc accelerates toward price, it functions as a progressively tightening dynamic stop that responds to the maturity of the move rather than a fixed lookback period.
Tiered Signal Treatment : VWAP confirmation classification allows confirmed flips to trigger immediate action while filtered flips prompt a verification step, building a natural two-tier entry discipline directly into the indicator's output without additional tools.
Pullback Re-entry : Flip levels provide structural anchors for re-entry on pullbacks. A price return toward an intact flip level during a confirmed trend offers a structurally referenced entry point with the arc serving as the invalidation boundary beyond the level.
Position Sizing : The candle gradient supports exposure scaling and risk assessment. Entries taken when candles are faded, indicating close arc proximity, carry greater structural uncertainty than entries aligned with a well-extended, brightly coloured trend.
Multi-Timeframe Application : Higher-timeframe arc direction establishes macro bias while lower-timeframe flip confirmation and VWAP filter classification provide entry precision. Confirmed flips on the lower timeframe aligned with higher-timeframe arc direction represent the highest-quality intersection of the system's outputs.
Technical Implementation Details
Core Engine : Velocity-accumulating arc with ATR-scaled initial placement, step progression, and VWAP distance acceleration boost
VWAP Layer : Independent session, weekly, and monthly VWAP computed from rolling cumulative volume and price-volume, resetting at each period boundary
Filter System : Configurable agreement mode across session, week, month, any, or all VWAP periods with separate confirmed and filtered flip classification
Visualisation : Smoothed arc plot, gradient cloud fill, ATR-normalised candle gradient, layered flip markers, and auto-removing flip level lines with configurable style, width, transparency, and label sizing
Alert Coverage : Bullish confirmed, bearish confirmed, bullish filtered, and bearish filtered flip events
Optimal Application Parameters
Timeframe Guidance:
1 - 15 min : Intraday trend tracking with session VWAP filter for same-day directional context
1H - 4H : Swing trend identification with weekly VWAP filter for multi-session structural alignment
Daily - Weekly : Macro trend positioning with monthly VWAP filter for broad directional confirmation
Suggested Baseline Configuration:
Arc Speed : 0.12
Start Distance : 2.0x
Smoothing : 3
VWAP Filter : Session
VWAP Speed Boost : 1.5
Arrow Offset : 1.2x
These parameters represent a balanced starting point. Instruments with faster characteristic swing cadence benefit from higher arc speed; slower, trend-persistent instruments suit lower values with a higher start distance to avoid premature flips during normal retracements.
Parameter Calibration Notes
Use the following adjustments to refine behaviour without altering the core logic:
Arc flipping too frequently : Raise Start Distance to place the arc further from price on each new trend, requiring a larger adverse move before a flip triggers.
Arc too slow to follow strong trends : Raise Arc Speed or VWAP Speed Boost to increase acceleration rate, particularly on instruments with fast-developing directional moves.
Too many filtered signals : Switch VWAP filter to Any to require only single-period agreement, loosening the confirmation threshold without removing VWAP context entirely.
Too many false confirmed signals : Switch to All to require full agreement across session, weekly, and monthly VWAP before a flip qualifies as confirmed.
Arc visually noisy during consolidation : Raise Smoothing to increase arc averaging, reducing short-term noise at the cost of modest additional lag during transitions.
Flip levels persisting beyond usefulness : Reduce Max Levels to limit the number of active structural references retained simultaneously, concentrating display on the most recent pivot history.
Disclaimer
Arc VWAP Supertrend is a professional-grade trend analysis tool. Directional signals, flip classifications, and arc behaviour reflect historical price and volume relationships and do not constitute assured future outcomes. Performance is dependent on market conditions, instrument characteristics, parameter selection, and disciplined application within a broader analytical framework incorporating risk management, timeframe context, and corroborating analysis. BOSWaves recommends treating this indicator as one component of a structured trading methodology rather than a standalone signal system. Indikator
Indikator

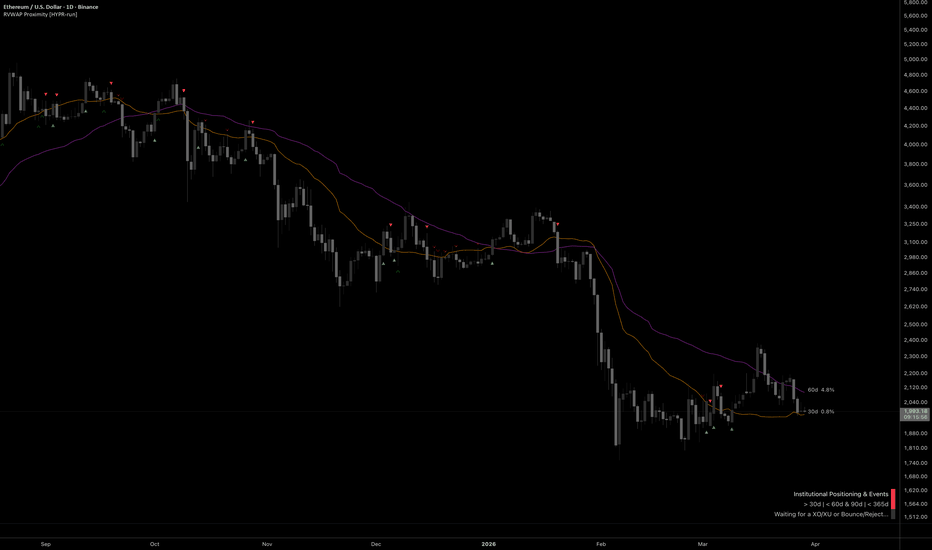
Rolling VWAPs Proximity & Alerts [HYPR-run]DESCRIPTION:
Rolling VWAPs across six time horizons on one chart. See where
volume-weighted fair value sits at chart TF, 7D, 30D, 60D, 90D and 365D
without switching timeframes. Unlike session VWAP that resets daily, rolling
VWAP uses a fixed window that slides forward continuously, giving you
dynamic support/resistance levels that institutional traders watch.
The PROXIMITY filter is the key feature. Turn on all six periods, set a
threshold, and only RVWAPs near current price appear on chart. Far lines
hide automatically; when price approaches, they show up. This keeps charts
clean while making sure you never miss a level that matters.
DISCOVERING EDGE
We have found that the first bounce/reject of a RVWAP is the most reliable and when there is a XO/XU it is a clear sign the boundary is broken. Hence, this indicator has a contextual positioning table of where price is relative to the other lookback periods while highlighting bounces and rejects with XO/XU alert signals.
ROLLING VWAP vs SESSION/ANCHORED VWAP
Session VWAP resets daily and loses all context beyond today.
Anchored VWAP requires picking the "right" date. Rolling VWAP slides
forward continuously across 7D to 365D, showing dynamic fair value
at every institutional time horizon without manual anchoring.
- Proximity filter surfaces only the RVWAPs near current price; far
lines hide automatically and appear as price approaches.
- Events row catches bounces and rejections ranked by period
significance (365D highest); when a key MA and RVWAP sit at the
same price and both bounce, that's institutional-grade confluence.
- Webhook alerts on configurable RVWAP cross with full bar filter;
30D for frequent signals, 90D for swing-level changes, 365D for
the macro signal.
FEATURES
- Six rolling VWAP periods: Chart TF, 7D, 30D, 60D, 90D, 365D
- Proximity filter: only relevant lines appear near price
- Bounce/reject detection at each RVWAP level
- Webhook alerts on selected RVWAP cross (long/short)
- Dashboard: row 1 positioning context (above/below each RVWAP), row 2 live events (bouncing, rejecting, XO, XU)
- Polyline labels with proximity % from price
- Toggle each period independently
- Dashboard dark/light theme toggle for any chart background
HOW IT WORKS
Rolling VWAP calculates cumulative (price x volume) / cumulative volume
over a fixed lookback window. The 30D RVWAP always reflects the last 30
calendar days of volume-weighted price. When price crosses above it, the
market is trading above recent fair value; crossing below means price has
fallen below where volume concentrated. Bounces confirm support holding;
rejects confirm resistance holding.
DASHBOARD
Two-row dynamic dashboard that updates every bar.
- Row 1 (positioning): which RVWAPs price is above or below, grouped with
"&" separators. The 365D RVWAP is separated as the anchor by a pipe.
7-tier color gradient based on how many of the four key RVWAPs
(30d, 60d, 90d, 365d) price is above, with heavyweight distinction
(90d and 365d carry more weight than 30d/60d): bright green (all
four), green (3/4 with both heavyweights), dark green (3/4 missing a
heavyweight), yellow (2/4), dark red (1/4 with a heavyweight), red
(1/4 only lightweight), bright red (none)
- Row 2 (events): up to 3 simultaneous events, most significant period
first (365D → 90D → 60D → 30D → 7D). Bouncing (support holding),
rejecting (resistance holding), XO (crossover), XU (crossunder). Color
intensity maps to event significance. Dark gray when idle
- Runs independently of display toggles; events fire for all periods even
if the line is hidden by the proximity filter
ALERTS
Two alert systems. XO/XU fires when price crosses the selected RVWAP
(default: 30D). Bounce/Reject fires when price wicks into the selected
RVWAP from the correct side and closes confirming support (bounce) or
resistance (reject). Both fire JSON payloads; works with any webhook
receiver.
POSITIONING TABLE (row 1, all 16 configurations)
BADGE COLOR (header, positioning x event combination)
TIMEFRAME RECOMMENDATIONS
- 7D: best on 8hr and below
- 30D: the default, works on most timeframes
- 60D: best on 3-Day and below
- 90D: best on Weekly and below
- 365D: works on Monthly and below
CREDITS
Rolling VWAP calculation: PineCoders/ConditionalAverages library Indikator
Indikator

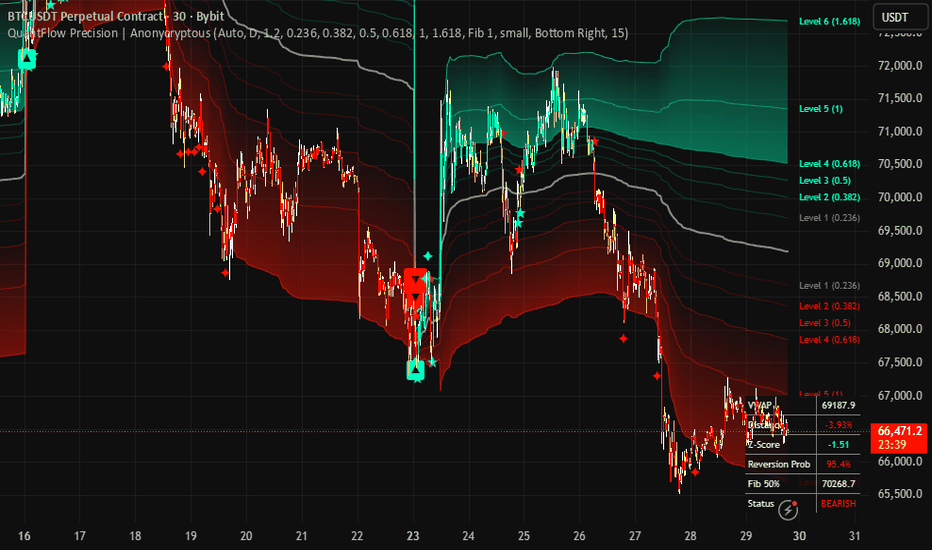
QuantFlow: Precision Fibonacci VWAPQuantFlow: Precision Fibonacci VWAP is a professional-grade institutional trading suite designed for traders who demand quantitative precision. By merging MIDAS (Multidaily Institutional Digital Analysis Support) volume-weighting with Gaussian statistical probability and Fibonacci expansion theory, this indicator provides a comprehensive map of market structure, volatility, and high-probability reversal zones.
█ The Quantitative Core
At the heart of QuantFlow Precison is a sophisticated calculation engine that goes beyond standard moving averages.
MIDAS Engine: Instead of a simple VWAP, QuantFlow Precision utilizes the MIDAS approach, calculating cumulative volume-weighted price from a specific "Anchor Point." This reveals the true average price where institutional orders are concentrated.
Adaptive Anchoring: The "Auto" mode intelligently detects your chart's timeframe to provide the most relevant anchor:
Scalping (1m–15m): Resets Daily to capture intraday liquidity flows.
Intraday (15m–1h): Resets Weekly to identify the current week's "Fair Value."
Swing (Daily+): Resets Monthly or Yearly for long-term trend benchmarks.
█ Strategic Volatility Bands
QuantFlow Precision generates 6 levels of Fibonacci-weighted bands based on volume-weighted standard deviation. These bands act as dynamic support and resistance that expand and contract with market volatility.
Inner Bands (Levels 1-2): Define the "Equilibrium Zone." Price remaining here indicates a ranging market or consolidation.
Expansion Bands (Levels 3-4): Represent confirmed trend momentum.
Extreme Bands (Levels 5-6): These are the 1.0 and 1.618 Fibonacci extensions. When price reaches these levels, it is entering a "statistical extreme," often preceding a sharp mean-reversion.
█ Gaussian Probability Dashboard
The real-time information table provides a professional "heads-up display" (HUD) of current market statistics:
Z-Score Analysis: Measures how many standard deviations the price has moved away from the mean. A Z-Score > 2.0 indicates a move that occurs less than 5% of the time, signaling a potential reversal.
Reversion Probability: Uses the 68-95-99.7 rule to estimate the statistical likelihood of price returning to the VWAP. When the probability hits 99%, the market is at a historical breaking point.
Distance %: Displays the exact percentage gap between current price and "Fair Value."
█ Visual Intelligence System
QuantFlow Precision is designed for high-speed decision-making with a high-contrast UI:
Fluor Green Candles: Confirmed bullish momentum (Price > Upper Fib 1).
Fluor Red Candles: Confirmed bearish momentum (Price < Lower Fib 1).
Grey Candles: Market is in "No-Man's Land" (Ranging within Fib 1/2).
Crossover Stars (★): Tiny star markers appear the moment price reclaims or loses the VWAP line, signaling an immediate shift in institutional control.
Extreme Sparkle Markers (✦): These high-contrast markers trigger when the price pierces the Level 6 (1.618) Fibonacci band. They represent statistical "exhaustion" points where the market has moved into the most extreme 1% of volatility, signaling a high-probability reversal zone.
Target Labels: Every Fibonacci level is labeled on the right side of the chart with its specific level and current price.
█ Trading Applications
The Scalper: Uses the Daily Auto Anchor to trade mean-reversions at the Level 6 sparkle (✦) markers during high-volatility sessions.
The Trend Trader: Enters on a Fluor Green/Red candle change and uses the MIDAS VWAP as a dynamic trailing stop.
The Swing Trader: Sets a Manual Anchor Date on a major news event (e.g., FOMC or Earnings) to track the long-term institutional volume profile.
This indicator is intended for educational and informational purposes only and should not be considered financial advice. Trading involves significant risk, and you should consult with a financial advisor before making any trading decisions. The performance of this indicator is not guaranteed, and past results do not predict future performance. Use at your own risk. Indikator
Strategie

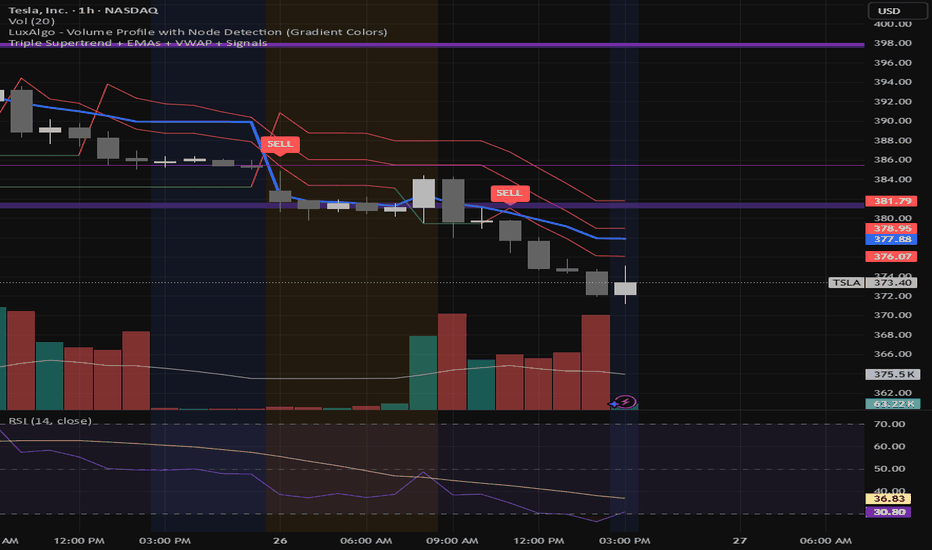
Trifecta Supertrend Indicator Description: Triple Supertrend + EMAs + VWAP + Signals
This indicator combines trend-following and momentum filters to identify high-probability buy and sell signals:
Triple Supertrend Lines:
Fast (10,1), Medium (11,2), Slow (12,3)
Green = bullish, Red = bearish
Signals are generated only when all three Supertrends align, reducing false entries.
EMAs:
9 EMA (white) – short-term momentum
21 EMA (light blue) – medium-term trend
200 EMA (dark red) – long-term trend reference
VWAP (blue):
Auto-anchored, provides dynamic support/resistance
Ensures trades align with intraday value zone
Buy Signal Conditions:
All three Supertrend lines are green
9 EMA > 21 EMA (short-term momentum confirming trend)
Price above VWAP
Sell Signal Conditions:
All three Supertrend lines are red
9 EMA < 21 EMA
Price below VWAP
Dynamic Take Profit (TP) and Stop Loss (SL):
SL: Just beyond slowest Supertrend line (12,3) ± 1 ATR
TP: 1.5 × SL distance from entry, plotted for visual guidance
Visual SL = red line, TP = green line
Allows risk:reward = 1:1.5 per trade Indikator
Indikator