APEX EDGE Smart Money VSA OrderFlowRSI-BBa mixture of things overlaping clouds and bb's to make a uniform decission on direction GLIndikatorvon Bread4DaBreed40
Vortex Nexus Alpha [JOAT]Vortex Nexus Alpha Strategy Introduction The Vortex Nexus Alpha Strategy is an advanced open-source algorithmic trading system that combines multi-dimensional signal generation, adaptive regime detection, and institutional-grade risk management into a unified execution framework. This strategy represents a complete trading system built from the ground up using proprietary mathematical models, fractal analysis, momentum tracking, and market microstructure intelligence. Unlike simple crossoStrategievon officialjackofalltrades192
SMC EMA CROSS ZIG ZAG# Mega Trend Suite – SMC + EMA (Lightweight Edition) **A professional Smart Money Concepts (SMC) toolkit combined with classic EMA crossovers and VWAP.** No Heikin Ashi, no MA Cross EMA – just clean price action, order flow, and trend confirmation. --- ## 🔍 Overview This indicator bundles the most essential tools for **institutional-style analysis**: - ✅ **SMC Structure** (internal & swing BOS/CHoCH) - ✅ **Order Blocks** (bullish/bearish, with box or candle highlight) - ✅ **Fair ValueIndikatorvon Syed_Hussain_K160
TITAN LONG Hunter v6Designed exclusively to detect buy opportunities (LONG) on any asset and timeframe, it combines 6 independent market conditions into a confluence score to filter out false signals and only retain high-probability setups. The 6 Confluence Conditions 1 — Structural Swing Low Detects a confirmed market trough: the candle at position must be lower than all candles within a symmetric window of lookback_sw bars on each side. This is not a simple local minimum — it is a structure point validated afIndikatorvon cedric6641053
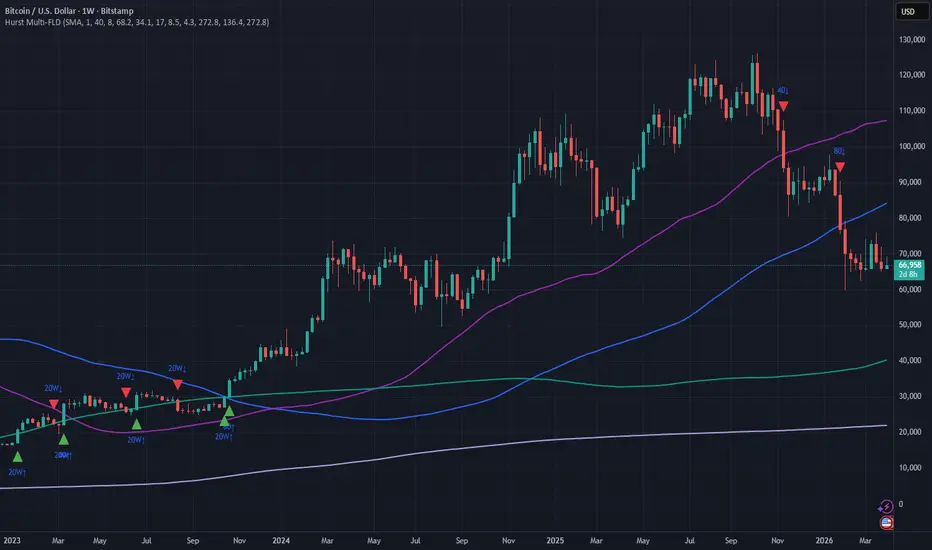
Hurst Cycles Multi-FLD TruSignal Strategies)Hurst Cycles Trading Strategies: A Practical Guide J.M. Hurst's cyclic analysisis one of the most respected methods for timing markets using cycles. It's based on the 10 Core Concepts multiple harmonically related cycles combine to drive price, forming recognizable shapes with synchronized troughs where possible. The core trading tool is the Future Line of Demarcation (FLD) — a smoothed price line displaced forward by ~half the cycle wavelength. Price crossing an FLD reveals phase changes (trougIndikatorvon TruSignal_Strategies30
XAUUSD Elliott - Inmortal Groth ( M15 )¿Por qué esta estrategia? Esta estrategia para el XAUUSD es sin duda la joya de la corona de todo trader que sea profesional y rentable. Algunas de sus características son: Filtro ADX: El ADX > 25 asegura que solo operamos cuando el Oro tiene una dirección clara. Distancia de $18: Hemos alejado el punto de recuperación. Esto evita que el sistema se "asuste" por retrocesos normales de la Onda 2 y promedie demasiado pronto. TP de $45: Cada vez que el bot acierta o el ciclo recupera, la recomStrategievon CharlycalvoesAktualisiert 2140
HTF Candle Direction Strategy V1🔹 Title HTF Candle Direction Strategy V1 🔹 Short Description Higher Timeframe (HTF) bias-based strategy with optional EMA & volume filters and controlled daily execution. 🔹 Full Description 📌 Overview HTF Candle Direction Strategy V1 is a simple yet powerful trend-following strategy that trades in the direction of a selected Higher Timeframe (HTF) candle. The core idea is straightforward: If the HTF candle is bullish → look for BUY trades If the HTF candle is bearish → look for SELL tradeStrategievon dbkumar2026190
Probability Live Table (Juan)The Probability Table Live is an advanced indicator for TradingView designed to display real-time probabilities of price movement for any currency pair and timeframe. This tool organizes the information into a clear and visual table, using intuitive colors to quickly interpret trend strength and the likelihood of continuation or retracement. 🔹 What the chart includes: Mode → Indicates the current trend: UPTREND or DOWNTREND Continuation Rate (Cont. Rate) → Probability that the trend will cIndikatorvon juanpenatradinglcn12
Fractal Velocity Accelerator [JOAT]Fractal Velocity Accelerator Introduction The Fractal Velocity Accelerator is an advanced open-source momentum indicator that combines fractal efficiency measurement, adaptive Laguerre filtering, and Gaussian smoothing to create a multi-dimensional momentum oscillator with institutional-grade signal generation. This indicator transforms raw price data into a sophisticated momentum measurement system that reveals not just momentum direction and strength, but also velocity, acceleration, andIndikatorvon officialjackofalltrades157
Chaos Regime Detection Engine [JOAT]Chaos Regime Detection Engine Introduction The Chaos Regime Detection Engine is an advanced open-source market microstructure indicator that classifies market conditions into distinct regimes using multi-dimensional volatility analysis, directional conviction measurement, and institutional flow detection. This indicator transforms raw market data into actionable regime intelligence, helping traders identify when markets are trending, ranging, chaotic, or experiencing volatility shocks. UnIndikatorvon officialjackofalltrades113
ABCD Harmonic Projection [WillyAlgoTrader]📐 ABCD Harmonic Projection is an overlay indicator that automatically detects ABCD harmonic patterns from ZigZag pivots, validates them against Fibonacci ratio constraints (BC/AB retracement + CD/AB extension), scores each pattern with a 4-factor quality engine (0–100), projects the D-point completion zone, and draws Target and Stop zones with Fibonacci extension and retracement levels — with full TP/SL outcome tracking and separate bull/bear win rate statistics. The ABCD pattern is one of theIndikatorvon WillyAlgoTrader 2.1 K
Risk VXN YurixInterface Structure and Settings:Mode Selection: Implemented via a dropdown list with strict normal numbering in the select button.Default Mode: Option 1 is the rise and fall tracking algorithm. Element Size: All graphical shapes are drawn in small size to avoid obstructing the main chart.Logic and Visualization:Underlying Asset: VXN index (inversely correlated to the tech sector) with a toggle to VIX.Static Levels: Hardcoded horizontal lines at 25, 30, 40, and 50 to track extremes.Color InveIndikatorvon yurius8
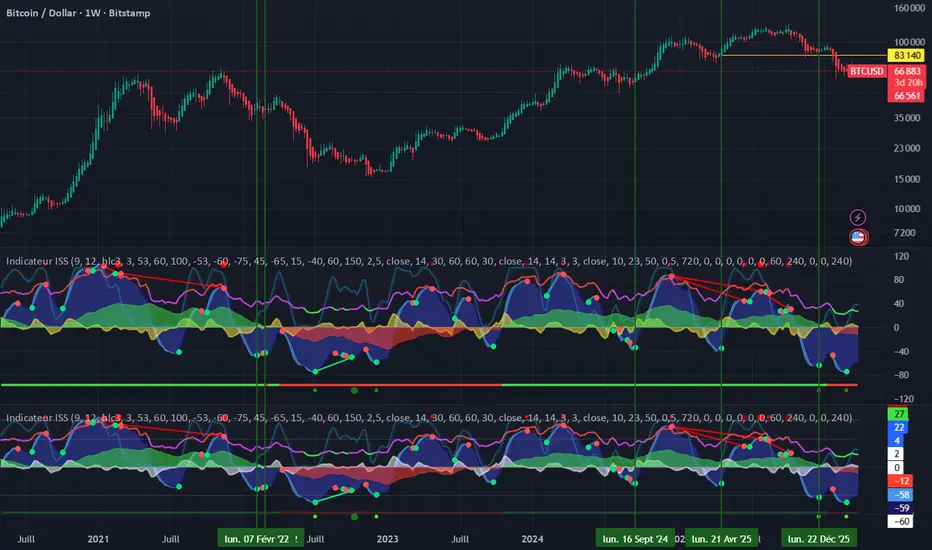
Indicateur ISSThe ISS Indicator is an all-in-one technical analysis tool designed to identify entry and exit opportunities in financial markets (crypto, stocks, indices, forex). It combines several complementary indicators in a single clear interface: 📊 What it contains WaveTrend — detection of bullish/bearish crossings with visual cues (green/red dots) Regular and hidden discrepancies — on WaveTrend, RSI and Stochastic RSI RSI + MFI (Money Flow Index) — colored area indicating buying or selling pressure StoIndikatorvon bourse_rentable27
Universal Impulse Breakout (Avg Body Based) v6it is working for considering the strong movements of price that continues with the breakout of the privious pivot. it is considering the breakout by the last 20 candles and this is changeable in the setting of this indicator.Indikatorvon best_patience_20246
Full Indicador v3.0 - By Claudio HerreraThis script combines several custom indicators to create a configuration that adapts to all timeframes. The Domenec Tunnel, with its custom, modified moving averages, allows us to always know where we stand. The moving averages and correction tapes, calibrated to fit any chart, provide a visual advantage during analysis, enabling us to quickly recognize trends and critical areas. The color-coded indicator adds extra value by highlighting "strength/weakness/doubt" in the movement or direction, asIndikatorvon gucha692153
EZ Oscilator - Live Divergences**How to Trade with EZ Oscillator** The **EZ Oscillator** combines momentum waves with live divergence detection to deliver clear, high-probability trading signals. Here’s how to use it effectively: ### 1. Bullish Signals (Long Entries) - **Bullish Crossover**: Look for the fast wave (wt1) crossing **above** the slow signal wave (wt2) when the signal is below 30. This is a strong momentum reversal signal in oversold territory. - **Bullish Divergence**: A "Bull" label appears when price makes aIndikatorvon TheRealHawkAktualisiert 90
[ A L P H A X ] Elliott Wave Detection & Fibonacci Golden ZoneAlphaX Wave – Elliott Wave Detection, Fibonacci Golden Zone Mapping, Multi-Confluence Scoring & Smart SL/TP System AlphaX Wave is a professional-grade Elliott Wave analysis and trade signal system built on a proprietary multi-engine architecture that fuses automated wave counting, Fibonacci golden zone projection, multi-factor momentum scoring, and structure-based stop loss and target placement into a single cohesive tool. It identifies impulse wave patterns (waves 1–5), detects corrective ABCIndikatorvon AlphaX-Trade7 2.3 K
Displacement Lens [JOAT]Displacement Lens Introduction The Displacement Lens is an advanced open-source momentum analysis indicator that measures real-time displacement intensity by fusing four normalized momentum oscillators with volume-weighted candle body analysis. It produces a composite displacement score displayed as a gradient histogram with adaptive threshold bands, designed to separate institutional displacement candles from retail noise. This is not a simple oscillator mashup — it is a unified displacemIndikatorvon officialjackofalltrades74
Gold Cycle + MTF Gold Cycle & Multi-Timeframe (MTF) Candlestick Dashboard This Pine Script indicator is a specialized suite designed specifically for XAUUSD (Gold) traders. It combines the precision of Market Cycle Analysis with the structural clarity of Multi-Timeframe (MTF) visualization to provide a comprehensive view of gold’s unique price action. Key Features Gold Cycle Algorithm: Uses a proprietary calculation tailored to gold’s volatility to identify cyclical highs and lows. This helps traders spot potenIndikatorvon tossaponb31
Singularity Convergence Protocol [JOAT]Singularity Convergence Protocol Introduction The Singularity Convergence Protocol is an advanced open-source multi-system confluence strategy that combines eight distinct analytical methodologies into a unified trading system. This strategy integrates momentum analysis, Smart Money Concepts, velocity waves, liquidity tracking, trend detection, divergence analysis, volatility measurement, and institutional flow into a comprehensive decision-making engine that generates high-probability tradStrategievon officialjackofalltrades25
Phantom Whale Hunter [JOAT]Phantom Whale Hunter Introduction The Phantom Whale Hunter is an advanced open-source institutional footprint tracking system that combines Chaikin Money Flow, Money Flow Index, On-Balance Volume, VWAP analysis, and Accumulation/Distribution to detect institutional buying and selling pressure. This indicator reveals when large institutional players (whales) are accumulating or distributing positions, providing traders with insights into smart money positioning before major price moves occurIndikatorvon officialjackofalltrades2132
Turbulence Fractal Scanner [JOAT]Turbulence Fractal Scanner Introduction The Turbulence Fractal Scanner is an advanced open-source volatility chaos prediction engine that combines ATR, Bollinger Band Width, Keltner Channels, Historical Volatility, and Squeeze detection into a unified volatility analysis system. This indicator measures market turbulence across multiple dimensions, creating a comprehensive volatility index that reveals expansion/contraction cycles, squeeze conditions, and breakout predictions. Unlike singlIndikatorvon officialjackofalltrades159
Divergence Constellation [JOAT]Divergence Constellation Introduction The Divergence Constellation is an advanced open-source multi-oscillator divergence detection system that combines RSI, MACD, TSI, and Stochastic analysis with sophisticated pivot detection and confluence scoring. This indicator identifies both regular and hidden divergences across multiple oscillators simultaneously, creating a constellation of divergence signals that reveal potential reversals and trend continuations with high probability. Unlike siIndikatorvon officialjackofalltrades51
Elliott Wave Detector PRO [TGTBTB]Elliott Wave Advanced v3 — Validated Wave Counting with Pattern Detection A word before you start Elliott Wave is supposedly one of the most powerful frameworks in technical analysis — and also one of the most difficult to apply correctly. The theory involves layers of rules, guidelines, pattern variations, and degree relationships that even experienced practitioners argue about. Automating it is genuinely hard, and no indicator (including this one) will get every count right every time. I Indikatorvon GoodBadBitcoinAktualisiert 33 3.5 K