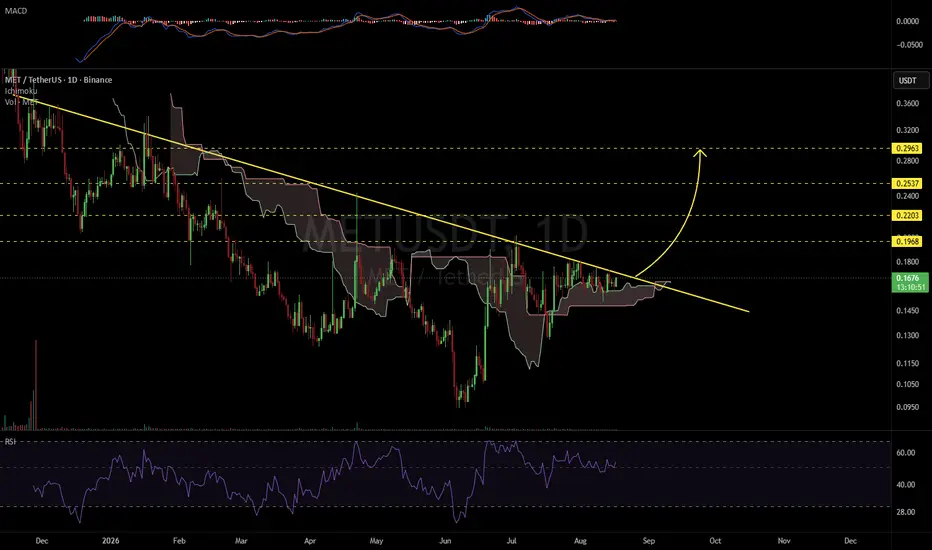
METUSDT 1D#MET is trading above the Ichimoku Cloud and is on the verge of breaking above the descending resistance on the daily timeframe. A confirmed breakout could trigger a bullish move toward the following upside targets:
🎯 $0.1968
🎯 $0.2203
🎯 $0.2537
🎯 $0.2963
⚠️ Always use a tight stop-loss and apply
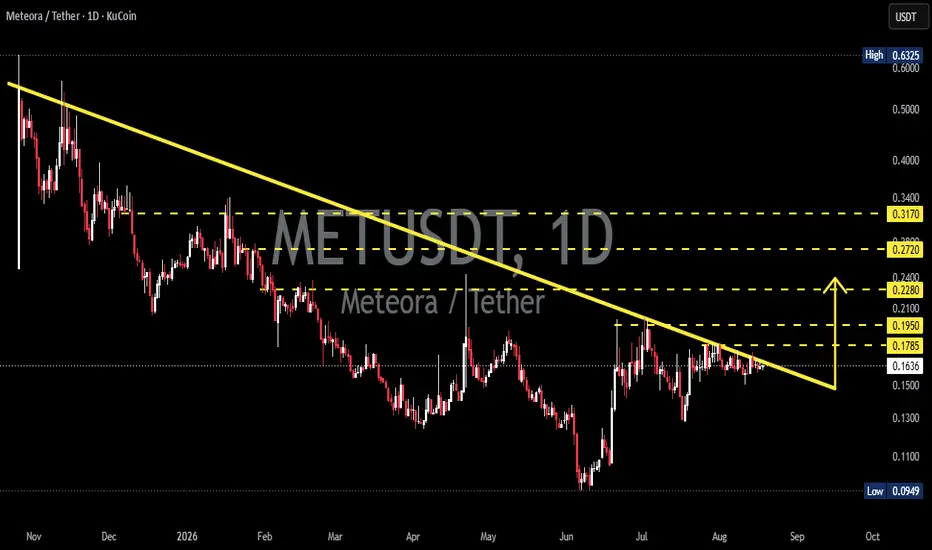
METEORA - Breakout Loading? Descending Trendline Under Pressure!📊 Market Overview Meteora (MET) on the 1D timeframe is still in a medium-term bearish structure, but the price is currently showing consolidation right below the Descending Trendline.
The price is around $0.1633, making the trendline the key resistance currently being tested.
🔎 Key observation: th
Meteora MET price analysis#Meteora #MET is one of those projects that simply feels interesting.
Looking at the OKX:METUSDT chart, one detail stands out. Every attempt to break the long-term trendline is happening with a smaller swing, while each rejection is followed by a weaker pullback. Sellers seem to be losing momentum
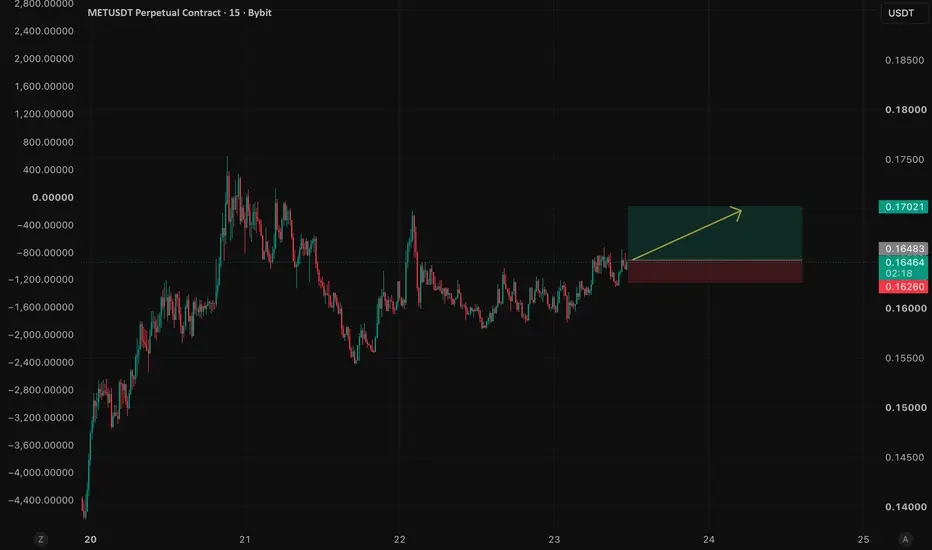
METUSDT: Bullish Breakout Opens the Door for Further UpsideMETUSDT is showing signs of strengthening momentum after reclaiming a key support zone and forming a series of higher lows. Buyers remain in control as price continues to hold above the recent breakout area, suggesting the uptrend may have further room to develop.
As long as 0.16260 holds as suppor
Is MET Building Momentum Again? A Look at the analysis.MET seems to be moving again. One thing I like about this chart is that it's finally showing signs of life after spending days trapped inside a heavy accumulation range.
According to the 4H chart, MET has shown a notable recovery after printing a local bottom around $0.128-$0.130, followed by a str
METUSDT Forming Bullish MomentumMETUSDT is forming a clear bullish momentum pattern, a classic bullish wave signal that often indicates an upcoming breakout. The price has been consolidating within a narrowing range, suggesting that selling pressure is gradually weakening while buyers are beginning to regain control. With consiste
METUSDT Forming Bullish MomentumMETUSDT is forming a clear bullish momentum pattern, a classic bullish wave signal that often indicates an upcoming breakout. The price has been consolidating within a narrowing range, suggesting that selling pressure is weakening while buyers are beginning to regain control. With consistent trading
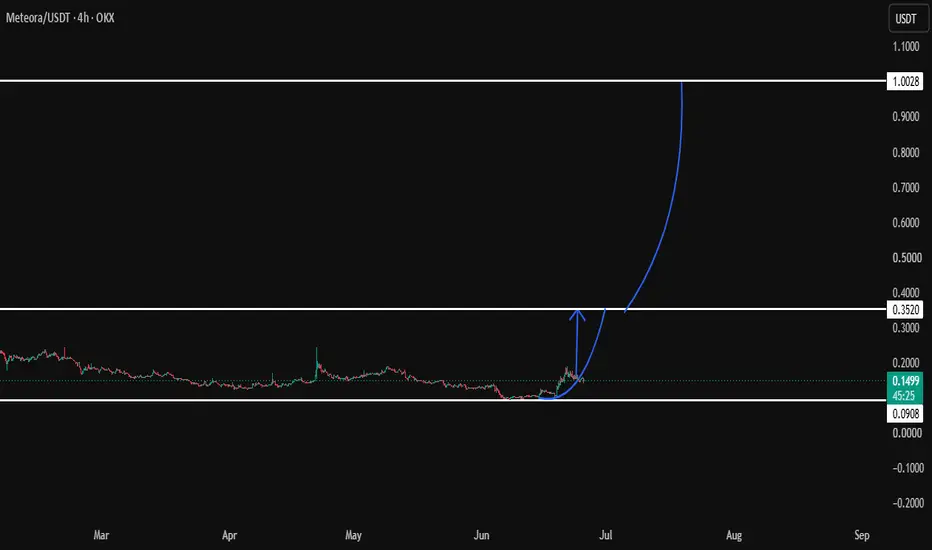
METAORA (METUSDT) CAN BECOME THE NEXT 1 USD+ GOLDEN TOKENDepending on cycle trend and accumulation zone following, MET:USDT showing an interesting view, which explains that there is high chance of a breakout followed by entering new cycle trend, which is even runing now, this can be the start of someting great, and even 1 usd breakout is a possiblity we c
METEORA (MET/USDT) — the Beginning of a Major Reversal?The MET/USDT chart on the 1D timeframe shows that price has been in a prolonged downtrend since reaching its peak around $0.63. Over the past several months, price has consistently formed Lower Highs (LH) and Lower Lows (LL), confirming strong seller dominance.
However, market conditions are beginn
See all ideas
Summarizing what the indicators are suggesting.
Oscillators
Neutral
SellBuy
Strong sellStrong buy
Strong sellSellNeutralBuyStrong buy
Oscillators
Neutral
SellBuy
Strong sellStrong buy
Strong sellSellNeutralBuyStrong buy
Summary
Neutral
SellBuy
Strong sellStrong buy
Strong sellSellNeutralBuyStrong buy
Summary
Neutral
SellBuy
Strong sellStrong buy
Strong sellSellNeutralBuyStrong buy
Summary
Neutral
SellBuy
Strong sellStrong buy
Strong sellSellNeutralBuyStrong buy
Moving Averages
Neutral
SellBuy
Strong sellStrong buy
Strong sellSellNeutralBuyStrong buy
Moving Averages
Neutral
SellBuy
Strong sellStrong buy
Strong sellSellNeutralBuyStrong buy
Displays a symbol's price movements over previous years to identify recurring trends.