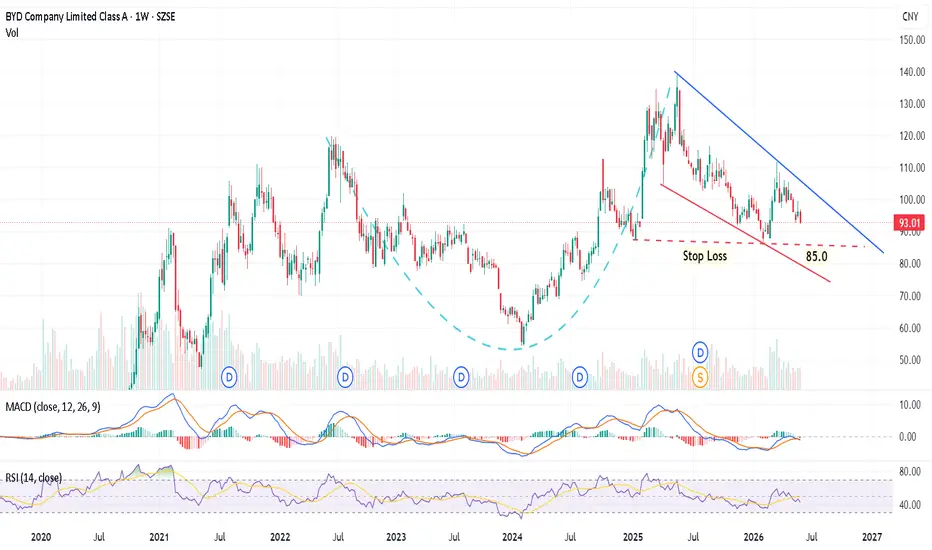
Weekly Chart -  002594
Market Structure & Price Action
Indicators & Volume
Trading Idea
002594 Market Structure & Price Action
- Macro Pattern: A massive multi-year Rounded Bottom completed its base from late 2022 through mid-2025.
- Current Phase: Price is currently locked in a downward-sloping consolidation channel (Handle formation) below major psychological resistance.
- Support/Resistance: The lower bound of the handle is finding structural support near the 85.0 level. A descending resistance line (blue) caps the current upside momentum.
Indicators & Volume
- Volume: Volume is steadily contracting during this multi-month pullback, confirming a healthy consolidation phase rather than aggressive distribution.
- MACD (12, 26, 9): Sitting slightly below the zero-line with flat histogram bars, indicating a temporary loss of bearish momentum and a compression phase before the next major expansion.
- RSI (14): Currently tracking neutral at 43.02, leaving ample room for an upside move once buying volume triggers.
Trading Idea
- Entry Strategy: Look for a decisive weekly close above the descending blue trendline (currently intersecting around 94.0–95.0) to confirm the breakout of the handle. Alternative entry on a verified test of the 85.0 support zone.
- Target: Upside projection points toward the previous structural highs near 120.0, followed by a long-term target at 140.0.
- Stop Loss: A strict exit should be placed just below the structural support floor at 85.0.

Exención de responsabilidad
La información y las publicaciones no constituyen, ni deben considerarse como, asesoramiento o recomendaciones financieras, de inversión, de trading u otro tipo, proporcionadas o respaldadas por TradingView. Obtenga más información en Condiciones de uso.
Exención de responsabilidad
La información y las publicaciones no constituyen, ni deben considerarse como, asesoramiento o recomendaciones financieras, de inversión, de trading u otro tipo, proporcionadas o respaldadas por TradingView. Obtenga más información en Condiciones de uso.