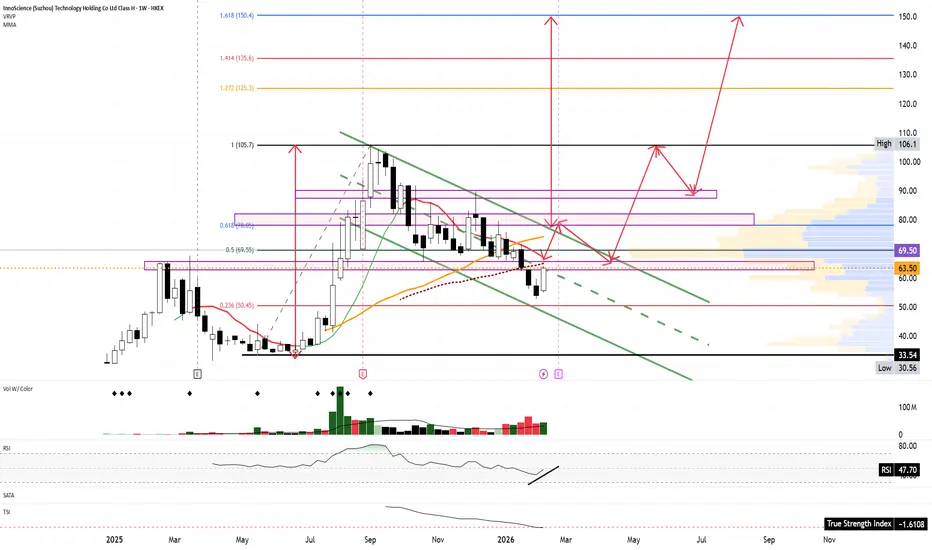
Company profile:  2577 Innoscience Technology is a semiconductor company focused mainly on the development and production of gallium nitride (GaN) power devices. GaN technology is increasingly used in fast chargers, power supplies, electric vehicles, data centers, and renewable energy systems because it allows for higher efficiency and smaller components compared to traditional silicon-based solutions.
Chart timeframe: Weekly
This analysis is based on the weekly chart, which means each candle represents one week of trading. Weekly charts are typically used for medium- to long-term investment decisions rather than short-term trading.
Current Technical Structure
After a strong upward move in mid-2025 (the “flagpole”), the stock entered a controlled downward-sloping consolidation channel. This structure resembles a bull flag pattern, which is generally considered a bullish continuation formation.
Bull Flag Pattern
• The strong rally from approximately 30 HKD up to around 105 HKD forms the flagpole.
• The subsequent downward channel represents the flag consolidation.
• Price is currently near the lower-middle part of this consolidation.
If this is indeed a confirmed bull flag, the theoretical price target is calculated by measuring the height of the flagpole and projecting it upward from the breakout point.
• Flagpole height: roughly 70 HKD (approx. 35 → 105)
• Potential breakout zone: around 80 HKD
• Projected target: around 150 HKD
This aligns with the 1.618 Fibonacci extensions near 150 HKD.
However, it is important to wait for confirmation (clear breakout with strong weekly volume).
Key Support Levels:
1. 48–50 HKD zone. Around 48.40 HKD (0.236 Fibonacci). This is a major long-term support. A breakdown below this level would weaken the bullish structure significantly.
Key Resistance Levels
1. 80–82 HKD zone. Around 80.15 HKD (0.618 Fibonacci retracement). This is the most important resistance to break in order to confirm the bull flag scenario.
2. 105–110 HKD zone. Previous major high (~106 HKD).This is strong historical resistance.
Indicators
• RSI (around 47): Neutral zone, slightly below 50, suggesting neither overbought nor oversold conditions. There is a small upward turn forming, which could indicate momentum improvement.
• Volume: No explosive breakout volume yet — confirmation will require strong weekly volume expansion.
• Trendlines: Price remains inside a descending channel, typical for flag consolidation.
Fundamental Timing Consideration
The company is expected to release earnings soon. This is important because:
• Earnings can act as a catalyst for a breakout.
• They can also invalidate the pattern if results disappoint.
It may be safer to wait for either:
• A confirmed breakout above 80–82 HKD with strong volume, or
• A clear reaction to earnings before taking a larger position.
Summary:
• The weekly chart shows a potential bull flag pattern, which is generally bullish.
• Key breakout level: around 80 HKD.
• Key support zone: 48-50 HKD.
• Long-term target (if confirmed): around 140–150 HKD.
• Earnings release is a near-term risk factor.
• No confirmation yet — patience is required.
• After breaking out: stop loss, the low of a breaking-out candle
• Take profit: 140-150.
2577 Innoscience Technology is a semiconductor company focused mainly on the development and production of gallium nitride (GaN) power devices. GaN technology is increasingly used in fast chargers, power supplies, electric vehicles, data centers, and renewable energy systems because it allows for higher efficiency and smaller components compared to traditional silicon-based solutions.Chart timeframe: Weekly
This analysis is based on the weekly chart, which means each candle represents one week of trading. Weekly charts are typically used for medium- to long-term investment decisions rather than short-term trading.
Current Technical Structure
After a strong upward move in mid-2025 (the “flagpole”), the stock entered a controlled downward-sloping consolidation channel. This structure resembles a bull flag pattern, which is generally considered a bullish continuation formation.
Bull Flag Pattern
• The strong rally from approximately 30 HKD up to around 105 HKD forms the flagpole.
• The subsequent downward channel represents the flag consolidation.
• Price is currently near the lower-middle part of this consolidation.
If this is indeed a confirmed bull flag, the theoretical price target is calculated by measuring the height of the flagpole and projecting it upward from the breakout point.
• Flagpole height: roughly 70 HKD (approx. 35 → 105)
• Potential breakout zone: around 80 HKD
• Projected target: around 150 HKD
This aligns with the 1.618 Fibonacci extensions near 150 HKD.
However, it is important to wait for confirmation (clear breakout with strong weekly volume).
Key Support Levels:
1. 48–50 HKD zone. Around 48.40 HKD (0.236 Fibonacci). This is a major long-term support. A breakdown below this level would weaken the bullish structure significantly.
Key Resistance Levels
1. 80–82 HKD zone. Around 80.15 HKD (0.618 Fibonacci retracement). This is the most important resistance to break in order to confirm the bull flag scenario.
2. 105–110 HKD zone. Previous major high (~106 HKD).This is strong historical resistance.
Indicators
• RSI (around 47): Neutral zone, slightly below 50, suggesting neither overbought nor oversold conditions. There is a small upward turn forming, which could indicate momentum improvement.
• Volume: No explosive breakout volume yet — confirmation will require strong weekly volume expansion.
• Trendlines: Price remains inside a descending channel, typical for flag consolidation.
Fundamental Timing Consideration
The company is expected to release earnings soon. This is important because:
• Earnings can act as a catalyst for a breakout.
• They can also invalidate the pattern if results disappoint.
It may be safer to wait for either:
• A confirmed breakout above 80–82 HKD with strong volume, or
• A clear reaction to earnings before taking a larger position.
Summary:
• The weekly chart shows a potential bull flag pattern, which is generally bullish.
• Key breakout level: around 80 HKD.
• Key support zone: 48-50 HKD.
• Long-term target (if confirmed): around 140–150 HKD.
• Earnings release is a near-term risk factor.
• No confirmation yet — patience is required.
• After breaking out: stop loss, the low of a breaking-out candle
• Take profit: 140-150.

Exención de responsabilidad
La información y las publicaciones no constituyen, ni deben considerarse como, asesoramiento o recomendaciones financieras, de inversión, de trading u otro tipo, proporcionadas o respaldadas por TradingView. Obtenga más información en Condiciones de uso.
Exención de responsabilidad
La información y las publicaciones no constituyen, ni deben considerarse como, asesoramiento o recomendaciones financieras, de inversión, de trading u otro tipo, proporcionadas o respaldadas por TradingView. Obtenga más información en Condiciones de uso.