
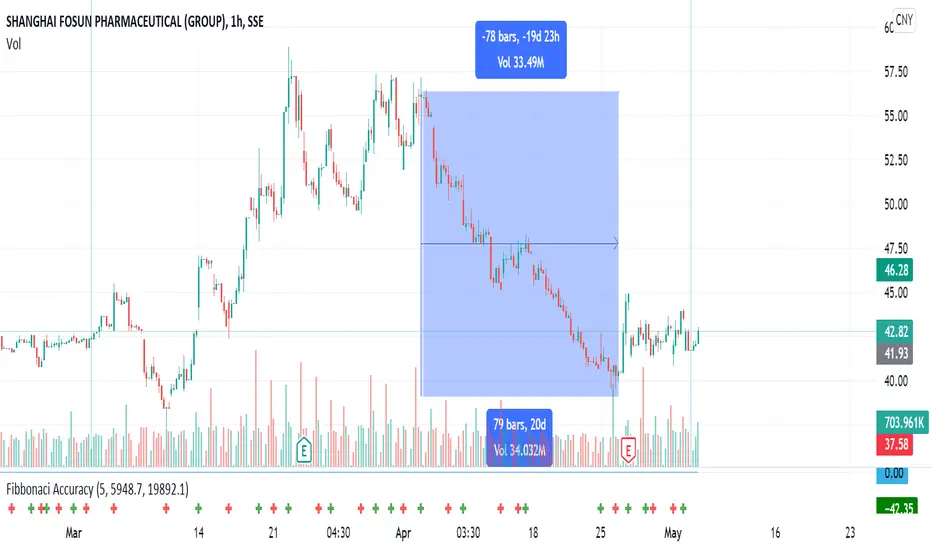
Fibonacci retracement with recent high and lows
The percentage retracements identify possible support or resistance areas, 23.6%, 38.2%, 50%, 61.8%, 100%. Applying these percentages to the difference between the high and low price for the period selected creates a set of price objectives.
Depending on the direction of the market, up or down, prices will often retrace a significant portion of the previous trend before resuming the move in the original direction.
These countertrend moves tend to fall into certain parameters, which are often the Fibonacci Retracement levels.
The percentage retracements identify possible support or resistance areas, 23.6%, 38.2%, 50%, 61.8%, 100%. Applying these percentages to the difference between the high and low price for the period selected creates a set of price objectives.
Depending on the direction of the market, up or down, prices will often retrace a significant portion of the previous trend before resuming the move in the original direction.
These countertrend moves tend to fall into certain parameters, which are often the Fibonacci Retracement levels.

Exención de responsabilidad
La información y las publicaciones no constituyen, ni deben considerarse como, asesoramiento o recomendaciones financieras, de inversión, de trading u otro tipo, proporcionadas o respaldadas por TradingView. Obtenga más información en Condiciones de uso.
Exención de responsabilidad
La información y las publicaciones no constituyen, ni deben considerarse como, asesoramiento o recomendaciones financieras, de inversión, de trading u otro tipo, proporcionadas o respaldadas por TradingView. Obtenga más información en Condiciones de uso.