
My dear followers,
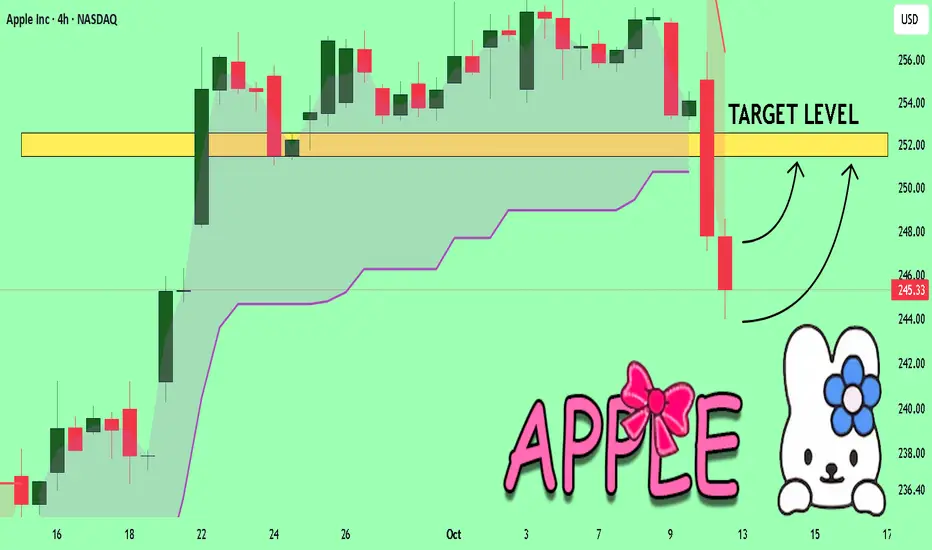
I analysed this chart on APPLE and concluded the following:
The market is trading on 245.33 pivot level.
Bias - Bullish
Technical Indicators: Both Super Trend & Pivot HL indicate a highly probable Bullish continuation.
Target - 251.49
About Used Indicators:
A super-trend indicator is plotted on either above or below the closing price to signal a buy or sell. The indicator changes color, based on whether or not you should be buying. If the super-trend indicator moves below the closing price, the indicator turns green, and it signals an entry point or points to buy.
Disclosure: I am part of Trade Nation's Influencer program and receive a monthly fee for using their TradingView charts in my analysis.
———————————
WISH YOU ALL LUCK
Operación activa
Awesome idea and already in the money!Operación cerrada: objetivo alcanzado
Rejoice, for the target was hit!

❤️TraderGirl Free Telegrm:
t.me/anabelsignals
💁🏼♀️Say hi to me in telegram:
t.me/anabelsignalscontact
t.me/anabelsignals
💁🏼♀️Say hi to me in telegram:
t.me/anabelsignalscontact
Publicaciones relacionadas
Exención de responsabilidad
La información y las publicaciones no constituyen, ni deben considerarse como, asesoramiento o recomendaciones financieras, de inversión, de trading u otro tipo, proporcionadas o respaldadas por TradingView. Obtenga más información en Condiciones de uso.