
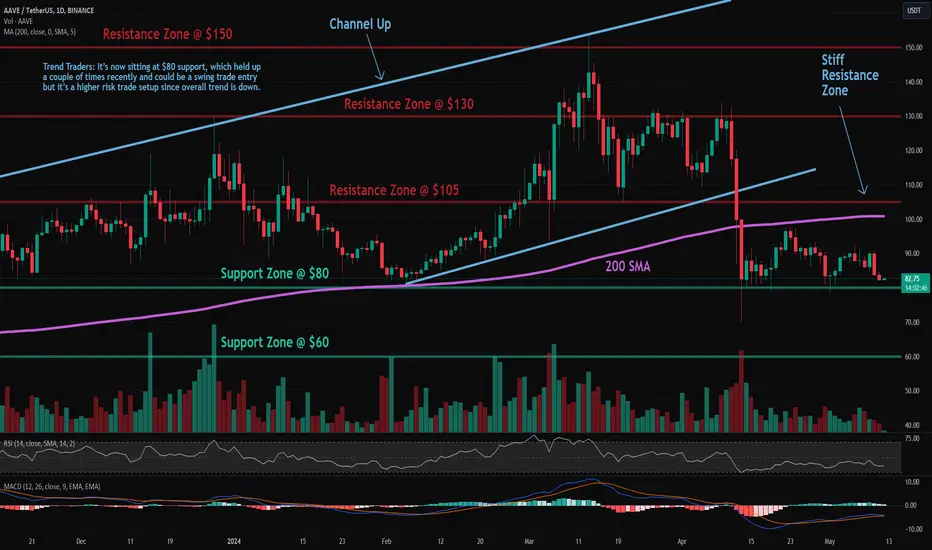
Trade setup: Trends are mixed to down. After a bearish breakout from a Channel Up pattern, price broke below 200-day moving average, which is a sign of downtrend.
Trend Traders: It’s now sitting at $80 support, which held up a couple of times recently and could be a swing trade entry but it’s a higher risk trade setup since overall trend is down. Price needs to break back above 200-day MA (~$100) to resume its uptrend.
Trend: Downtrend across all time horizons (Short- Medium- and Long-Term).
Momentum is Mixed as MACD Line is above MACD Signal Line (Bullish) but RSI < 45 (Bearish). MACD Histogram bars are declining, which suggests that momentum is weakening.
Support and Resistance: Nearest Support Zone is $80, then $60. The nearest Resistance Zone is $105 (previous support), then $130 and $150.

Exención de responsabilidad
La información y las publicaciones no constituyen, ni deben considerarse como, asesoramiento o recomendaciones financieras, de inversión, de trading u otro tipo, proporcionadas o respaldadas por TradingView. Obtenga más información en Condiciones de uso.
Exención de responsabilidad
La información y las publicaciones no constituyen, ni deben considerarse como, asesoramiento o recomendaciones financieras, de inversión, de trading u otro tipo, proporcionadas o respaldadas por TradingView. Obtenga más información en Condiciones de uso.