 ABNB — Watching This Setup
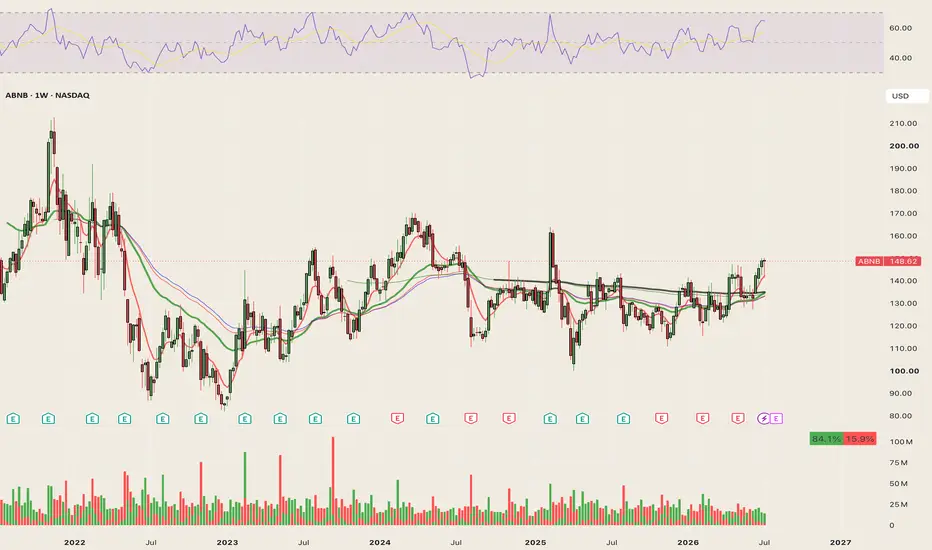
Weekly chart, price reclaiming $148.62 after a two-year range.
- Broke down from ~$170 in 2022, bottomed near $85 in early 2023
- Spent 2024–2026 chopping in a $110–$140 range
- Just pushed above that range on rising volume
Why this matters. A multi-year range breakout is one of the cleanest technical signals — it means supply that capped price for two years just got absorbed. Doesn't confirm a trend by itself, but it's the first sign to take seriously.
What we're watching. Does price hold above the old range (~$140) on a pullback, or is this a fakeout back into the chop? That retest is the tell, not this breakout candle.
Status: watchlist only. No position. No structure picked yet. This is chart study, not a trade call.
*Educational content, not financial advice.*

Exención de responsabilidad
La información y las publicaciones no constituyen, ni deben considerarse como, asesoramiento o recomendaciones financieras, de inversión, de trading u otro tipo, proporcionadas o respaldadas por TradingView. Obtenga más información en Condiciones de uso.
Exención de responsabilidad
La información y las publicaciones no constituyen, ni deben considerarse como, asesoramiento o recomendaciones financieras, de inversión, de trading u otro tipo, proporcionadas o respaldadas por TradingView. Obtenga más información en Condiciones de uso.