Continuation via Symmetrical Triangle
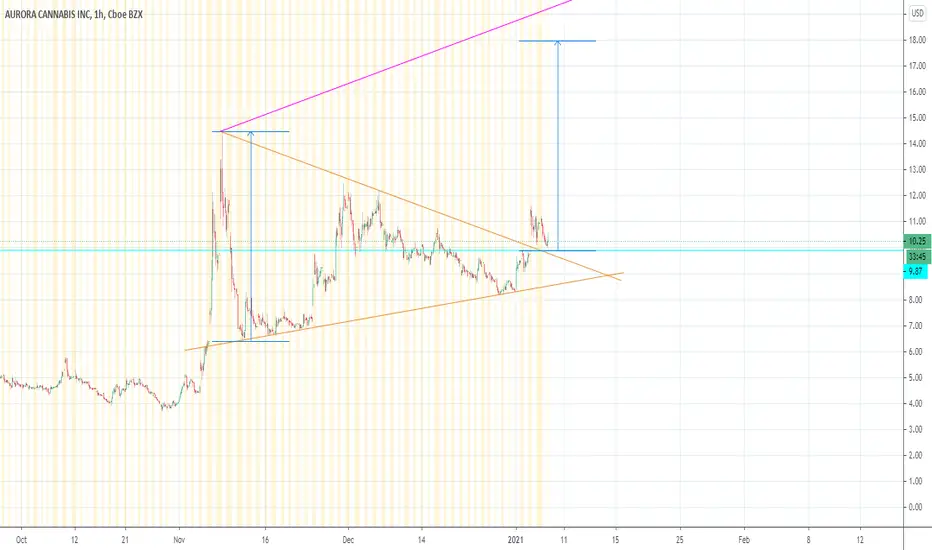
Hourly chart showing ACB making higher lows and lower highs to form a symmetrical triangle. Potential trend continuation following a breakout of the triangle, and back test of the upper trendline of the triangle. See SunRun,  RUN for a similar setup and how it can play out. GLTA!
Exención de responsabilidad
La información y las publicaciones no constituyen, ni deben considerarse como, asesoramiento o recomendaciones financieras, de inversión, de trading u otro tipo, proporcionadas o respaldadas por TradingView. Obtenga más información en Condiciones de uso.
Exención de responsabilidad
La información y las publicaciones no constituyen, ni deben considerarse como, asesoramiento o recomendaciones financieras, de inversión, de trading u otro tipo, proporcionadas o respaldadas por TradingView. Obtenga más información en Condiciones de uso.