
Hey Trader!
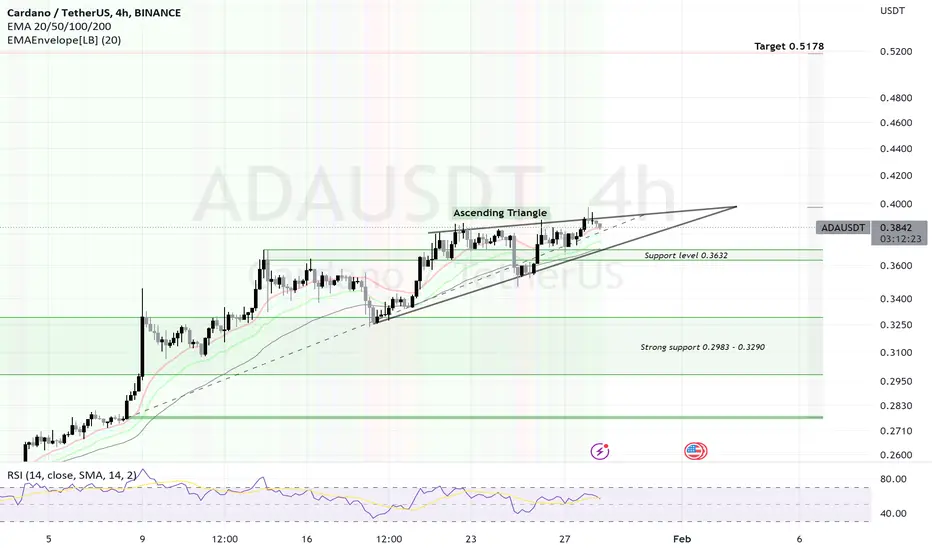
This analysis is based on the Ascending Triangle concept, which is formed by the price of Cardano. In the analysis two support levels are visualized; Strong support at 0.2983 - 0.3290, allocating back to mid-December, and the support level at 0.3632. As the drawn triangle shows, the price follows bullish also called an "Ascending Triangle". This triangle combined with the Fibonacci tool can create a true picture of how the price of Cardano may land at the target at 0.5178.
I hope this analysis helped to give an instructive picture of Cardano's evolution and can be taken into consideration for the current situation as well as the future.

Exención de responsabilidad
La información y las publicaciones no constituyen, ni deben considerarse como, asesoramiento o recomendaciones financieras, de inversión, de trading u otro tipo, proporcionadas o respaldadas por TradingView. Obtenga más información en Condiciones de uso.
Exención de responsabilidad
La información y las publicaciones no constituyen, ni deben considerarse como, asesoramiento o recomendaciones financieras, de inversión, de trading u otro tipo, proporcionadas o respaldadas por TradingView. Obtenga más información en Condiciones de uso.