
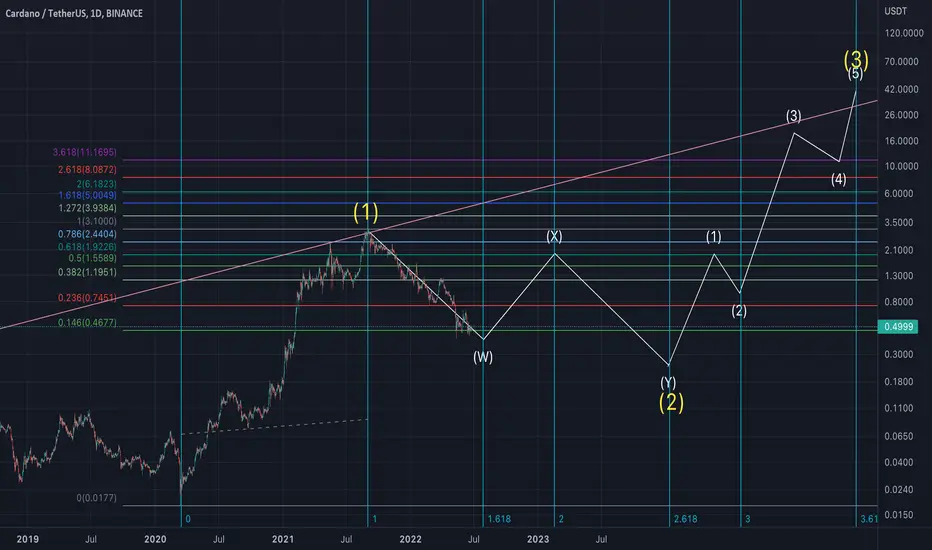
Tried to make this line up with fib times. W & Y are about equal in time and degree, this is assuming BTC rallies into the end of the year and bottoms in 2023 and that alts bottom a few months after it. The primary (3) impulse is taken from primary (1), added previous ATH trendline which seemed like it could be significant. Let me know what you think!
Definitely not accurate do not invest based on this, especially exact targets!!!
Just a general longer time frame idea, I am noob
Definitely not accurate do not invest based on this, especially exact targets!!!
Just a general longer time frame idea, I am noob
Nota
Nailed the bottom. Didnt quite get the bounce on the way down but whatever
Lets see if we're moving in sub waves of a larger wave 3 now or some kind of extended correction

Exención de responsabilidad
La información y las publicaciones no constituyen, ni deben considerarse como, asesoramiento o recomendaciones financieras, de inversión, de trading u otro tipo, proporcionadas o respaldadas por TradingView. Obtenga más información en Condiciones de uso.
Exención de responsabilidad
La información y las publicaciones no constituyen, ni deben considerarse como, asesoramiento o recomendaciones financieras, de inversión, de trading u otro tipo, proporcionadas o respaldadas por TradingView. Obtenga más información en Condiciones de uso.