
hi traders,
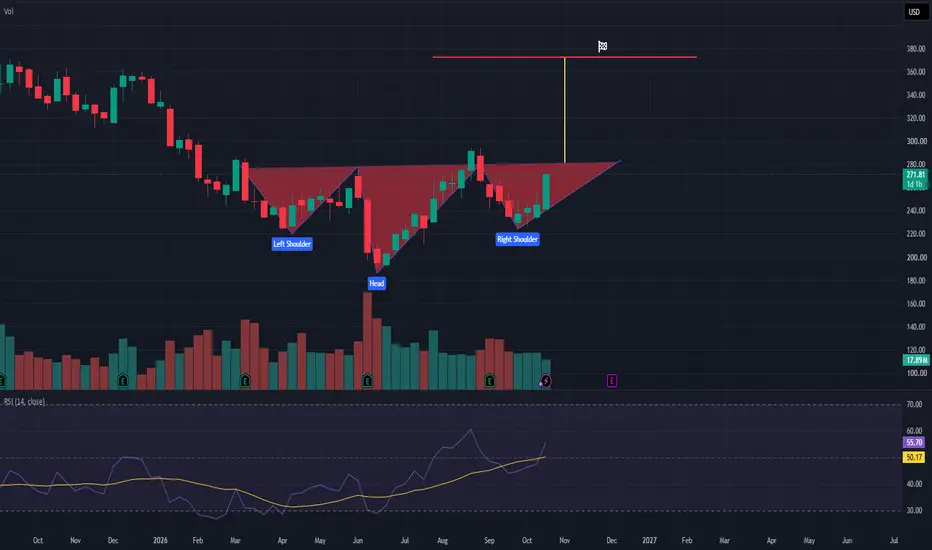
This trade setup highlights a classic Inverted Head and Shoulders (iH&S) reversal pattern on the weekly time frame for Adobe Inc. (ADBE).
The pattern marks a transition from a multi-month markdown phase to a potential long-term bullish trend reversal.
Chart Structure Breakdown:
Left Shoulder: Formed around ~$230–$240, signaling initial selling pressure before a minor bounce toward the neckline area.
Head: A sharp drop creating a distinct trough near ~$190–$200, representing the final flush/bottoming attempt. Note the heavy volume spike during the head formation, pointing to strong capitulation and subsequent institutional accumulation.
Right Shoulder: A higher low relative to the head, bottoming out around ~$230–$240 before buyers stepped back in.
Neckline / Resistance Level: The horizontal resistance lies between ~$280 and $285, connecting the reaction high after the left shoulder with the pre-right shoulder rally.
RSI Momentum (14): Currently sitting at 55.72 (signal line at 50.17), trending upward into positive territory to support building bullish momentum.
Key Technical LevelsCurrent Price: ~$271.89
Breakout Level (Neckline): ~$280.00 – $285.00
Pattern Measured Target: ~$370.00 – $375.00
Stop Loss: Below the Right Shoulder low around $230.00 (or a tighter trailing stop around $245.00 to preserve risk-reward).
Profit Target: $370.00 (measured move matching the technical target projection indicated by the yellow vertical bar on the chart).
Risk-to-Reward Ratio: Approximately 1:1.8 to 1:2.5+ depending on entry precision.
This trade setup highlights a classic Inverted Head and Shoulders (iH&S) reversal pattern on the weekly time frame for Adobe Inc. (ADBE).
The pattern marks a transition from a multi-month markdown phase to a potential long-term bullish trend reversal.
Chart Structure Breakdown:
Left Shoulder: Formed around ~$230–$240, signaling initial selling pressure before a minor bounce toward the neckline area.
Head: A sharp drop creating a distinct trough near ~$190–$200, representing the final flush/bottoming attempt. Note the heavy volume spike during the head formation, pointing to strong capitulation and subsequent institutional accumulation.
Right Shoulder: A higher low relative to the head, bottoming out around ~$230–$240 before buyers stepped back in.
Neckline / Resistance Level: The horizontal resistance lies between ~$280 and $285, connecting the reaction high after the left shoulder with the pre-right shoulder rally.
RSI Momentum (14): Currently sitting at 55.72 (signal line at 50.17), trending upward into positive territory to support building bullish momentum.
Key Technical LevelsCurrent Price: ~$271.89
Breakout Level (Neckline): ~$280.00 – $285.00
Pattern Measured Target: ~$370.00 – $375.00
Stop Loss: Below the Right Shoulder low around $230.00 (or a tighter trailing stop around $245.00 to preserve risk-reward).
Profit Target: $370.00 (measured move matching the technical target projection indicated by the yellow vertical bar on the chart).
Risk-to-Reward Ratio: Approximately 1:1.8 to 1:2.5+ depending on entry precision.

💥 Free signals and ideas ➡ t.me/vfinvestment
Exención de responsabilidad
La información y las publicaciones no constituyen, ni deben considerarse como, asesoramiento o recomendaciones financieras, de inversión, de trading u otro tipo, proporcionadas o respaldadas por TradingView. Obtenga más información en Condiciones de uso.
💥 Free signals and ideas ➡ t.me/vfinvestment
Exención de responsabilidad
La información y las publicaciones no constituyen, ni deben considerarse como, asesoramiento o recomendaciones financieras, de inversión, de trading u otro tipo, proporcionadas o respaldadas por TradingView. Obtenga más información en Condiciones de uso.