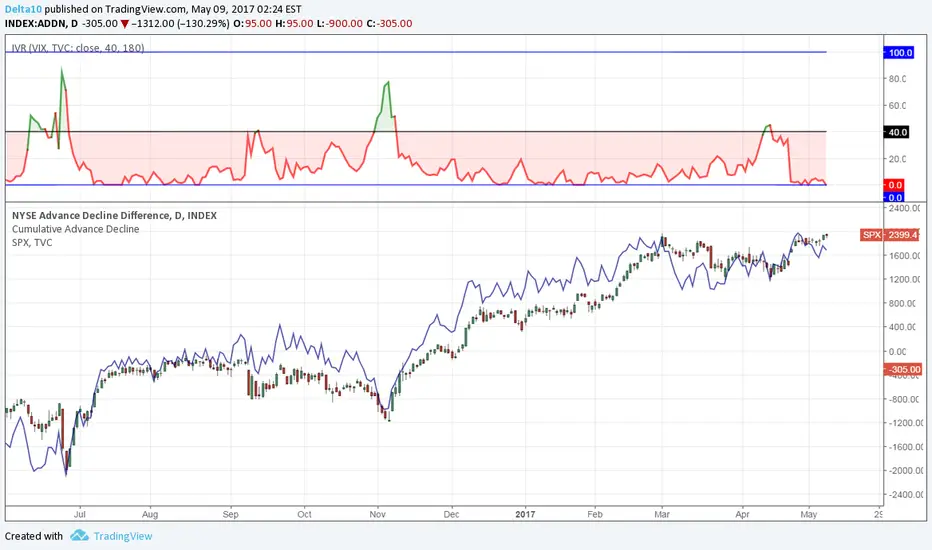
The charts shows that AdvanceDecline Line and VIX are showing the tops and bottoms of S&P price movement. You'll also notice, that ADL is changing direction a few days before the S&P 500 follows. VIX shows how "deep" the correction will be and when it ends.

Exención de responsabilidad
La información y las publicaciones no constituyen, ni deben considerarse como, asesoramiento o recomendaciones financieras, de inversión, de trading u otro tipo, proporcionadas o respaldadas por TradingView. Obtenga más información en Condiciones de uso.
Exención de responsabilidad
La información y las publicaciones no constituyen, ni deben considerarse como, asesoramiento o recomendaciones financieras, de inversión, de trading u otro tipo, proporcionadas o respaldadas por TradingView. Obtenga más información en Condiciones de uso.