
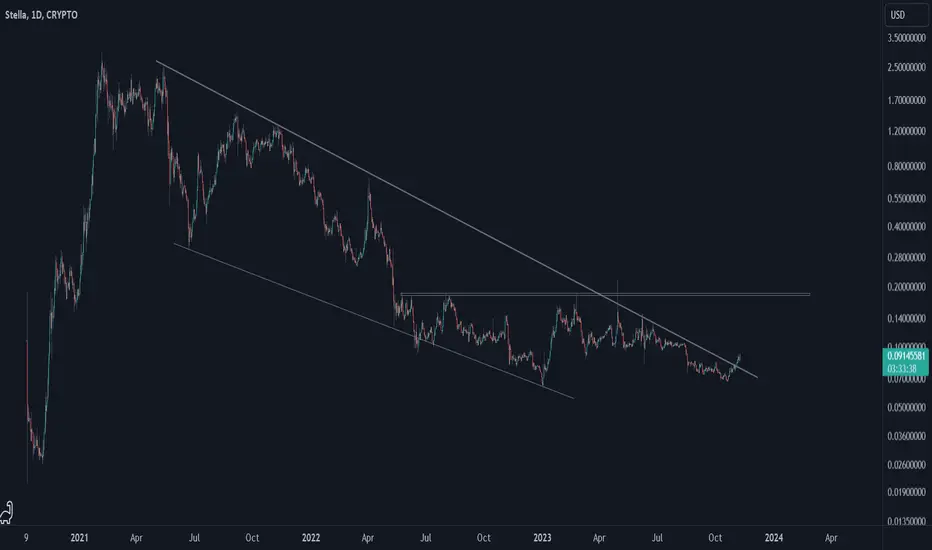
Stella's chart is straightforward; a sharp upward move followed by a lengthy correction wave unfolded in a big descending triangle pattern. Recently, ALPHA broke the major downtrend line. Let's see how up Stella can go.
Nota
Alpha is going crazy!
Nota
So, after Alpha frenzy ended, price came down. Alpha need to break this major horizontal resistance area in order to confirm reversal. Let's see what happens.
Nota
So, Alpha couldn't break the major horizontal resistance area, then went down. It seems Alpha has made an inverted wedge/triangle pattern. Recently, Alpha reached the bottom and then broke the downtrend line. Let's see if Alpha can reach the inverted pattern's top or even break it.
Operación activa
So, Alpha is going up toward the inverted wedge's upper line. Let's see what happens.

Exención de responsabilidad
La información y las publicaciones no constituyen, ni deben considerarse como, asesoramiento o recomendaciones financieras, de inversión, de trading u otro tipo, proporcionadas o respaldadas por TradingView. Obtenga más información en Condiciones de uso.
Exención de responsabilidad
La información y las publicaciones no constituyen, ni deben considerarse como, asesoramiento o recomendaciones financieras, de inversión, de trading u otro tipo, proporcionadas o respaldadas por TradingView. Obtenga más información en Condiciones de uso.