
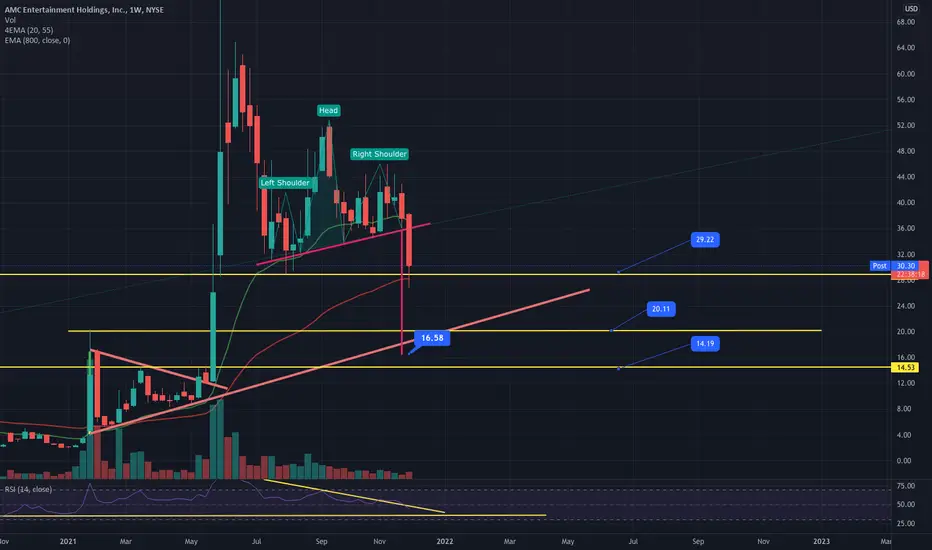
We can now see a clear head and shoulders pattern executed on the weekly time frame. The stock has bounced slightly off the 55 weekly moving average currently finding support at around $29 which was the previous swing low from August. The technical target from the head and shoulders pattern would bring the price to around $16.
Levels of support :
If we fail to hold support at $29 and lose the weekly 55 moving average we have $20 which is a previous swing high as labeled (top of previous pendant wick) and $14.33 ( previous swing high from first pendant.
Levels of support :
If we fail to hold support at $29 and lose the weekly 55 moving average we have $20 which is a previous swing high as labeled (top of previous pendant wick) and $14.33 ( previous swing high from first pendant.

Exención de responsabilidad
La información y las publicaciones no constituyen, ni deben considerarse como, asesoramiento o recomendaciones financieras, de inversión, de trading u otro tipo, proporcionadas o respaldadas por TradingView. Obtenga más información en Condiciones de uso.
Exención de responsabilidad
La información y las publicaciones no constituyen, ni deben considerarse como, asesoramiento o recomendaciones financieras, de inversión, de trading u otro tipo, proporcionadas o respaldadas por TradingView. Obtenga más información en Condiciones de uso.