
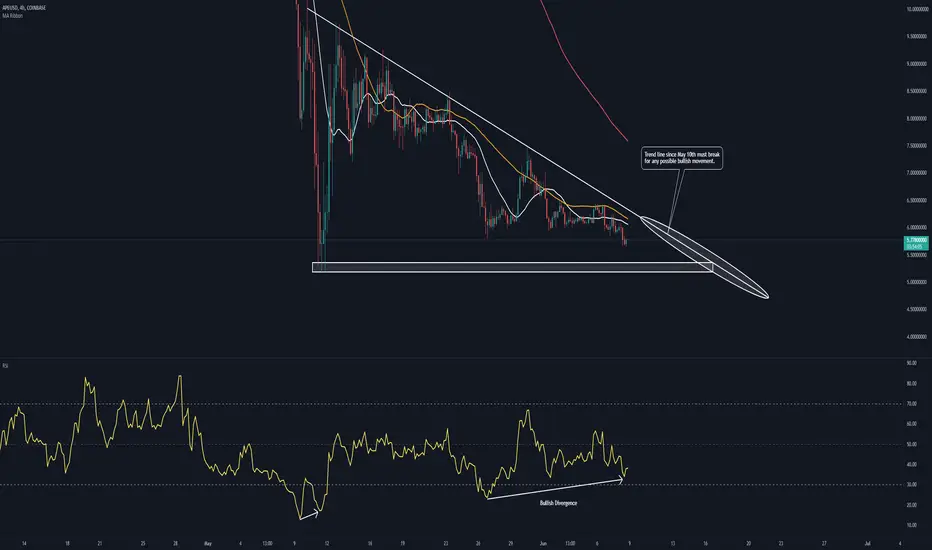
On the 4H chart (and other timeframes), we can see bullish divergence forming where the price action is heading lower and the RSI is making higher lows. This could be a sign of a small reversal coming soon.
Currently, the 4H 50MA (orange line) is acting as resistance, so if we get above that, that would be a good start for a move up.
Support is at $5.20. A break below would invalidate this idea.
Currently, the 4H 50MA (orange line) is acting as resistance, so if we get above that, that would be a good start for a move up.
Support is at $5.20. A break below would invalidate this idea.

Exención de responsabilidad
La información y las publicaciones no constituyen, ni deben considerarse como, asesoramiento o recomendaciones financieras, de inversión, de trading u otro tipo, proporcionadas o respaldadas por TradingView. Obtenga más información en Condiciones de uso.
Exención de responsabilidad
La información y las publicaciones no constituyen, ni deben considerarse como, asesoramiento o recomendaciones financieras, de inversión, de trading u otro tipo, proporcionadas o respaldadas por TradingView. Obtenga más información en Condiciones de uso.