
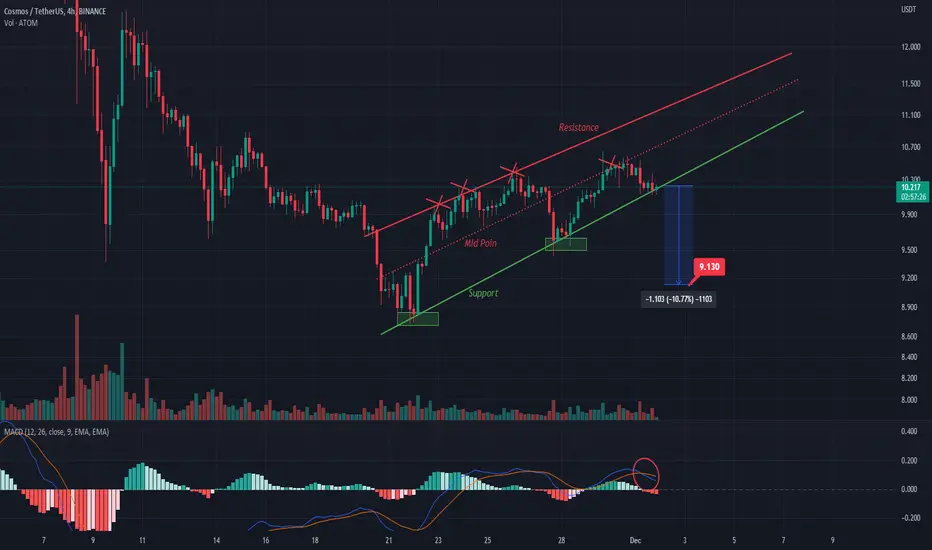
Hey guys today i'm going analysis ATOM USDT pair in 4H time frame, let's jump in to the chart.
1)This is short term analysis,in first we have Rising Wedge pattern and then price Rejected few time from Resistance line and after few Rejections price moved down to test Support line and price bounced from Support line and moved to upside again, so then price didn't move for test again Resistance line and Rejected from Mid point from Rising Wedge pattern, this is bad sign if price can't move and test Resistance level after support level and Rejected from Midpoint line of Wedge .If we saw this type of scenario and we did now, a lot of chance price will BreakDown after testing Support line.
2)If price close candle at $9.8 in 4H time frame so we can confirm Break Down Target would be approximately $9.
3) MACD have Bearish Cross and Histogram are turned red now, so this is also bear sign.
Have a Good Day)))
Operación activa
Open SHORT target now diagonal support was BrokenOrden cancelada
Stop Short PositionOperación cerrada: objetivo alcanzado
Target Reached $9.1
Exención de responsabilidad
La información y las publicaciones no constituyen, ni deben considerarse como, asesoramiento o recomendaciones financieras, de inversión, de trading u otro tipo, proporcionadas o respaldadas por TradingView. Obtenga más información en Condiciones de uso.
Exención de responsabilidad
La información y las publicaciones no constituyen, ni deben considerarse como, asesoramiento o recomendaciones financieras, de inversión, de trading u otro tipo, proporcionadas o respaldadas por TradingView. Obtenga más información en Condiciones de uso.