
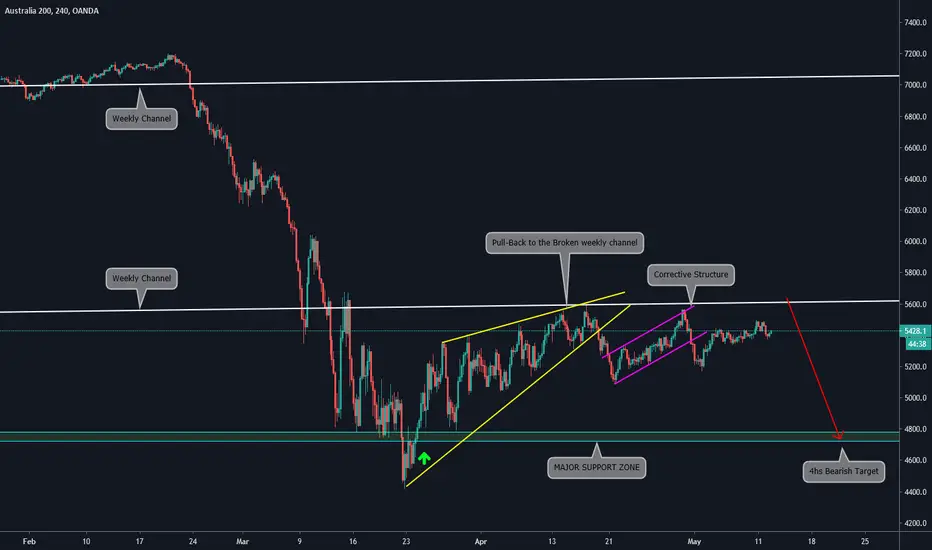
Main items we can see on the 4HS chart:
a)From the Historical Higher High at 7200 the price made a bearish movement and found support at 4800
b)From there we observed a bullish movement towards the Broken ascending trendlines of the previous ascending motive waves
c)The structure that we can see is a Wedge Pattern doing a pullback to the previous ascending trendline
d)We saw a breakout of the wedge pattern and a corrective structure next to it
e)Our Forecast is that there is a major resistance zone at 5600 -5650 and we will expect a bearish movement towards 4700-4800
WEEKLY CHART:

Exención de responsabilidad
La información y las publicaciones no constituyen, ni deben considerarse como, asesoramiento o recomendaciones financieras, de inversión, de trading u otro tipo, proporcionadas o respaldadas por TradingView. Obtenga más información en Condiciones de uso.
Exención de responsabilidad
La información y las publicaciones no constituyen, ni deben considerarse como, asesoramiento o recomendaciones financieras, de inversión, de trading u otro tipo, proporcionadas o respaldadas por TradingView. Obtenga más información en Condiciones de uso.