

Hey guys,
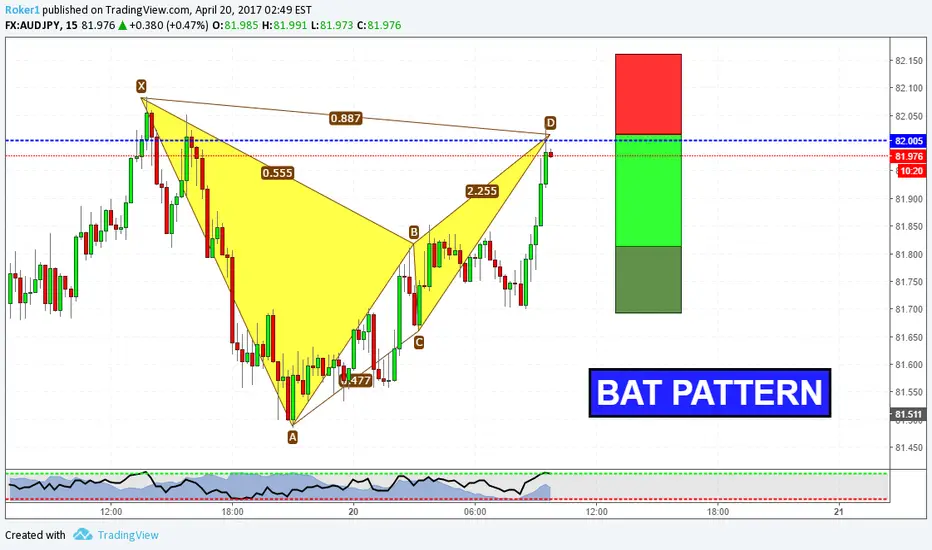
i don't usually trade in these lower timeframe, but this time i think it could be a nice level to short. The blue line represents a previous level of structure, and price has created new lows breaking through that level. So i'm thinking it could turn into resistance and hold the price's rally.
Stops above X, targets as usual for harmonic patterns.
If you have any questions, feel free to comment below.
Otherwise, see you in the next chart!
Operación cerrada: precio stop alcanzado

Exención de responsabilidad
La información y las publicaciones no constituyen, ni deben considerarse como, asesoramiento o recomendaciones financieras, de inversión, de trading u otro tipo, proporcionadas o respaldadas por TradingView. Obtenga más información en Condiciones de uso.
Exención de responsabilidad
La información y las publicaciones no constituyen, ni deben considerarse como, asesoramiento o recomendaciones financieras, de inversión, de trading u otro tipo, proporcionadas o respaldadas por TradingView. Obtenga más información en Condiciones de uso.