

AUDUSD Liquidity Grab Completed – Is a Bullish Expansion Next?
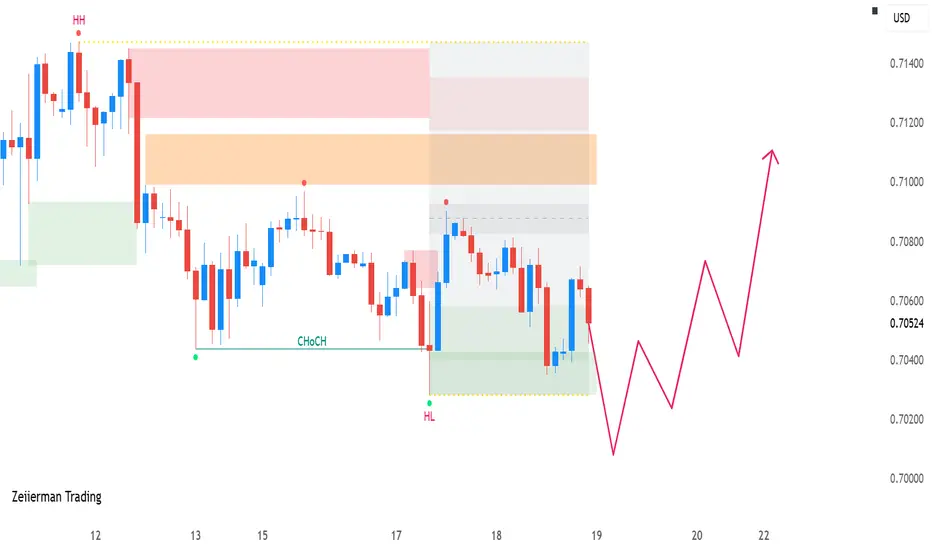
The chart highlights a developing structural transition on AUDUSD, where price action is reacting from a defined demand zone after printing a clear Change of Character (CHoCH). Following the previous lower high sequence, the market swept liquidity, formed a reaction low, and is now attempting to establish a higher low (HL) — a key early signal of potential bullish continuation.
🔎 Structure Breakdown
Previous Higher High (HH) marked near 0.7140
Bearish impulse created internal weakness
CHoCH confirms short-term structural shift
Liquidity sweep below support before strong reaction
Current price compressing inside demand (0.7030–0.7050 region)
The green zone represents a high-probability demand area where buyers stepped in aggressively. The long lower wick near the HL suggests absorption of sell-side liquidity, increasing the probability of upside rotation.
📈 Bullish Scenario
If price holds above the higher low:
First upside objective → 0.7080 liquidity pocket
Mid-range target → 0.7100–0.7120 supply zone
Extended move → Retest of 0.7140 highs
The projected path suggests a corrective pullback followed by continuation toward premium pricing inside the orange supply imbalance.
📉 Bearish Risk
Invalidation occurs on a clean breakdown below the highlighted demand and HL level. A decisive close under 0.7020 would reopen downside liquidity toward 0.7000 psychological support.
📊 Trading Insight
This setup reflects classic Smart Money Concepts (SMC) structure:
Liquidity sweep
CHoCH confirmation
Higher low formation
Discount accumulation before premium targeting
Traders should monitor momentum shift on lower timeframes for confirmation entries.
🔎 Structure Breakdown
Previous Higher High (HH) marked near 0.7140
Bearish impulse created internal weakness
CHoCH confirms short-term structural shift
Liquidity sweep below support before strong reaction
Current price compressing inside demand (0.7030–0.7050 region)
The green zone represents a high-probability demand area where buyers stepped in aggressively. The long lower wick near the HL suggests absorption of sell-side liquidity, increasing the probability of upside rotation.
📈 Bullish Scenario
If price holds above the higher low:
First upside objective → 0.7080 liquidity pocket
Mid-range target → 0.7100–0.7120 supply zone
Extended move → Retest of 0.7140 highs
The projected path suggests a corrective pullback followed by continuation toward premium pricing inside the orange supply imbalance.
📉 Bearish Risk
Invalidation occurs on a clean breakdown below the highlighted demand and HL level. A decisive close under 0.7020 would reopen downside liquidity toward 0.7000 psychological support.
📊 Trading Insight
This setup reflects classic Smart Money Concepts (SMC) structure:
Liquidity sweep
CHoCH confirmation
Higher low formation
Discount accumulation before premium targeting
Traders should monitor momentum shift on lower timeframes for confirmation entries.
Operación activa
Operación cerrada: objetivo alcanzado

Exención de responsabilidad
La información y las publicaciones no constituyen, ni deben considerarse como, asesoramiento o recomendaciones financieras, de inversión, de trading u otro tipo, proporcionadas o respaldadas por TradingView. Obtenga más información en Condiciones de uso.
Exención de responsabilidad
La información y las publicaciones no constituyen, ni deben considerarse como, asesoramiento o recomendaciones financieras, de inversión, de trading u otro tipo, proporcionadas o respaldadas por TradingView. Obtenga más información en Condiciones de uso.