

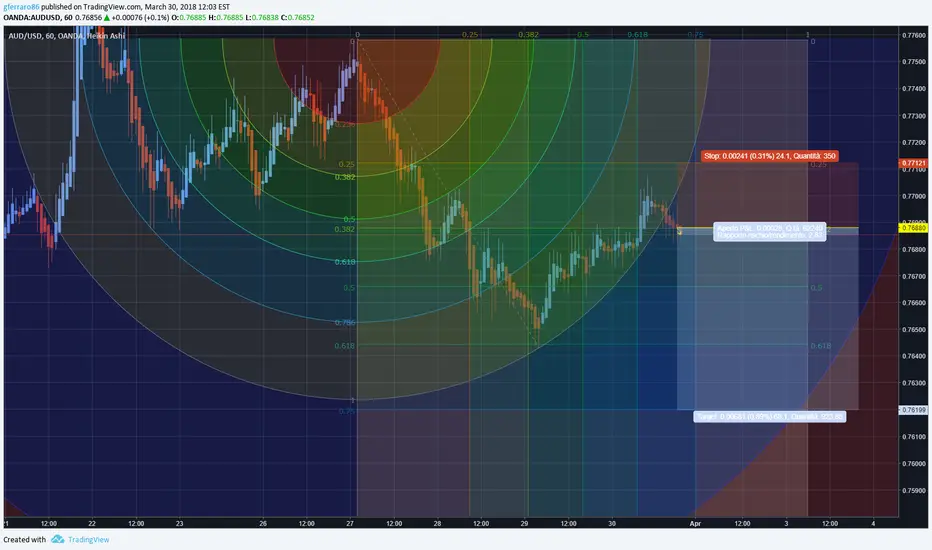
AUDUSD short
Nota
The idea is really easy and completely based on math. The audusd graph is actually a downtrend. I used the Fibonacci half circle to identify interesting price levels where the price has moved in the near past and where it's still reacting now. As soon as the price, after jumping up and down inside the tunnel, broken down again I opened a sell position. I also used the gann square to identify my target points and my stop loss. Really basic reference points. You can Easley find all the interesting points onthe graph I've shared
Exención de responsabilidad
La información y las publicaciones no constituyen, ni deben considerarse como, asesoramiento o recomendaciones financieras, de inversión, de trading u otro tipo, proporcionadas o respaldadas por TradingView. Obtenga más información en Condiciones de uso.
Exención de responsabilidad
La información y las publicaciones no constituyen, ni deben considerarse como, asesoramiento o recomendaciones financieras, de inversión, de trading u otro tipo, proporcionadas o respaldadas por TradingView. Obtenga más información en Condiciones de uso.