

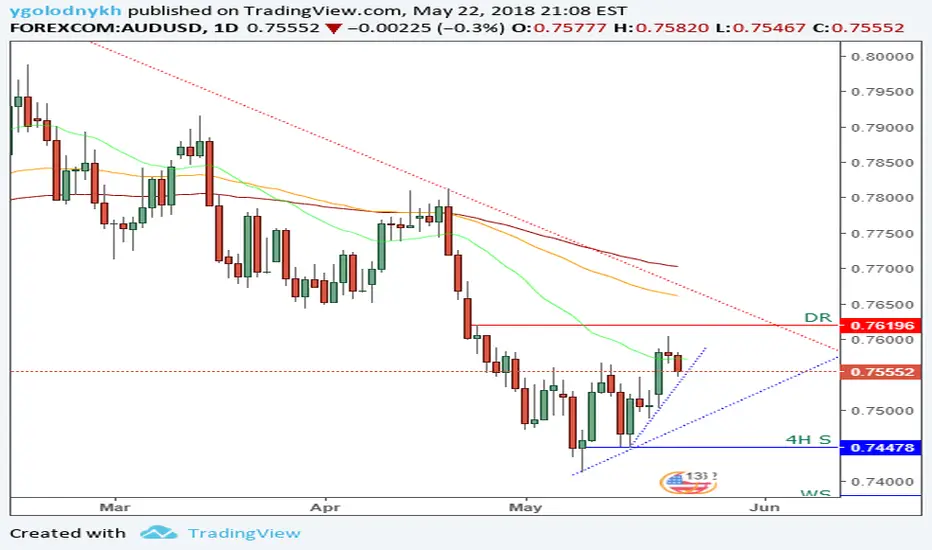
Recent Price Action: Bullish
Pattern: Rising wedge (short-term correction)
Long-Term Momentum: Bearish
Short-Term Momentum: Bearish
Bias: Short
Action: Potentially enter short position after price breaks 4H trend support. Otherwise, wait until price closes and tests trend support on the daily chart.
Comments: Price had a strong retracement after a huge sell-off. Price was able to test the 29 EMA but failed to continue to push higher after. The red candle that closed above the 29 EMA indicates major indecision and is often followed by a reversal which we are experiencing now.
Pattern: Rising wedge (short-term correction)
Long-Term Momentum: Bearish
Short-Term Momentum: Bearish
Bias: Short
Action: Potentially enter short position after price breaks 4H trend support. Otherwise, wait until price closes and tests trend support on the daily chart.
Comments: Price had a strong retracement after a huge sell-off. Price was able to test the 29 EMA but failed to continue to push higher after. The red candle that closed above the 29 EMA indicates major indecision and is often followed by a reversal which we are experiencing now.

Exención de responsabilidad
La información y las publicaciones no constituyen, ni deben considerarse como, asesoramiento o recomendaciones financieras, de inversión, de trading u otro tipo, proporcionadas o respaldadas por TradingView. Obtenga más información en Condiciones de uso.
Exención de responsabilidad
La información y las publicaciones no constituyen, ni deben considerarse como, asesoramiento o recomendaciones financieras, de inversión, de trading u otro tipo, proporcionadas o respaldadas por TradingView. Obtenga más información en Condiciones de uso.